Mass distribution in our Galaxy
Abstract
This article summarizes recent work on the luminosity and mass distribution of the Galactic bulge and disk, and on the mass of the Milky Way’s dark halo. A new luminosity model consistent with the COBE NIR data and the apparent magnitude distributions of bulge clump giant stars has bulge/bar length of , axis ratios of 1:(0.3-0.4):0.3, and short disk scale-length (). Gas-dynamical flows in the potential of this model with constant M/L fit the terminal velocities in very well. The luminous mass distribution with this M/L is consistent with the surface density of known matter near the Sun, but still underpredicts the microlensing optical depth towards the bulge. Together, these facts argue strongly for a massive, near-maximal disk in our , Sbc spiral Galaxy. While the outer rotation curve and global mass distribution are not as readily measured as in similar spiral galaxies, the dark halo mass estimated from satellite velocities is consistent with a flat rotation curve continuing on from the luminous mass distribution.
Appl. Opt. Ortwin Gerhard, Astronomisches Institut der Universität Basel, Venusstrasse 7, CH-4102 Binningen, Switzerland, email: Ortwin.Gerhard@unibas.ch
1 Luminosity distribution of the bulge and disk
Because of the strong dust obscuration by the intervening disk, the structure of the inner Galaxy is best analyzed in the NIR. Figure 1 shows the NIR luminosity model for the Galactic bulge/bar and disk obtained by Bissantz & Gerhard (2002) from the COBE/DIRBE L-band data, for bar angle wrt the Sun-Galactic Center line. This model was found by a penalized maximum likelihood estimation of the data, with penalty terms encouraging a four-armed logarithmic spiral structure in the disk (Ortiz & Lépine 1993) and discouraging deviations from smoothness and triaxial symmetry. The L-band data used had been dereddened by Spergel, Malhotra & Blitz (1996), with a three-dimensional model of the dust based on the COBE/DIRBE 240 data. The L-band data rather than the K-band data were used in order to minimize the effects of the dust.
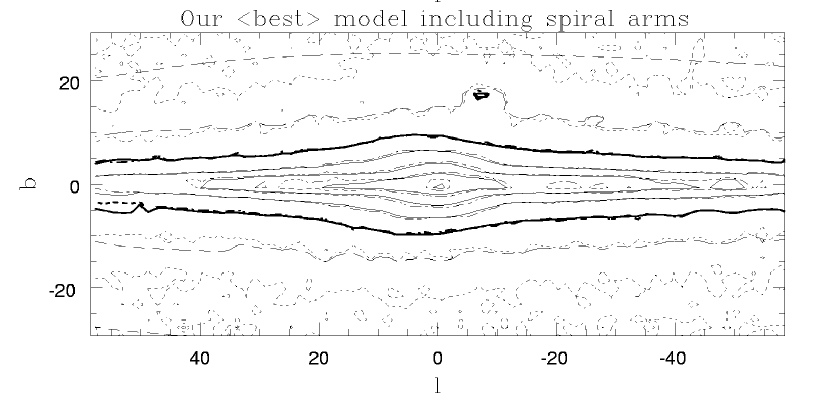


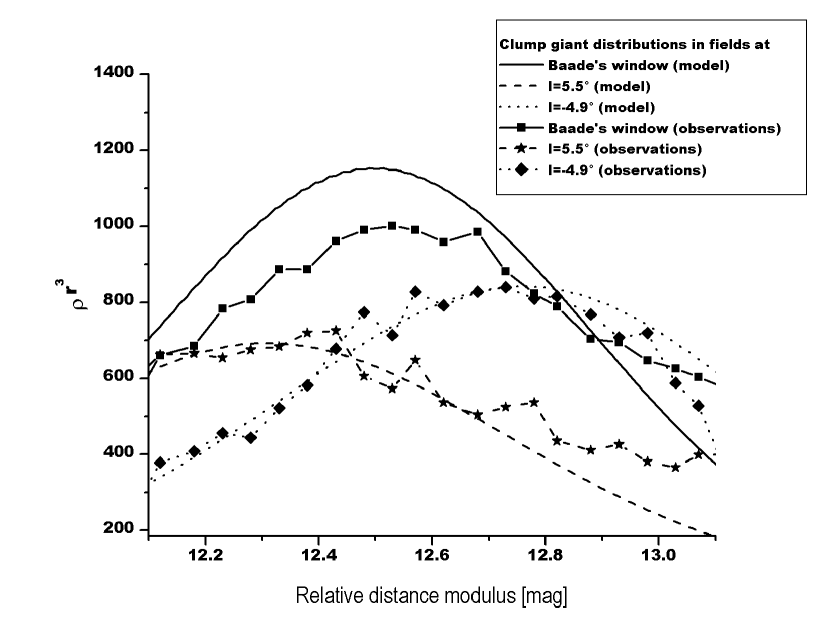
Spiral arms make the model appear more elongated on the sky, so the bar in Fig. 1 is more elongated than in the previous COBE model of Binney, Gerhard & Spergel (1997). The bar length is and the axis ratios are 1:(0.3-0.4):0.3, in reasonable agreement with starcount models (10:4:3 from clump giant stars, Stanek et al. 1997; 10:5.4:3.3 from NIR star counts in strips across the bulge, López-Corredoira et al. 2000). The contours in Fig. 1 show that both the bulge and disk vertical profiles are approximately exponential. The same is true for the radial disk profile; a fit gives a short scale length of . The luminosity distribution shown in Fig. 1 also gives a good match to the apparent magnitude distributions of clump giants measured by Stanek et al. (1997), when an intrinisic luminosity spread of 0.3 mag is assumed for these stars, matching well the asymmetry of the peak positions in the fields near wrt to Baade’s window, and also the relative peak amplitudes within (Figure 2). This shows that the line-of-sight distribution of luminosity in the bulge part is approximately correct. This also constrains the bar angle; Bissantz & Gerhard (2002) estimate , with the best models obtained for .
2 Mass distribution of the Galactic disk
Converting this luminosity model into a mass model requires additional kinematic data. Bissantz, Englmaier & Gerhard (2002) computed hydrodynamical models in the gravitational potential of the COBE luminosity model, assuming a constant NIR for the bulge and disk, and including a dark halo component in some models. They then fitted these models to the observed terminal velocity curve (TVC) for HI and CO gas in the Milky Way. Figure 3 shows the observed TVC and a scaled model terminal curve obtained with the assumption that the stellar component provides most of the mass in the inner Galaxy (“maximal disk assumption”) and that . Due to resolution problems in the innermost the fit was restricted to longitudes . The figure shows that the model fits
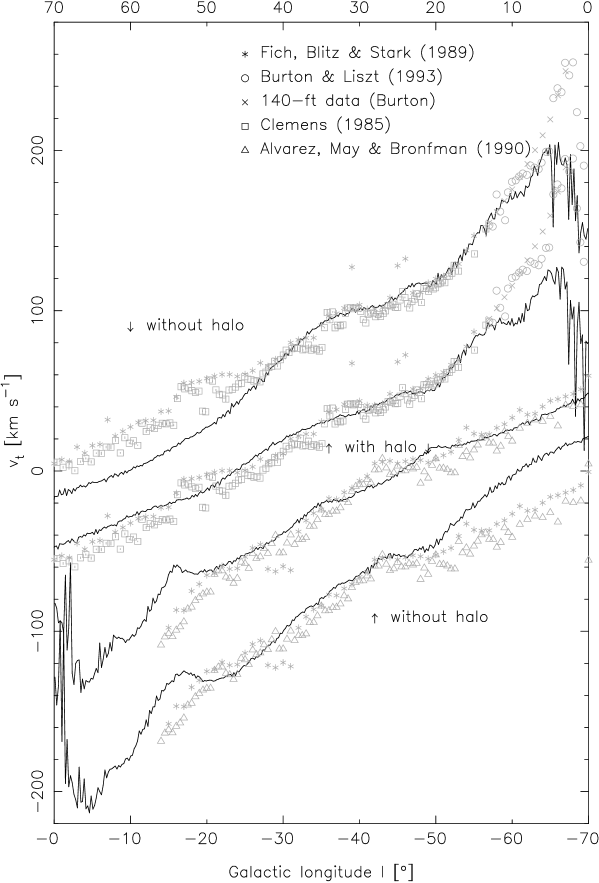
the data very well in the fitted longitude range, even including some bumps due to the spiral arms. With this scaling, the bulge and disk components account for just under circular velocity at the Sun. When , an additional dark halo component is needed to match the TVC only outside . Fig. 3 also shows a model including a quasi-isothermal halo; this model extends the good fit to the terminal velocities to where the simulation ends. The total luminous mass in this model to is , of which perhaps belong to the bulge, depending on the precise decomposition.
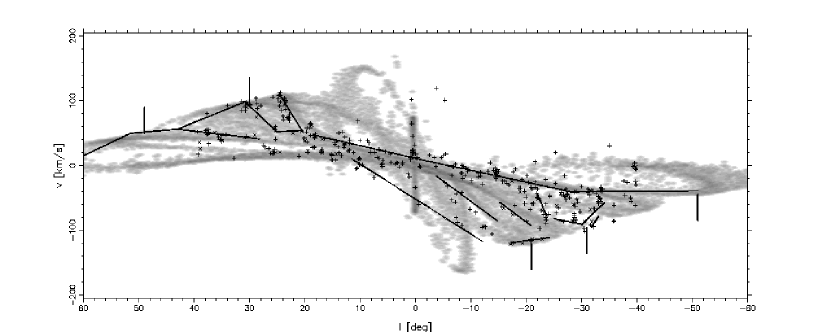
The most important parameter in these models, the bar pattern speed, is . The spiral arms are assumed to rotate at a second, different pattern speed, . An –diagram for this model with a dark halo component included is shown in Figure 4 at the optimal phase between bar and spiral arms for an observer at and from the bar’s major axis. The overplotted line segments represent high emission ridges (spiral arms) in the CO data of Dame, Hartmann & Thaddeus (2001). The model represents the arm ridges outside corotation very well, and also the gap in the CO –diagram seen immediately outside the 3 kpc arm. This gap signifies that the main spiral arms remain well-defined through the corotation region of the bar, the principal reason for preferring a model with two pattern speeds over one with a single corotating pattern. The model does not match well the amplitude of the non-circular velocities of the –arm. However, the transition between the bar and spiral arms in the luminosity model is not very well constrained by the NIR data and hence the detailed gravitational potential in this region is likewise uncertain. By increasing the spiral arm amplitude in this region it is possible to obtain models with non-circular velocity at . By comparing a number of gas-dynamical models to the CO data, we have estimated the bar pattern speed , the corresponding corotation radius , and the preferred bar angle ; i.e., the Galactic bar is a fast rotator.
Matching these maximum disk models for , , to the terminal velocity curve predicts surface mass densities – at the position of the Sun. Azimuthally averaging over the spiral arm model along a ring at gives slightly higher values of –, showing that the precise location of the Sun between spiral arms does not have a large effect. For comparison, the local surface density of ‘identified matter’ is (Kuijken & Gilmore 1991, Flynn & Fuchs 1994, Holmberg & Flynn 2000). Of this about is in gas and brown and white dwarfs, which contribute most to the uncertainty. That the observed and predicted surface density approximately agree lends support to the conclusion that the Galaxy indeed has a near–maximum disk; the combined observational and model uncertainty is about in mass. By contrast, a constant-M/L NIR Galaxy accounting for only of the rotation velocity at , as advocated for spiral galaxies by Courteau & Rix (1999), would have . Turned around, if the NIR disk and bulge are given the value implied by the local surface density measurement, then they account for the observed terminal velocities in the inner Galaxy. Compared to earlier analyses, the main difference is the short disk scale–length (see Sackett 1997; in the model above a fit in the inner Galaxy gives ) – for constant the Sun is well beyond the maximum in the rotation curve from only NIR luminous matter.
The agreement between the measured local surface density near the Sun with that predicted by maximum disk models, the detailed fit of the terminal velocity curve by these models, and the need for substantial baryonic mass in the inner Galaxy required by the bulge microlensing observations (discussed below), all provide evidence that a maximum disk solution in the Milky Way is approximately correct.
3 Microlensing
Microlensing observations provide important new constraints on the Galactic mass distribution. Several hundred microlensing events have now been observed towards the Galactic bulge. These observations give information about the integrated mass density towards the survey fields as well as about the lens mass distribution. The most robust observable is the total optical depth averaged over the observed fields, . Early measurements gave surprisingly high values (Udalski et al. 1994, Alcock et al. 1997), where . Recently, Alcock et al. (2000a) measured for all sources from 99 events centered on , using a difference image analysis (DIA) technique. From this measurement they deduced for the same direction for bulge sources only. Finally, in a preliminary analysis of 52 clump giant sources in 77 Macho fields, which do not suffer from blending problems, Popowski et al. (2000) found a lower centered on .
Axisymmetric Galactic models predict , insufficient to explain the quoted optical depths (Kiraga & Paczynski 1994, Evans 1994). Models with a nearly end–on bar enhance because of the longer average line-of-sight from lens to source. The maximum effect occurs for when for (Zhao & Mao 1996). In addition, increases with the mass and the length of the bar/bulge.
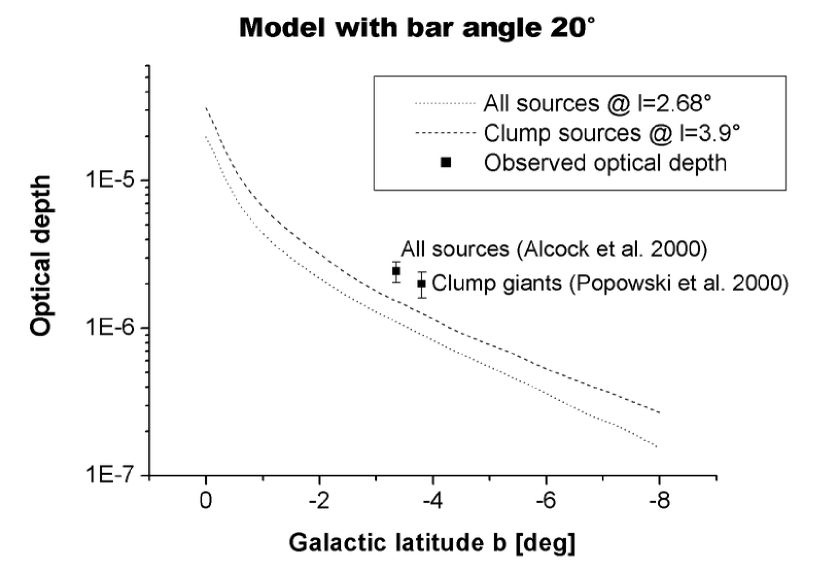
However, models based on barred mass distributions derived from Milky Way observations typically give (e.g., Zhao, Spergel & Rich 1995, Stanek et al. 1997, Bissantz et al. 1997), significantly less than most of the measured optical depths. Figure 5 shows values of the optical depth for the new COBE bar model of Bissantz & Gerhard (2002) as function of latitude, at the central longitude positions of the new microlensing measurements. The mass normalization of the disk and bulge in this model is calibrated by assuming constant L-band mass-to-light ratio and by matching the predicted gas flow velocities in a hydrodynamic simulation to the Galactic terminal velocity curve; see §§1,2. The numerical values are for all sources at the position of the DIA measurement and for clump giant sources at the centroid position given by Popowski et al. (2000).
Because the apparent magnitude distributions for clump giant stars predicted by this model agree closely with those measured by Stanek et al. (1997) – see Fig. 2 – this model gives a good approximation to the distribution of microlensing sources. Changing the quoted optical depths substantially is therefore hard unless the mass distribution of the lenses differs substantially from that of the sources.
The model prediction for clump giant sources is within of the Popowski et al. MACHO value. On the other hand, the recent DIA value is still some away from the model prediction. While the NIR model prediction could be slightly increased if the mass-to-light ratio were not spatially constant, this is only a effect since limited by the terminal velocity curve (Bissantz et al. 1997). Binney, Bissantz & Gerhard (2000) used general arguments to show that an optical depth for bulge sources as large as that implied by the MACHO DIA measurement is very difficult to reconcile with the Galactic rotation curve and local mass density, even for a barred model and independent of whether mass follows light. To illustrate this, the extra optical depth required would correspond to an additional mass surface density towards the bulge of some at the optimal location half-way to the bulge. This is comparable to the luminous surface mass density in the NIR model (some but not optimally located, Bissantz & Gerhard 2002). It will be important to check whether the DIA measurement could still be significantly affected by blending.
Regardless of the resolution of this problem, these results have a further important implication. If a model based on the maximal disk assumption and calibrated with the terminal velocities still underpredicts the observed bulge microlensing optical depths, we can certainly not afford to lose a significant fraction of this mass to a non-lensing CDM dark halo. Indeed, from the LMC microlensing experiments (Alcock et al. 2000b) at most a fraction of the dark matter halo contributes to microlensing. Thus the bulge microlensing results independently argue strongly for a massive disk (see also Gerhard 2001 and Binney & Evans 2001).
4 The dark halo
Determining the total size and mass of the Galactic halo is of much interest, but has proved a difficult problem. The gas rotation curve outside the solar radius is much less well known in the MW than in other galaxies (see, e.g., Dehnen & Binney 1998), and it does not extend beyond . Estimates of the mass of the outer halo have therefore principally relied on the measured radial velocities and proper motions of the distant Galactic satellites and globular clusters (Little & Tremaine 1987, Kochanek 1996, Wilkinson & Evans 1999). One problem has been the sensitivity of the mass estimates to whether or not the Leo I dwarf galaxy is assumed to be bound to the MW and included in the analysis. This problem has only been overcome with the availability of proper motion velocity measurements.
In the most recent analysis, Wilkinson & Evans (1999) used radial velocities of 27 objects at galactocentric distances greater than and proper motions for six of these. They conducted a likelihood analysis based on fitted parametric mass and number density models and simple spherical anisotropic distribution functions for the satellites. Within these model assumptions they determined most probable values for the total halo mass, size, and mass within , as well as error estimates based on the likelihood contours. The resulting total halo mass within the cutoff radius (typically ) is , and the mass within is . Values near the upper end of the range at are consistent with a flat rotation curve with . It is clear that the errors on these estimates are still very considerable, mostly because of the small sample size and the large proper motion errors. Wilkinson & Evans discuss how these estimates can be tightened in the future using ground based radial velocities for a sample of BHB stars and accurate satellite measurements of proper motions for the known satellites.
The shape of the Galactic dark halo is constrained by measurements of the distribution and kinematics of halo stars, data on the distribution and kinematics of tidal streams, flaring of the gas layer, and the comparison of microlensing optical depths along different lines-of-sight. These constraints have recently been reviewed by van der Marel (2001). While values of for the halo axial ratio appear most consistent with the data, it is hard to rule out any axial ratio from the present observations. Perhaps the most promising method is that based on tidal streams. At present Ibata et al. (2001) base their analysis of the Sagittarius stream on only 38 Carbon stars, inferring from their apparent distribution on a great circle on the sky and a comparison with numerical simulations that the dark halo must be nearly spherical, with . Similar, larger datasets would clearly be very valuable.
References
- [] Alcock C., et al. , 1997, ApJ, 479, 119
- [] Alcock, C., et al. 2000a, ApJ, 541, 734
- [] Alcock, C., et al. 2000b, ApJ, 542, 281
- [] Binney, J.J., Bissantz N., Gerhard, O.E., 2000, ApJL, 537, L99
- [] Binney, J.J., Evans, N.W., 2001, MNRAS, 327, L27
- [] Binney, J.J., Gerhard, O.E., & Spergel, D.N. 1997, MNRAS, 288, 365 (BGS)
- [] Bissantz, N., Englmaier, P., Binney, J.J., & Gerhard, O.E. 1997, MNRAS, 289, 651
- [] Bissantz, N., Gerhard, O.E. 2002, MNRAS, in press
- [] Bissantz, N., Englmaier, P., Gerhard, O.E. 2002, MNRAS, submitted
- [] Courteau S., Rix H.-W., 1999, ApJ, 513, 561
- [] Dame T.M., Hartmann, D., Thaddeus P., 2001, ApJ, 547, 792
- [] Dehnen W., Binney J.J., 1998, MNRAS, 294, 429
- [] Evans N.W., 1994, Astrophys. J. (Letters) 437, L31
- [] Flynn C., Fuchs B., 1994, Mon. Not. R. astr. Soc. 270, 471
- [] Gerhard, O., 2001, ASP Vol. 230, eds. Funes J.G., S.J., Corsini E.M., 21
- [] Holmberg, J., & Flynn, C. 2000, MNRAS, 313, 209
- [] Ibata, R., Lewis, G.F., Irwin, M., Totten, E., Quinn, T., 2001, Astrophys. J. 2, 94 311
- [] Kiraga M., Paczyński B., 1994, Astrophys. J. 4, 30 L101
- [] Kochanek, C., 1996, ApJ, 457, 228
- [] Kuijken K., Gilmore G., 1991, Astrophys. J. 367, L9
- [] Little, B., Tremaine, S.D., 1987, ApJ, 320, 493
- [] López-Corredoira M., Hammersley P.L., Garzón F., et al., 2000, Mon. Not. R. astr. Soc. 313, 392
- [] Ortiz R., Lépine J.R.D., 1993, Astr. Astrophys. 279, 90
- [] Popowski P., et al., 2000, ASP, in press, astro-ph 0005466
- [] Sackett P.D., 1997, ApJ, 483, 103
- [] Spergel D.N., Malhotra S., Blitz L., 1996, in: Spiral Galaxies in the Near-IR, eds. D. Minniti, H.-W. Rix, Springer, Berlin, 128
- [] Stanek K.Z., et al. 1997, ApJ, 477, 163
- [] Udalski A. et al. , 1994, Acta Astron., 44, 165
- [] van der Marel, R.P., astro-ph/0107248
- [] Wilkinson, M.I., Evans, N.W., 1999, MNRAS, 310, 645
- [] Zhao H.S., Mao S., 1996, MNRAS, 283, 1197
- [] Zhao H.S., Spergel D.N., Rich R.M., 1995, ApJ, 440, L13