The Galactic Bar
Abstract
The Milky Way has a barred bulge. This article summarizes the current understanding of the main structural parameters and pattern speed of the bar, and compares predicted values for the microlensing optical depth with the bulge microlensing observations.
Astronomisches Institut, Universität Basel
Venusstrasse 7,
CH-4102 Binningen, Switzerland,
email: Ortwin.Gerhard@unibas.ch
1. Introduction
In the last ten years it has been established that the Milky Way is a barred Galaxy. More precisely, its central bulge is a rapidly rotating bar. While there had been a number of papers since the 1970’s arguing that the large non-circular motions seen in HI and CO observations of the inner Galaxy were best interpreted in terms of a barred potential (e.g, Peters 1975, Cohen & Few 1976, Liszt & Burton 1980, Gerhard & Vietri 1986, Mulder & Liem 1986), it was only in the 1990’s that the combined evidence from the NIR light distribution (Blitz & Spergel 1991, Weiland et al. 1994, Binney, Gerhard & Spergel 1997), source count asymmetries (Nakada et al. 1991, Stanek et al. 1997, Nikolaev & Weinberg 1997), gas kinematics (Binney et al. 1991, Englmaier & Gerhard 1999, Fux 1999, Weiner & Sellwood 1999), and large microlensing optical depth (Udalski et al. 1994, Zhao, Spergel & Rich 1995, Han & Gould 1995, Alcock et al. 1997, Stanek et al. 1997) has convinced most workers in the field.
The emphasis of recent work has shifted towards determining parameters like the orientation, size, and pattern speed of the bar, and towards constructing a unifying quantitative model, within which the various observational results can be coherently explained. Furthermore, from such a model we should be able to predict the dynamical state of the Galactic bulge and inner disk, and to understand effects of the bar on Galactic evolution, such as how it facilitates mass inflow, star formation, and chemical homogenization of the disk. This work is still very much in progress, with the answers to several important questions not yet clear. For example, do we need to make a distinction between the barred bulge and a bar in the disk, between components of different age and metallicity? To what extent do the various tracers (NIR light, clump giants, NIR star counts and IRAS sources) represent the mass distribution? Can we quantitatively explain the kinematics of the Galactic centre gas and the arm, predict the locations of the Galactic spiral arms, and decide whether they are seen in the old stars as well as the gas? How does the large microlensing optical depth fit in? Can we correctly predict with dynamical models the observed stellar kinematics in the bulge and the measured microlensing duration distribution?
In this article, I would like to report on some steps towards such a unifying model, concentrating on the photometric structure (§2) and pattern speed of the bar (§3), and the predicted bulge microlensing (§4). For a more extensive review than given here see Gerhard (1999). All length scales given below are for a Sun-center distance .
2. Photometric structure
The most detailed models for the distribution of old stars in the inner Galaxy are currently based on the COBE/DIRBE NIR data. These data have complete sky coverage, and broad-band emission maps are available over a large wavelength range from the NIR to the FIR, but they have relatively low spatial resolution, they must still be ‘cleaned’ for residual dust absorption, and they contain no distance information, so deprojection is not straightforward. The cleaned data show that the bulge is brighter and more extended in latitude at positive longitudes than at corresponding , except for a region close to the center where the effect is reversed (Weiland et al. 1994, Bissantz et al. 1997). The asymmetry is strongest around . These signatures are as expected for a barred bulge with its long axis in the first quadrant (Blitz & Spergel 1991), and contain information about the bar’s shape and orientation. The region of reversed asymmetry at small argues for a bar rather than a lopsided light distribution; see also Sevenster (1999).
The first models fitted to these data were parametric models assuming specific functional forms for the luminosity distribution of the barred bulge and disk and excluding low-latitude regions from the fit (Dwek et al. 1995, Freudenreich 1998). Non-parametric models were constructed by Binney, Gerhard & Spergel (1997), using a Lucy algorithm based on the assumption of strict triaxial symmetry, and by Bissantz & Gerhard (2002), using a penalized maximum likelihood algorithm. Both models are derived from the data as cleaned by Spergel, Malhotra & Blitz (1997), who used a fully three-dimensional model of the dust distribution based on the FIR emission data. The recent model by Bissantz & Gerhard includes a spiral arm model as a prior, maximizing simultaneously eightfold symmetry and smoothness of the luminosity distribution through corresponding penalty terms in the likelihood function. Figure 1 shows two sections through the model. In this model the bulge-to-disk ratio in NIR luminosity is about , similar to the value given by Kent, Dame & Fazio (1991). Other bar and disk properties from the COBE models are summarized below. Physical models for the COBE bar can be found for a range of bar orientation angles, , where measures the angle in the Galactic plane between the bar’s major axis at and the Sun-center line. must therefore be determined from other data; see also Zhao (2000).


The bar is also seen in starcount observations in inner Galaxy fields. Stanek et al. (1997) analyzed reddening-corrected apparent magnitude distributions of clump giant stars in 12 OGLE fields. The small intrinsic luminosity spread ( 0.2-0.3 mag) makes these stars good distance indicators. The peak of the distribution is brighter at where the line-of-sight passes through the near side of the bar. These fields cover only a small fraction of the sky, but fitting a parametric model constrains the bar orientation angle as well as the axis ratios and density profile. Nikolaev & Weinberg (1997) reanalyzed the IRAS variable population in a similar spirit; here the distance information comes from the known range of AGB star luminosities. NIR starcounts have also shown longitudinal asymmetries due to the bar (Unavane & Gilmore 1998). López-Corredoira et al. (1997, 2000) and Hammersley et al. (1999) have modelled the Two Micron Survey Starcounts (mostly bright K and M giants) in several strips across the bulge. Structural information on the bulge and disk can be derived from these data together with a model for the bright-star luminosity function. Ongoing work on deeper surveys (ISOGAL, DENIS, 2MASS) will provide important new information on the old stellar population in the inner Galaxy; first results are given by van Loon (2001) and Alard (2001), who has interpreted residuals in the 2MASS star counts from the main bar in terms of a secondary inner bar.
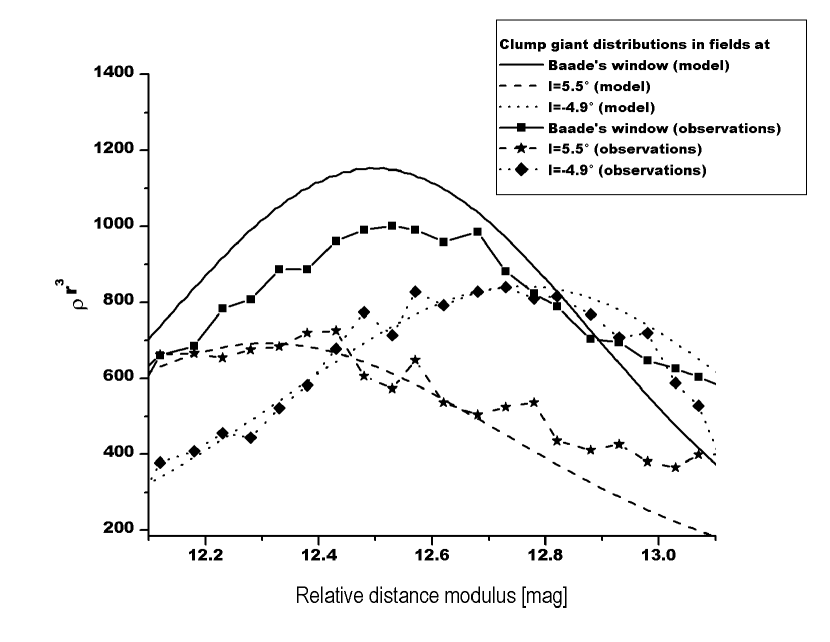
An important goal is to construct a model that simultaneously reproduces both the starcount and integrated light data. The Bissantz & Gerhard (2002) models represent a first step in this direction, having been constrained a posteriori by the clump giant apparent magnitude distributions from Stanek et al. (1997). As Figure 2 shows, their favoured model matches well the asymmetry of the peak positions in the fields near with respect to Baade’s window, and also the relative peak amplitudes within , showing that the line-of-sight distribution of luminosity in the bulge part is approximately correct.
Modelling the HI and CO () diagrams provides information on the gravitational potential of the bar and disk. Several recent gas flow models (see §3) have produced () diagrams with which many features seen in the observed () diagrams may be qualitatively understood, such as the 3 kpc arm, the non-circular velocities around the end of the bar, the cusped-orbit shock transition and inner -disk, the molecular ring and the spiral arm tangent locations, although no model as yet provides a satisfactory account quantitative account of the entire observed () diagrams.
The following subsections contain my best summary of the main bar and disk parameters from this and other work.
Bar orientation From the integrated light alone, physically reasonable models can be found for . Starcount models give values between (López-Corredoira et al. 2000) and (Nikoalev & Weinberg 1997, Stanek et al. 1997). The models of Bissantz & Gerhard (2002) for the DIRBE L-band data, when additionally constrained by the clump giant apparent magnitude distributions of Stanek et al. (1997), give an optimal , but is within the uncertainties. The gas-dynamical models and the orbit analysis of Binney et al. (1991) are also compatible with , depending on whether the emphasis is on the peak in the terminal velocity curve, the arm morphology, or the magnitude of the non-circular motions near the 3 kpc arm. Finally, microlensing observations favour (Zhao & Mao 1996). Thus a good working value is . Not consistent with this appear to be the bar model of Hammersley et al. (2000), which is based on the identification of a region of strong star formation at with the nearer end of the bar, and the star count results reported in van Loon (2001), which place the near end of a 1.4 kpc size bar at negative longitudes.
Bar length: Models based on the DIRBE NIR maps find the end of the bar around , when (Freudenreich 1998, Binney, Gerhard & Spergel 1997, Bissantz & Gerhard 2002). This is consistent with with the OH/IR stars (Sevenster 1999), IRAS variables (Nikolaev & Weinberg 1997), and the range of given below, for a fast bar, while other starcount models use exponential or Gaussian density distributions with shorter scale-lengths.
Bar axis ratios: The parametric DIRBE models give axial ratios of about 10:3-4:3. This is in agreement with the new non-parametric model of Bissantz & Gerhard (2002), whereas Binney, Gerhard & Spergel (1997) had found 10:6:4 without taking into account the foreground spiral arms. The starcount models give 10:4:3 (Stanek et al. 1997) and 10:5.4:3.3 (López-Corredoira et al. 2000). Thus there is good overall agreement at around 10:4:3.
Disk scale-length: In the integrated NIR the radial exponential disk scale is significantly shorter than in the optical; numerical values are around (Freudenreich 1998, Binney, Gerhard & Spergel 1997) or somewhat shorter (, Bissantz & Gerhard 2002). Hammersley et al. (1999) report satisfactory agreement of their NIR counts with a model with , but have not tested other values of . López-Corredoira et al. (2000) find that is too short to describe the NIR TMSS counts well. Earlier starcount models (Robin et al. 1992, Ortiz & Lépine 1993) favour a short disk scale, . It is not clear what causes the differences between the various starcount models, and between the TMSS starcounts and the integrated NIR light. There may be some interplay between the disk scale-length, the bulge profile, and the spiral arm luminosity distribution. To clarify this will need further work with spatially complete data.
3. Pattern speed
The pattern speed , or equivalently, the corotation radius , is the most important dynamical parameter of the bar, because it determines the orbits of stars in the disk. Bar pattern speeds can be parametrized by the ratio , where is the Lagrangian radius at which the gravitational and centrifugal forces cancel out, approximately equal to the axisymmetric corotation radius, and the bar’s semi-major axis length. The Milky Way bar is a fast bar (), as are the bars in external galaxies for which pattern speeds have been determined (see Debattista, Gerhard & Sevenster 2002 for a summary). Three methods have been used to estimate the pattern speed of the Galactic bar:
Hydrodynamical simulations: The gas-dynamical simulations of Englmaier & Gerhard (1999) and Fux (1999) agree in their interpretation of the 3 kpc arm as one of the lateral arms close to the bar, placing it inside corotation. Sevenster (1999) argues that the 3 kpc arm is part of an inner ring, which would also place it slightly inside the corotation radius . The main Galactic spiral arms outside , on the other hand, imply an upper limit for , but this is more model-dependent. These gas-dynamical models thus give a range of (see Gerhard 1999 where also a corresponding resonance diagram is shown). Weiner & Sellwood (1999) have concentrated in their models to reproduce the extreme (non-circular) velocity contour in the HI data of Liszt & Burton (1980), using gravitational potentials that include a Ferrers bar. They favour a somewhat lower value for , corresponding to , but also need a significantly larger bar angle than favoured by the results reported in §2. The recent SPH simulations of Bissantz, Englmaier & Gerhard (2002) based on the COBE bar potential of Bissantz & Gerhard (2002) find , corresponding to . The best of these models include a second, lower pattern speed for the Galactic spiral arms. These models give a very good representation of the () diagram in the region outside the bar, but still underpredict the non-circular velocities in the 3 kpc arm. However, both Bissantz et al. (2002) and Fux (1999) find that the amplitude of these non-circular velocities is influenced by additional parameters such as the details and time-dependence of the gravitational potential in the bar-spiral transition region, which are almost certainly not reliably modelled in the simulations.
Orbital resonances: Dehnen (2000) has interpreted features in the local stellar velocity distribution as due to the outer Lindblad resonance with the bar, resulting in for , near the upper end of the range from the gas-dynamical models, and corresponding to . While the match to the Hipparchos data appears convincing, this analysis relies on the assumption that the quadrupole moment of the bar is strong enough near the Sun to dominate the resonance, as compared to that of the spiral arms. In the new COBE models of Bissantz & Gerhard (2002) the more elongated bar as compared to previous models does dominate the quadrupole moment near the Sun, but there still is the caveat that we know little about the amplitude of the Galactic spiral arms in the old stellar component.
Direct method: Recently, Debattista et al. (2002) have adapted the Tremaine-Weinberg (1984) method to a sample of tracers in the Milky Way, and have used it to analyze the sample of OH/IR stars collected by Sevenster and collaborators (see Sevenster et al. 2001). For and and assuming inward LSR motion of as suggested by HI absorption observations (Radhakrishnan & Sarma 1980), they find for these sources with a possible additional systematic error of perhaps . The OH/IR stars which carry the main signal in the analysis are at low latitude and slightly outside the region of the bar, according to the models described in §2. Thus the feature responsible for the measured pattern speed most likely is the inner parts of the spiral arms, particularly the Scutum arm tangent. The high value of suggests that this spiral arm might be coupled to the bar; perhaps it is even an inner ring rather than a spiral arm. Such rings are common in barred galaxies (Buta 1995), and being elongated along the bar, corotate with the bars they contain. Sevenster & Kalnajs (2001) have postulated such a ring in the Milky Way. In either case, the pattern speed of the outer spiral arms could be lower, as favoured by the most recent hydrodynamic simulations and the independent work of Lépine et al. (2001) on Cepheid velocities.
Taking these results together, a good estimate for the corotation radius is . Recall from §2 that the major axis length of the COBE bar is approximately , so .
4. Microlensing
Microlensing observations provide important new constraints on the Galactic mass distribution. Several hundred microlensing events have been observed towards the Galactic bulge by the OGLE and MACHO collaborations. These observations give information about the integrated mass density towards the survey fields as well as about the lens mass distribution. The most robust observable is the total optical depth averaged over the observed fields, . Early measurements gave surprisingly high values (Udalski et al. 1994, Alcock et al. 1997), where . Alcock et al. (2000a) determined for all source types from 99 events centered on , using a difference image analysis (DIA) technique. From this measurement they deduced an optical depth for bulge sources only in the same field. Popowski et al. (2000) published a preliminary analysis of 52 clump giant sources in 77 Macho fields, resulting in a lower centered on . The important advantage of using clump giant sources is that they do not suffer from blending problems.
The measured optical depth values in these bulge fields are unexpectedly high. Axisymmetric Galactic models predict , insufficient to explain the quoted values (Kiraga & Paczynski 1994, Evans 1994). Models with a nearly end–on bar enhance because of the longer average line-of-sight from lens to source. The maximum effect occurs for when for (Zhao & Mao 1996). is also proportional to the mass of the bar/bulge and increases with the bar length.
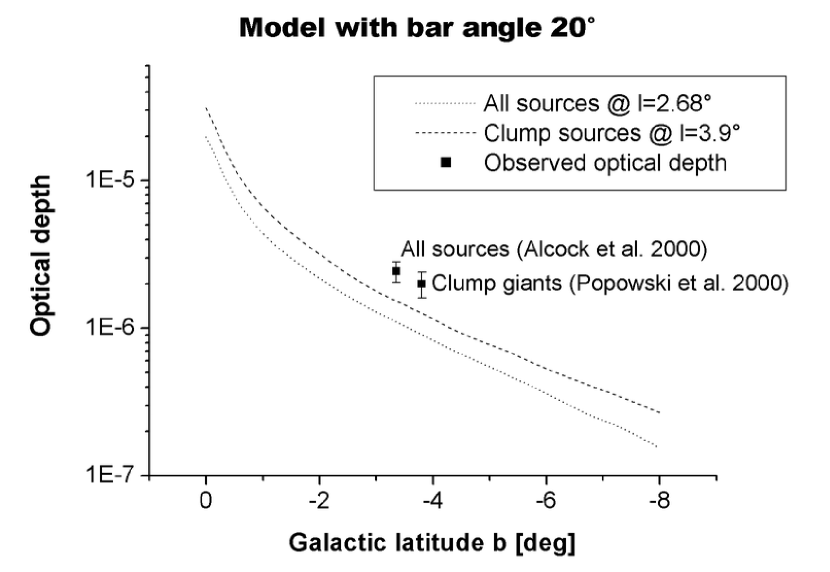
Nonetheless, models based on barred mass distributions derived from Milky Way observations typically give only (e.g., Zhao, Spergel & Rich 1995, Stanek et al. 1997, Bissantz et al. 1997), significantly less than most of the measured optical depths. Figure 3 shows predicted optical depths for the new COBE bar model of Bissantz & Gerhard (2002) as a function of latitude, at the central longitude positions of the newest microlensing measurements. The mass normalization of the disk and bulge in this model is calibrated by assuming constant L-band mass-to-light ratio and by matching the predicted gas flow velocities in a hydrodynamic simulation to the Galactic terminal velocity curve; see above. The numerical values are for all sources at the position of the DIA measurement and for clump giant sources at the centroid position given by Popowski et al. (2000).
The model prediction for clump giant sources is within of the Popowski et al. MACHO value. On the other hand, the recent DIA value is still some away from the model prediction. Because the apparent magnitude distributions for clump giant stars predicted by this model agree closely with those measured by Stanek et al. (1997) – see Fig. 2 – this model gives a good approximation to the distribution of microlensing sources. Changing the quoted optical depths substantially is therefore hard unless the mass distribution of the lenses differs substantially from that of the sources. While the NIR model prediction could be slightly increased if the mass-to-light ratio were not spatially constant, this is only a effect since limited by the terminal velocity curve (Bissantz et al. 1997).
General arguments (Binney, Bissantz & Gerhard 2000) show that an optical depth for bulge sources as large as that implied by the MACHO DIA measurement is very difficult to reconcile with the Galactic rotation curve and local mass density, even for a barred model and independent of whether mass follows light. To illustrate this, the extra optical depth required on top of the Bissantz & Gerhard (2002) model prediction would correspond to an additional mass surface density towards the bulge of some at the optimal location half-way to the bulge. This is comparable to the luminous surface mass density in the NIR model (some but not optimally located. Because the model predictions are fairly robust, it is important to check again whether the DIA measurement could still be significantly affected by blending.
These results have a further important implication. Because a model based on the maximal disk assumption and calibrated with the terminal velocities still underpredicts the observed bulge microlensing optical depths, the contribution of a non-lensing CDM dark halo to the mass distribution in the inner Galaxy cannot be large (from the LMC microlensing experiments of Alcock et al. 2000b at most a fraction of the dark matter halo can contribute to microlensing.) Thus the bulge microlensing results argue strongly for a massive disk and low central density halo (see also Binney & Evans 2001). This is consistent with the fact that the NIR disk with constant mass-to-light ratio fitted to the terminal velocity curve correctly predicts the local disk surface mass density, leaving little room for extra mass in the inner Galaxy (Gerhard 1999).
References
Alard C., 2001, A&A, 379, L44
Alcock C., et al. , 1997, ApJ, 479, 119
Alcock, C., et al. 2000a, ApJ, 541, 734
Alcock, C., et al. 2000b, ApJ, 542, 281
Binney, J.J., Bissantz N., Gerhard, O.E., 2000, ApJL, 537, L99
Binney, J.J., Evans, N.W., 2001, MNRAS, 327, L27
Binney, J.J., Gerhard, O.E., & Spergel, D.N. 1997, MNRAS, 288, 365
Binney J.J., Gerhard O.E., Stark A.A., Bally J., Uchida K.I., 1991, MNRAS, 252, 210
Bissantz, N., Englmaier, P., Binney, J.J., & Gerhard, O.E. 1997, MNRAS, 289, 651
Bissantz, N., Englmaier, P., Gerhard, O.E. 2002, MNRAS, submitted
Bissantz, N., Gerhard, O.E. 2002, MNRAS, in press
Blitz L., Spergel, D., 1991, ApJ, 379, 631
Buta R., 1995, ApJS, 96, 39
Cohen R.J., Few R.W., 1976, MNRAS, 176, 495
Debattista V.P., Gerhard O.E., Sevenster M.N., 2002, MNRAS, in press
Dehnen W., 2000, AJ, 119, 800
Dwek E., et al. , 1995, ApJ, 445, 716
Englmaier P., Gerhard O.E., 1999, MNRAS, 304, 512
Evans N.W., 1994, ApJL, 437, L31
Freudenreich H.T., 1998, ApJ, 492, 495
Fux R., 1999, A&A, 345, 787
Gerhard, O., 1999, in Galaxy Dynamics, ASP, 182, 307
Gerhard O.E., Vietri M., 1986, MNRAS, 223, 377
Han C., Gould A., 1995, ApJ, 449, 521
Hammersley P.L., Cohen M., Garzón F., et al., 1999, MNRAS, 308, 333
Hammersley P.L., Garzón F., Mahoney T.J., et al., 2000, MNRAS, 317, L45
Kent S.M., Dame T.M., Fazio G., 1991, ApJ, 378, 131
Kiraga M., Paczyński B., 1994, ApJ, 430, L101
Lépine J.R.D., Mishurov Y.N., Dedikov, S.Y., 2001, ApJ, 546, 234
Liszt H.S., Burton W.B., 1980, ApJ, 236, 779
López-Corredoira M., Garzón F., Hammersley P.L., et al., 1997, MNRAS, 292, L15
López-Corredoira M., Hammersley P.L., Garzón F., et al., 2000, MNRAS, 313, 392
Mulder W.A., Liem B.T., 1986, A&A, 157, 148
Nakada Y., Deguchi S., Hashimoto O., Izumiura H., Onaka T., Sekiguchi K., Yamamura I., 1991, Nat, 353, 140
Nikolaev S., Weinberg M.D., 1997, ApJ, 487, 885
Ortiz R., Lépine J.R.D., 1993, A&A, 279, 90
Peters W.L., 1975, ApJ, 195, 617
Popowski P., et al., 2000, ASP, in press, astro-ph 0005466
Radhakrishnan V., Sarma V.N.G., 1980, MNRAS, 85, 249
Robin A.C., Crézé M., Mohan V., 1992, A&A, 265, 32
Sevenster M.N., 1999, MNRAS, 310, 629
Sevenster M.N., Kalnajs, 2001, AJ, 122, 885
Sevenster M.N., van Langefelde H., Chapman J.M., Habing H.J., Killeen N.E.B., 2001, A&A, 366, 481
Spergel D.N., Malhotra S., Blitz L., 1996, in: Spiral Galaxies in the Near-IR, eds. D. Minniti, H.-W. Rix, Springer, Berlin, 128
Stanek K.Z., et al. 1997, ApJ, 477, 163
Tremaine S., Weinberg M.D., 1984, ApJ, 425, 81
Udalski A. et al. , 1994, Acta Astron., 44, 165
Unavane M., Gilmore G., 1998, MNRAS, 295, 145
van Loon J.T., 2001, AP&SS, 277, 313
Weiland J.L., et al. , 1994, ApJL, 425, L81
Weiner B., Sellwood J.A., 1999, ApJ, 524, 112
Zhao H.S., 2000, MNRAS, 316, 418
Zhao H.S., Mao S., 1996, MNRAS, 283, 1197
Zhao H.S., Spergel D.N., Rich R.M., 1995, ApJ, 440, L13