On the nature of X–ray Bright Optically Normal galaxies
Abstract
Multiwavelength observations of the hard X–ray selected sources by Chandra and XMM–Newton surveys have significantly improved our knowledge of the objects responsible of the hard X–ray background. A surprising finding is the discovery of a population of optically dull, X–ray bright galaxies emerging at 2–10 keV fluxes of the order of erg cm-2 s-1. We present preliminary results of multiwavelength observations of a few objects serendipitously discovered in the field of XMM–Newton and Chandra observations and intensively studied at longer wavelengths.
keywords:
Missions: XMM-Newton – Chandra, X–rays: Galaxies1 Introduction
Thanks to their revolutionary capabilities (arcsec imaging and high energy throughput) Chandra and XMM–Newton have opened up a new era in the study of the hard X–ray sky. Deep Chandra surveys (Brandt et al. 2001, Rosati et al. 2002) have reached extremely faint fluxes in the 0.5–2 keV and 2–7 keV bands virtually resolving the entire XRB flux at these energies; relatively deep XMM–Newton exposures (Hasinger et al. 2001, Baldi et al. 2002) have extended by a factor 50 the sensistivity in the 2–10 and 5–10 keV bands with respect to previous ASCA and BeppoSAX observations. Extensive programs of optical identifications showed extremely interesting and unexpected results. The most surprising finding is the discovery of a a sizeable number of relatively bright X–ray sources spectroscopically identified with early–type “normal” galaxies without any obvious signature of nuclear activity in the optical spectra (Fiore et al. 2000; Hornschemeier et al. 2001; Giacconi et al. 2001; Barger et al. 2001a,b). The large X–ray to optical flux ratio, which exceeds by more than one order of magnitude the average value of early–type galaxies of similar optical luminosity (Fabbiano, Kim, & Trinchieri 1992), and the hard X–ray spectra, determined from the analysis of X–ray colors, both suggest that (obscured) AGN activity is taking place in their nuclei. In principle X–ray spectroscopy could provide a stringent test on their nature. Unfortunately, all the sources are detected with a number of photons which is too small to apply conventional X–ray spectral fitting techniques and to constrain the absorbing column density. The lack of optical emission lines could be also explained if the nuclear light is overshined by either the stellar continuum or a non–thermal component, or if they are not efficiently produced. A much better understanding of the sources powering X–ray bright, optically quiet galaxies can be achieved only by means of multiwavelength observations.
The first detailed broad band (from radio to X–rays) study of what can be considered the archetypal of this class objects, the Chandra source CXOUJ 031238.9–765134 also known as P3 (Fiore et al. 2000) was recently completed by our group (Comastri et al. 2002). The overall energy distribution is consistent with that of a completely hidden possibly Compton thick ( 1.5 1024 cm-2) AGN (Fig. 1). If this is the case most of the observed X–ray emission would be due to a scattered/reprocessed nuclear component and a luminous ( 1044 erg s-1) AGN should be present at higher energies. It is plausible that a sizeable population of completely hidden AGN could be hosted by optically “normal” galaxies. Indeed there are claims of several of these sources in the literature (Mushotzky et al. 2000; Hornschemeier et al. 2001; Barger et al. 2001a,b) which seem to support previous findings based on ROSAT data (Griffiths et al. 1995). A better knowledge of their space density and luminosity distribution would be extremely important to trace the cosmological evolution of obscured accretion responsible of a large fraction of the hard X–ray background.
In order to investigate this issue we have collected multiwavelength data of a well defined sample of X–ray bright optically “normal” galaxies (hereinafter XBONG) selected in the hard (2 keV) X–ray band from Chandra and XMM–Newton observations. Here we present preliminary results obtained from the analysis of optical and radio observations.

2 The XBONG sample
As a starting point for the source selection we considered a subsample of the XMM High Energy Large Area Survey: HELLAS2XMM (Baldi et al. 2002) which, at present, consists of 495 sources detected in the hard 2–10 keV band down to a flux limit of 3 10-15 erg cm-2 s-1 in the field of view of 15 XMM–Newton public observations. Six of these fields, containing 147 sources, were selected for follow–up observations in the optical band using the ESO 3.6 m and the TNG 3.5 m telescopes. At the time of writing we have obtained deep R band images for all the objects in our sample and radio data at 6 cm for one out of the six fields. Spectroscopic identification are available for 71 sources (Fiore et al., 2002). Five of them are classified as XBONG on the basis of a relatively high X–ray luminosity ( erg s-1) and the lack of significant emission lines in their optical spectra.
In order to increase the number of objects we have also considered the sample of 69 hard X–ray (2–7 keV) selected sources compiled by Barger et al. (2001a,b) and based on Chandra observations of three different fields : Abell 370 (Bautz et al. 2000), SSA13 (Mushotzky et al. 2000) and the CDF–N (Hornschemeier et al. 2001). Extremely deep radio observations at 20 cm and multicolour optical imaging data are available for all the sources in this sample while a spectroscopic redshift has been obtained for 45 out of the 69 objects. The optical spectra have been classified by Barger et al. (2001a,b) into three general categories: (1) broad emission lines, (2) clear signs of high excitation emission lines and (3) no sign of any of the above signatures. There are 10, 15 and 20 sources respectively in each of the above mentioned categories.
In order to build an homogeneus and fairly well defined sample of XBONG we have carefully checked the published optical spectra and applied the same selection criterium adopted for the HELLAS2XMM sample. Only five out of the 20 galaxies classified by Barger et al. (2001a,b) in the third category do not show any evidence of line emission (with the exception of a weak H in a few cases).
The sample discussed in the present paper consists of 10 bona–fide XBONG. The hard X–ray and optical fluxes are reported in Table 1 along with the source redshift and 2–10 keV luminosity. Fluxes and luminosities for Chandra sources have been converted from the quoted 2–7 keV energy range assuming a power law spectrum with . R band magnitudes for the Chandra selected objects have been obtained from the published I band magnitudes assuming R–I colors consistent with the values of Fukugita et al. (1995).
| Source Name | z | R | B | log | |
|---|---|---|---|---|---|
| XMM0312#18 | 0.159 | 18.0 | 19.7 | 26.2 | 42.39 |
| XMM0312#17 | 0.320 | 17.7 | 19.4 | 28.2 | 43.16 |
| XMM0312#8 | 0.050 | 13.7 | 15.4 | 17.8 | 41.07 |
| XMM2690#13 | 0.154 | 17.5 | 19.2 | 16.3 | 42.28 |
| XMM0537#24 | 0.075 | 21.0 | 22.7 | 45.7 | 41.84 |
| CXOSSA13#4 | 0.212 | 20.0 | 22.5 | 15.1 | 42.28 |
| CXOSSA13#7 | 0.241 | 19.5 | 21.9 | 7.8 | 42.11 |
| CXOSSA13#18 | 0.110 | 16.6 | 18.9 | 3.9 | 41.08 |
| CXOSSA13#19 | 0.180 | 17.4 | 19.8 | 3.8 | 41.53 |
| CXOA370#10 | 0.360 | 19.3 | 21.9 | 7.4 | 42.41 |
The X–ray Hubble diagram for all the spectroscopically identified sources in the HELLAS2XMM and Chandra samples is reported in Fig. 2. For the purposes of the present paper all the sources with emission lines optical spectra (irrespective of their intensity and/or width) are reported with the same symbols and classified as Active Galaxies. The XBONG populate the low redshift, low luminosity end of the diagram. Indeed about 75% of the X–ray sources in the present sample with L 1043 erg s-1 and z 0.4 are XBONG.
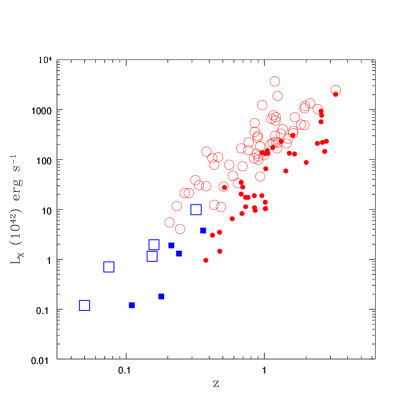
This result seems to suggest a sharp transition in the optical appearance of accreting sources at relatively low luminosities possibly related to a different mechanism powering the X–ray emission. Given that low luminosity objects are strongly biased against in flux limited surveys they might constitute an important fraction of the sources responsible of the background light.
3 X–ray and optical properties
Useful constraints on the nature of the XBONG source population can be obtained from the analysis of the already available optical and X–ray fluxes and from an estimate of their average X–ray spectral properties inferred from the hardness ratio analysis. The R band magnitudes plotted versus the 2–10 keV flux are reported in Fig. 3.
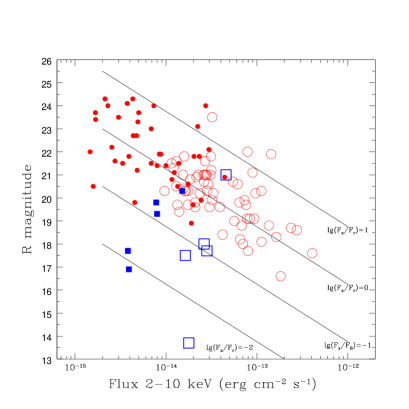
The so far identified AGN show a relatively well-defined correlation with the optical magnitude around 1. This correlation is similar to that found by ROSAT for soft X–ray selected quasars (Hasinger et al. 1998) and extended by Chandra (Alexander et al. 2002) and XMM–Newton observations (Lehmann et al. 2001) also for hard X–ray selected sources. The X–ray to optical flux ratio distribution of the galaxies in our sample is characterized by a larger dispersion and a lower average value than that of emission lines AGN suggesting that the optical light is dominated by the host galaxy as expected if an obscured nucleus is responsible for the observed X–ray emission. If this were the case, hard X–ray spectra due to strong low energy absorption are expected. The analysis of X–ray colours might give useful information in this respect. The H/S band ratio, where H and S correspond to the fluxes in the 2–10 keV and 0.5–2 keV energy ranges, has been computed for both the HELLAS2XMM and the Chandra samples and reported in Fig. 4 as a function of the hard X–ray flux.
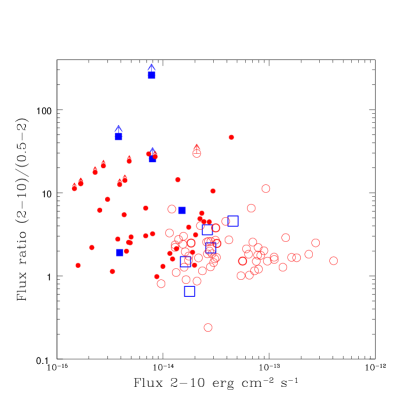
Although three of the faint Chandra XBONG not detected in the soft X–ray band are characterized by an extremely hard band ratio the X–ray spectrum of the brighter galaxies in the HELLAS2XMM sample is not particulary hard. A heavily buried Compton thick AGN may still be present if the observed X–ray emission is due to a scattered/reflected nuclear component (Comastri et al. 2002).
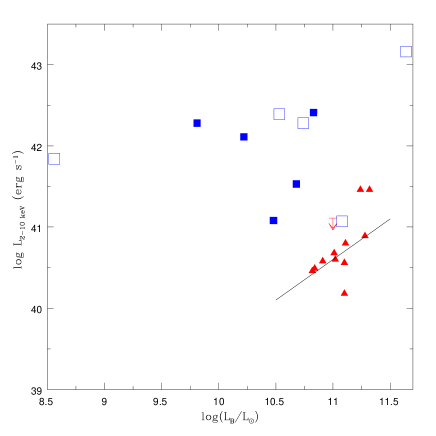
Figure 5 shows the relation between the 2–10 keV X–ray luminosity and the blue band luminosity (LB) compared with that obtained for a nearby sample of early–type galaxies observed with ASCA (Matsumoto et al. 1997). The ASCA 0.5–4.5 keV luminosities have been converted in the 2–10 keV band assuming a power law spectrum with = 1.8 (the average value of the hard component in the ASCA sample). The solid line represents the best fit relation between the blue and the hard X–ray luminosities for bulge–dominated spiral galaxies (Canizares et al. 1987). The hard X–ray luminosity of nearby early–type galaxies is proportional to the optical one and the relation is similar to that of spiral galaxies suggesting that high energy X–ray emission in both early–type and spiral galaxies is due to the integrated contribution of low mass X–ray binaries. These findings have been recently confirmed by high resolution Chandra observations (Loewenstein et al. 2001).
Although a few XBONG could be luminous examples of otherwise normal elliptical galaxies whose X–ray emission arise from the integrated contribution of stellar sources such a possibility is clearly inconsistent with the most luminous objects in our sample.
4 Radio and optical properties
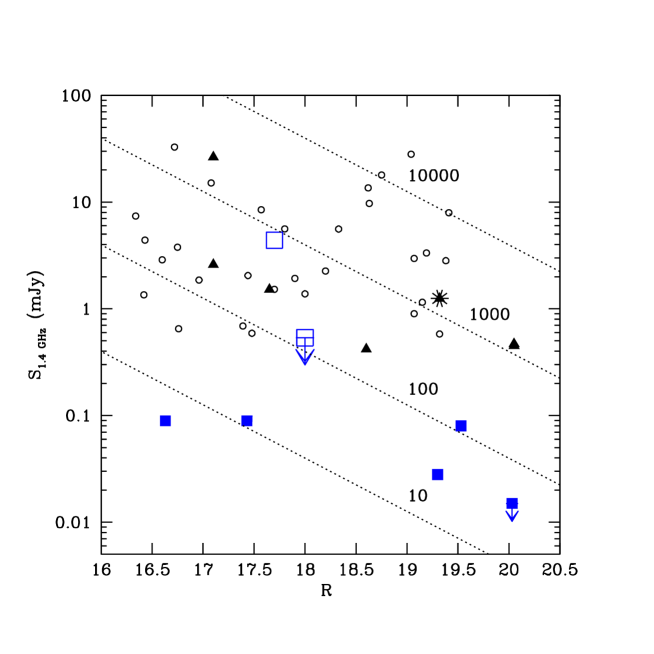
Deep radio observations at 1.4 GHz are available for all the 5 Chandra selected XBONG. Although all but one have been detected, their radio to optical flux ratios qualify these objects as radio quiet (Fig. 6). Only two of the five HELLAS2XMM XBONG have been observed at 5 GHz with the Australia Telescope Compact Array (Brusa et al. 2002). Interesting enough one object is a relatively bright (S5GHz = 1.3 mJy) radio source. The radio and broad band properties of the object which was not detected at 5 GHz (P3) have been extensively discussed elsewhere (Comastri et al. 2002).
In order to put the present observations on a broader context we have collected multiwavelength data for two samples of radio selected early–type galaxies from the ATESP survey (S 0.5 mJy; Prandoni et al. 2001) and the Marano field radio survey (S 0.2 mJy; Gruppioni, Mignoli & Zamorani 1999). All the objects in these radio selected samples are characterized by an almost featureless optical spectrum without emission lines and thus are very similar to the optical spectra of X–ray selected XBONG.
The presence of relatively bright radio sources hosted by optically normal galaxies has been pointed out already several years ago (Sadler, Jenkins, & Kotany 1989). As long as the radio properties are concerned these objects are classified as AGN, however the lack of an AGN signature in the optical band has never been fully understood.
The optical and radio properties of both the X–ray selected XBONG and the radio selected galaxies brighter than R 20 are reported in Fig. 6. There are no X–ray observations available for the ATESP galaxies while deep ROSAT PSPC observations are available for the Marano field (Zamorani et al. 1999). The X–ray selected galaxies are on average weaker in the radio band. We note that among the objects with an X–ray detection the two brightest radio sources (one from the HELLAS2XMM sample and the other one in the Marano field) have an optical to radio flux ratio typical of radio loud AGN.
5 Conclusions
The high X–ray luminosities and the relative ratios between X–ray, optical and radio fluxes strongly suggest that nuclear activity is going on in almost all the XBONG. The very nature of the mechanism responsible of the observed properties is still puzzling. Based on a detailed multiwavelength study of what can be considered the prototype of this class of objects (P3; Comastri et al. 2002) it has been concluded that an heavily obscured (possibly Compton thick) AGN is the most likely explanation. It is important to point out that such a possibility is not unique and alternative solutions could still be viable. Indeed the presence of an advection dominated accretion flow (ADAF) or a BL Lac object cannot be ruled out among the XBONG which are also relatively luminous at radio frequencies.
Whatever is the nature of the central engine powering the XBONG X–ray emission, a better knowledge of their luminosity and redshift distribution would have important consequences for the synthesis of the X–ray background and in turn for a better understanding of the evolution of accretion powered sources. In this context it is interesting to note that both Compton thick AGN (Fabian 1999; Wilman, Fabian & Nulsen 2001) and ADAF (Di Matteo & Allen 1999) have been proposed as an important class of contributors to the X–ray background.
Even though the bulk of the high energy background is produced by a mixture of type 1 and type 2 AGN as predicted by “standard” population synthesis models (Comastri et al. 2001; Gilli Salvati & Hasinger 2001), these models are far from being unique as they contain a number of naive assumptions concerning the source spectral properties and their cosmological evolution. The recent Chandra and XMM–Newton surveys have already suggested that some revisions are needed in order to explain the observed redshift distribution which peaks at much lower redshifts ( 1) than the model prediction (Hasinger 2002).
Our knowledge of the XBONG population is so far limited to the local Universe. If a significant fraction of unidentified hard X–ray sources discovered in deep surveys (Alexander et al. 2001) is made of high redshift XBONG (which at would be extremely faint in the otpical band), this could alleviate the discrepancy between the observed and the predicted redshift distribution.
Sensitive broad band observations of a larger sample of XBONG are clearly required to settle these issues.
Acknowledgements.
This research has been partially supported by ASI contracts I/R/103/00 and I/R/107/00, and by the MURST grant Cofin-00–02–36. CV also thanks the NASA LTSA grant NAG5–8107 for financial support. It is a pleasure to thank Roberto Gilli and Paolo Tozzi for many enlightening discussions.References
- [] Alexander, D.M., Brandt, W.N., Hornschemeier, A.E., Garmire, G.P., Schneider, D.P., Bauer, F.E., & Griffiths, R.E., 2001, AJ 122, 2156
- [] Alexander, D.M., Bauer, F.E., Brandt, W.N., Hornschemeier, A.E., Vignali, C., Garmire, G.P., & Schneider, D.P., 2002, these proceedings (astro–ph/0202044)
- [] Baldi, A., Molendi, S., Comastri, A., Fiore, F., Matt, G., & Vignali, C. 2002, ApJ 564, 190
- [] Barger, A.J., Cowie, L.L., Mushotzky, R.F., & Richards, E.A., 2001a, AJ 121, 662
- [] Barger, A.J., Cowie, L.L., Bautz, M.W., Brandt, W.N., Garmire, G.P., Hornschemeier, A.E., Ivison, R.J., & Owen, F.N. 2001b, AJ 122, 2177
- [] Bautz, M.W., Malm, M. R., Baganoff, F. K., Ricker, G. R., Canizares, C. R., Brandt, W. N., Hornschemeier, A. E., & Garmire, G. P., 2000, ApJ 543, L119
- [] Brandt, W.N., Alexander, D.M., Hornschemeier, A.E., et al. 2001, AJ 122, 2810
- [] Brusa, M., Comastri, A., Ciliegi, P., et al. 2002, in preparation
- [] Canizares, C.R., Fabbiano, G., & Trinchieri, G., 1987, ApJ 312, 503
- [] Comastri, A., Fiore, F., Vignali, C., Matt, G., Perola, G.C., & La Franca, F., 2001, MNRAS 327, 781
- [] Comastri, A., Mignoli, M., Ciliegi, P., et al., 2002, ApJ in press (astro–ph/0202080)
- [] Di Matteo, T., & Allen, S.W., 1999, ApJ 527, L21
- [] Fabbiano, G., Kim, D.W., & Trinchieri, G. 1992, ApJS 80, 531
- [] Fabian, A.C., 1999, MNRAS 308, L39
- [] Fiore, F., et al. 2000, New Astronomy 5, 143 (F00)
- [] Fiore, F., et al. 2002, in preparation
- [] Fukugita, M., Shimasaku, K., Ichikawa, T., 1995, PASP 107, 945
- [] Giacconi, R., et al. 2001, ApJ 551, 664
- [] Gilli, R., Salvati, M., & Hasinger, G., 2001, A&A 366, 407
- [] Griffiths, R.E., Georgantopoulos, I., Boyle, B.J., Stewart, G.C., Shanks, T., & Della Ceca, R., 1995, MNRAS 275, 77
- [] Gruppioni, C., Mignoli, M., & Zamorani, G., 1999, MNRAS 304, 199
- [] Hasinger, G., et al., 1998, A&A 329, 482
- [] Hasinger, G., et al., 2001, A&A 365, L45
- [] Hasinger, G., 2002, these proceedings (astro-ph/0202430)
- [] Hornschemeier, A., et al. 2001, ApJ 554, 742
- [] Loewenstein, M., Mushotzky, R.F., Angelini, L., Arnaud, K.A., & Quataert, E., 2001, ApJ 555, L21
- [] Matsumoto, H., Koyama, K., Awaki, H., Tsuru, T., Loewenstein, M., & Matsushita, K., 1997, ApJ 482, 133
- [] Mushotzky, R.F., Cowie, L.L., Barger, A.J., & Arnaud, K.A., 2000, Nature 404, 459
- [] Prandoni, I., Gregorini, L., Parma, P., de Ruiter, H.R., Vettolani, G., Zanichelli, A., Wieringa, M.H., & Ekers, R.D., 2001, A&A 369, 787
- [] Rosati, P., et al., 2002, ApJ 566, 667
- [] Sadler, E.M., Jenkins, C.R., & Kotanyi, C.G., 1989 MNRAS 240, 591
- [] Vignati, P., et al. 1999, A&A 349, L57
- [] Wilman, R.J., Fabian, A.C., & Nulsen, P.E.J., 2000, MNRAS 319, 583
- [] Zamorani, G., Mignoli, M., Hasinger, G., Burg, R., Giacconi, R., Schmidt, M., Trümper, J., Ciliegi, P., Gruppioni, C., Marano, B., 1999, A&A 346, 731