Chandra Imaging of the X-ray Core of the Virgo Cluster
Abstract
We report sub-arcsecond X-ray imaging spectroscopy of M87 and the core of the Virgo cluster with the Chandra X-ray Observatory. The X-ray morphology shows structure on arcsecond ( 100 pc) to ten arcminute ( 50 kpc) scales, the most prominent feature being an “arc” running from the east, across the central region of M87 and off to the southwest. A ridge in the radio map, ending in an “ear”-shaped structure, follows the arc to the east. Depressions in the X-ray surface brightness correspond to the inner radio lobes and there is no evidence of shock-heated gas surrounding them. There are also at least two approximately circular (centered near the nucleus) “edges” in the X-ray brightness distribution, the radii of which are slightly larger than the nuclear distances of the inner radio lobes and intermediate radio ridges, respectively. We speculate that these discontinuities may be spherical pulses or “fronts” driven by the same jet activity as is responsible for the radio structure; such pulses are found in recent numerical simulations. All these results provide good evidence that the nuclear activity affects the intra-cluster medium. We present a temperature map of the intra-cluster medium, and obtain the temperature, pressure and cooling time as a function of nuclear distance for the arcs and the ambient intra-cluster medium. We show that the gas in the arcs is cooler than, and probably over-pressured with respect to, the ambient intra-cluster medium. The metal abundances of the cooler gas in the arc are somewhat enhanced relative to the ambient intra-cluster medium, favoring a “buoyant plume” origin for the X-ray arc, in which ambient gas near the nucleus is entrained by buoyant radio plasma and carried to larger nuclear distances. The gas within the inner “front” (nuclear distance kpc ) is at least a two-temperature plasma, with the cool component at keV. This cool region is concentrated to the north of the nucleus and is strongly correlated with the H + [NII] emission-line distribution.
1 Introduction
The nearest X-ray emitting cluster of galaxies is the Virgo cluster in which the X-ray emission is seen to be sharply peaked towards the cluster center (Schreier, Gorenstein & Feigelson 1982). In the central few tens of kpc the temperature of the cluster gas decreases to keV (Canizares et al. 1979, 1982; Lea, Mushotzky & Holt 1982; Böhringer et al. 1994; Nulsen & Böhringer 1995; Böhringer et al. 2001; Belsole et al. 2001) and within 10 kpc the cooling time is 1 Gyr (Stewart et al. 1984), suggesting the presence of a 3 – yr-1 cooling flow (Lea et al. 1982; Canizares et al. 1982). Simple cooling flow models have some problems, however, such as the single temperature phase of the intra-cluster medium in Virgo (Böhringer et al. 2001), and the observed absence of X-ray emitting gas with temperature below 1 – 2 keV in other clusters (e.g. Schmidt, Allen & Fabian 2001; Peterson et al. 2001; Fabian et al. 2001; Tamura et al. 2001). The giant elliptical galaxy and powerful radio source M87 (Virgo A) lies at the core of the Virgo cluster. At radio wavelengths M87 is seen to power spectacular jets and lobes with significant structure extending over many tens of kpc (Owen, Eilek & Kassim 2000). Since M87 and the core of the Virgo cluster are nearby (15.9 Mpc [Tonry 1991]), they have a large angular size on the sky () and present an ideal system in which to study the nature of intra-cluster gas and its interaction with the radio source.
The interaction of the radio source with the cluster gas is thought to be important because, at the present epoch, the inferred, model-dependent, kinetic power in the jet is in the range erg s-1 (Bicknell & Begelman 1999), which may exceed the total X-ray luminosity of the cooling core ( erg s-1; Fabricant & Gorenstein, 1983). Observations with Einstein (Feigelson et al 1987) revealed an “arc” of X-ray emission that is well correlated with the intermediate scale (nuclear distance ) radio ridges, and subsequent ROSAT (Böhringer et al. 1995; Harris, Biretta & Junor 1999) and XMM-Newton (Belsole et al. 2001; Böhringer et al. 2001) observations find the gas in this arc to be cooler than surrounding cluster gas. Since the X-ray and radio features are quite well aligned, it is assumed there is some causal connection between them. Models which may account for this connection include those of Churazov et al. (2001), Brüggen & Kaiser (2001) and Reynolds, Heinz & Begelman (2002, hereafter RHB), in which buoyant bubbles of radio plasma interact with the intra-cluster medium. RHB also find that the transient activity of the radio galaxy sends spherical “pulses” into the intra-cluster medium.
We present here our first results on the cluster X-ray emission based on a 40 ks Chandra observation of M87 and the core of the Virgo cluster. The Galactic column density towards M87 is taken to be (Stark et al. 1992).
2 X-ray Observations
The core of the Virgo cluster was observed by Chandra on 2000 June 29 for 40 ks with M87 at the aim-point of the Advanced CCD Imaging Spectrometer (ACIS), on the S3 chip. After filtering for times of high background the total usable exposure time was 36608 s. The ACIS background was obtained from a compilation of relatively blank fields prepared by Maxim Markevitch111http://hea-www.harvard.edu/$^∼$maxim/axaf/acisbg, and subtracted from our images and spectra. The images were corrected for variations in the exposure time across the field caused by chip boundaries and telescope vignetting. CIAO 2.1.3 and CALDB 2.7 were used to extract the data and XSPEC 11.0.1 was used to model the spectra.
3 Morphology
At radio wavelengths M87 has a hierarchical morphology, with bright inner lobes at a nuclear distance kpc (), intermediate ridges at a nuclear distance kpc () and an outer diffuse “halo” at a nuclear distance kpc () (we shall refer to these as the “inner” lobes, “intermediate” ridges, and the outer halo, respectively). For reference, each ACIS chip is approximately , so we shall concentrate on the morphology on scales comparable to the inner and intermediate radio structures. Nevertheless, the S3 and S2 chips combined cover almost all of the region corresponding to the outer halo radio emission.
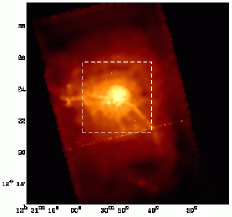
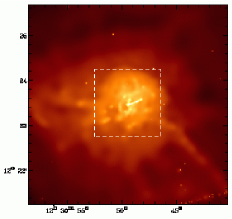
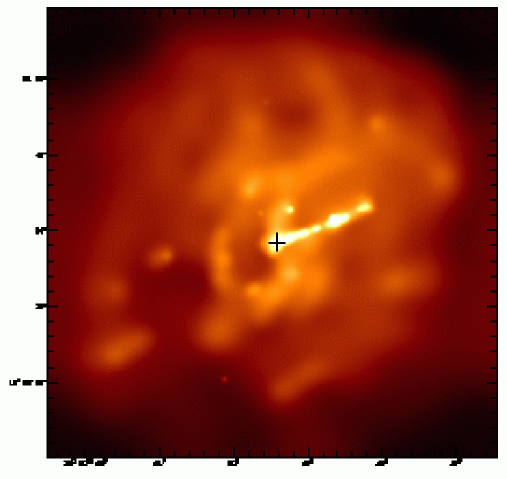
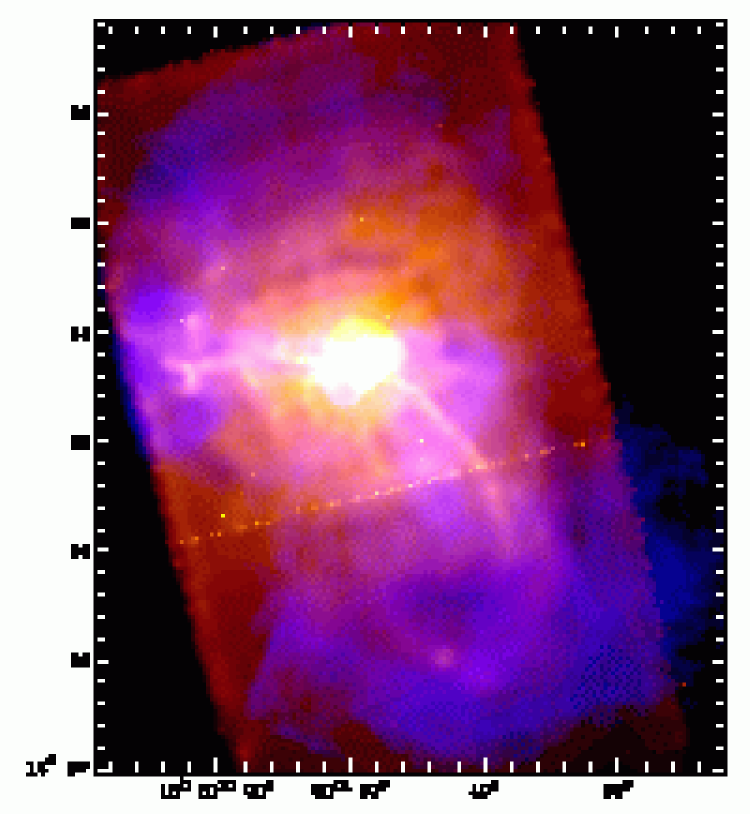
Adaptively smoothed 0.5 – 7 keV X-ray images of the core of the Virgo cluster are shown in Fig. 1 for three different spatial scales. There is considerable structure on all scales from arcsecond to tens of arcminutes. Concentrating on the central arcminute or so (bottom panel of Fig. 1), the brightest structure is the nucleus plus famous jet extending towards the northwest (Wilson & Yang 2002; Marshall et al. 2002). The X-ray surface brightness in the central arcminute is very clumpy and a number of point sources are visible. There are also major depressions in the X-ray emission; one to the west of the nucleus just beyond the jet, one immediately to the southeast of the nucleus, and another beyond that (i.e. 15 – from the nucleus) to the southeast and south.
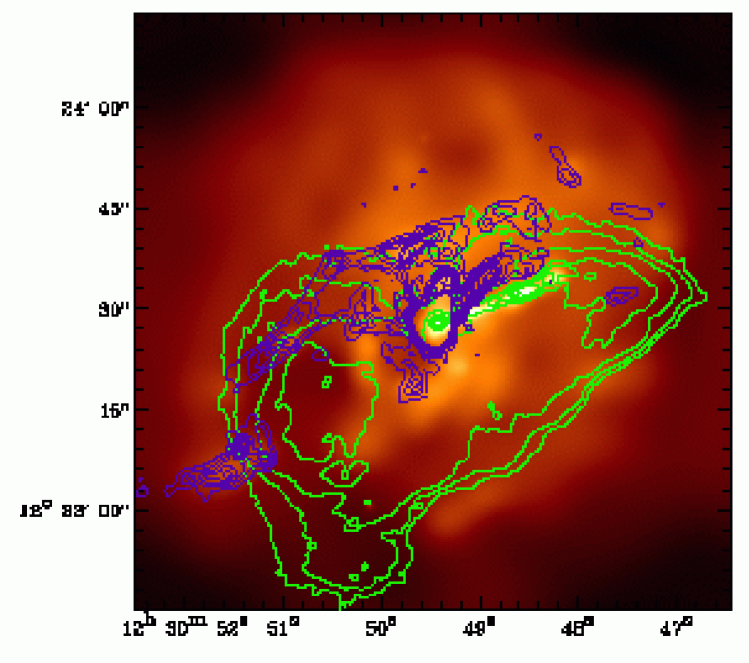
A morphological comparison between the X-ray, 6 cm radio (Hines, Eilek & Owen 1989) and H + [N II] , 6584 (Sparks, Ford & Kinney 1993) emission of the central is shown in Fig. 2. The radio and X-ray emissions from the jet are well correlated (Wilson & Yang 2002; Marshall et al. 2002). The two inner radio lobes, however, correspond to depressions in the X-ray surface brightness. Such a phenomenon has been seen in other clusters, such as Hydra A (McNamara et al. 2000) and Perseus (Fabian et al. 2000), although on much larger spatial scales. The H + [N II] emission line gas is also excluded from the inner radio lobes with the optical line-emitting gas predominantly on the north side of the radio structure (Sparks 1999). Some knots in the emission line and X-ray gas are associated with each other, especially on the northern and eastern boundaries of the inner eastern radio lobe.
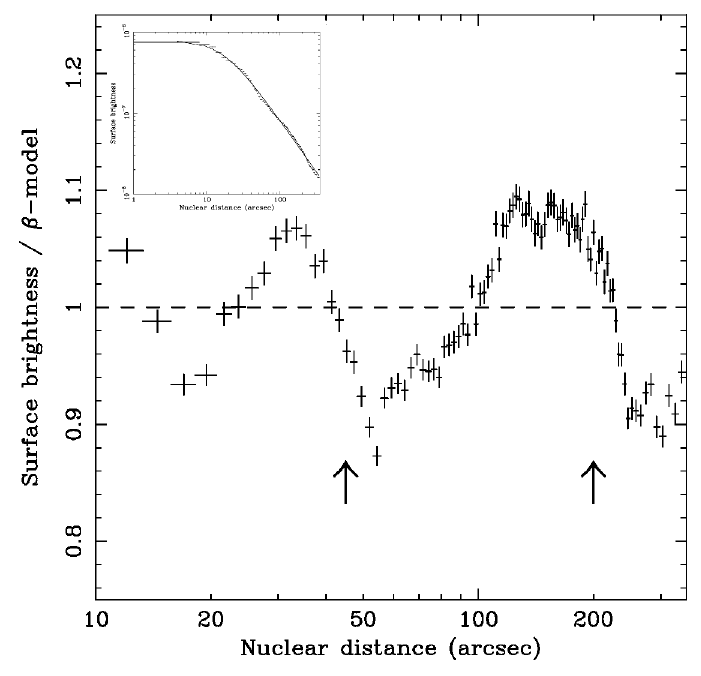
As can be seen in Fig. 1 the decline in X-ray surface brightness with increasing nuclear distance is not smooth. Instead, there are quite abrupt “edges” in brightness at nuclear distances of 45″ and 3′. These “edges” may also be seen in a plot of the azimuthally averaged surface brightness vs. nuclear distance shown in Fig. 3. It is notable that these two roughly circular features are just outside the inner radio lobe and at comparable nuclear distance to the intermediate radio ridges, respectively. This correspondence suggests the “edges” may have resulted from time variability in the active nucleus, perhaps being associated with past epochs of jet production. In the model of RHB, a short episode of jet activity eventually produces buoyant bubbles of radio plasma that rise at times the sound speed, along with a spherical “pulse” that expands at approximately the sound speed. We speculate that the two roughly circular “edges” may correspond to the spherical pulses associated with two earlier jet ejecta. While RHB discuss the results of their simulation in the context of powerful FR-II radio sources, both types of feature – the buoyant bubbles and the spherical pulse – are expected to be present in the late-time evolution of a lower power (FR-I) radio source, such as M87. This model is discussed further in Section 6.2.
The most striking feature on large scales is an X-ray “arc” running from 33 east of the nucleus, across the central region of M87, to 4 to the southwest (Figs 1 and 4). On the east side of the nucleus, the arc corresponds to a plume of radio emission (cf. Owen, Eilek & Kassim 2000), and ends at the center of the “ear”-shaped eastern lobe of radio emission. On the west side, the narrow arc passes to the south of the intermediate scale radio ridges 2′ – 3′ west of the nucleus. Further out, the arc follows diffuse filaments of radio emission that connect the intermediate scale radio ridges with the fainter, outer radio halo.
4 The Intra-Cluster Medium
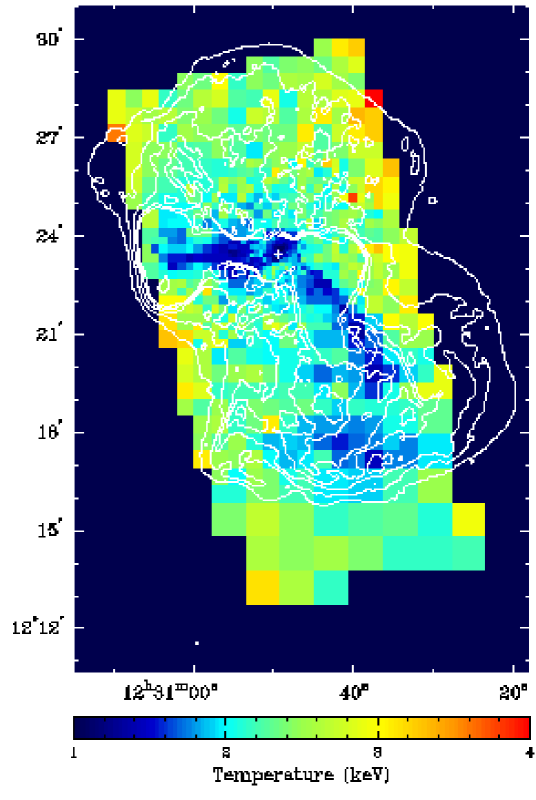
To get an idea of the spatial variation of the properties of the intra-cluster medium we first constructed an emission-weighted temperature map. To do this, images were made in soft (0.5 – 0.9 keV), medium (0.9 – 1.2 keV) and hard (1.2 – 4 keV) energy bands. The background subtracted data were then adaptively binned (Sanders & Fabian 2001) to ensure comparable fractional errors per bin in each band. Theoretical color ratio tables were computed as a function of temperature and metalicity using the mekal thermal plasma model in xspec, assuming absorption by only the Galactic column. The color ratios of the data were compared with these theoretically computed color ratios to construct a temperature map of the Virgo cluster (Fig. 5).
A few things are immediately apparent from the emission-weighted temperature map: (i) gas in the X-ray arc is cooler than surrounding intra-cluster gas at a similar nuclear distance, (ii) there is a region of cooler gas immediately surrounding the nucleus extending to the north and to the south, corresponding to the region of higher surface brightness around the nucleus (see Fig. 1), and (iii) there is no evidence of strong shock heating associated with the inner radio lobes.
Since a deprojection analysis was not performed, the temperature map shows the emission-weighted mean temperature in each bin. If the gas distribution is approximately spherically symmetric, with the density rapidly increasing inwards, the properties of the gas in a given bin are dominated by the properties of the gas at the same distance from the nucleus as the projected distance of the bin from the nucleus. The azimuthally averaged brightness profile of the inner part of the Virgo cluster is well described (i.e. to within at all nuclear distances; see Fig. 3) by an isothermal “-model” (Sarazin & Bahcall 1977) in which surface brightness with a core radius and , in good agreement with ROSAT HRI results (Böhringer 1999). Thus, the X-ray emission from the Virgo cluster is strongly peaked towards the center with the possible exception of the inner and the X-ray arcs, so the inferred temperatures are a reasonable approximation to the temperatures of gas at that physical distance from the nucleus.
Motivated by the temperature map (Fig. 5), spectra were extracted from a number of square regions, each containing counts, to compare, in detail, the gas properties in the arc and the ambient intra-cluster medium. An emission-weighted instrument response was made for each region, and the individual spectra were modeled by either (i) a single temperature VMEKAL thermal plasma model or (ii) a two temperature VMEKAL model if the additional component improved the /d.o.f. by . The abundances of O, Mg, Si, S and Fe were allowed to vary but, if a two temperature model was used, both components were constrained to have the same abundances.
The variation of temperature(s) with nuclear distance for different azimuthal angles is shown in Fig. 6. The arc to the east and southwest is much better described by a two temperature model, with temperatures of keV and keV. In contrast, the ambient gas is, in general, better described by a single temperature model with the temperature rising outwards from keV at 6 kpc to keV at kpc. The region within –9 kpc, corresponding approximately to the apparently cooler gas immediately surrounding the nucleus (see Fig. 5), is also better described by a two temperature model, with temperatures of keV and keV. The properties of the gas in the arc are clearly different from those in the surrounding cluster gas.
Focusing on the cooler region immediately surrounding the nucleus, we see that the coolest gas in the central arcminute is well correlated with optical H + [N II] , 6584 line emission, which is also concentrated to the north of the nucleus (Sparks et al. 1993; our Fig. 2). Moving farther out, there is another small filament of H + [N II] emitting gas located near the northwestern corner of the “ear” (Gavazzi et al. 2000). This filament corresponds to a region of increased X-ray surface brightness (Fig. 1, upper left) and cooler (Fig. 5) gas. The coincidence of the cooler X-ray gas with the H emitting gas suggests these may be regions in which mass is dropping out of the hot intra-cluster medium.
To study the pressure and cooling time in a given bin, the emission measure was converted to an electron density by assuming the path length through the bin is equal to the distance of that bin from the nucleus, an assumption supported by the rapid increase of X-ray surface brightness towards smaller nuclear distances (see above discussion). The electron density (and gas pressure) are , where is the path length through the gas so a factor of 2 error in the path length would correspond to only a factor of error in these quantities. To minimize the error in the assumed path length, we treated the arcs to east and southwest separately and assumed the path length through an arc is 1 kpc for those regions of the arc at a nuclear distance ( kpc). The cooling time was computed using the cooling function of Sarazin & White (1987) for solar metallicity gas, correcting for the printing error noted by Westbury & Henriksen (1992). The rate of cooling () of solar metallicity gas is faster than zero metallicity gas by factors of , 2 and 6 at temperatures of 10, 2 and 1 keV, respectively.
The electron density, total gas pressure and cooling time are shown in Fig. 7 as a function of nuclear distance for a number of different azimuthal angles. Away from the arc, the density and pressure decline rapidly with increasing nuclear distance while the cooling time rises. The properties of the gas away from the arc are similar to those previously derived for the cluster as a whole, with the run of temperature with nuclear distance being consistent with XMM-Newton (Böhringer et al. 2001) and the run of density with nuclear distance being consistent with ROSAT (Nulsen & Böhringer 1995). The gas in the arcs, however, is denser and probably over-pressured with respect to the surrounding cluster gas at a similar nuclear distance; a deprojection analysis of the ambient cluster emission would provide a more accurate estimate of the pressure of the ambient gas, but would be limited by the lack of symmetry of the X-ray emission. In addition, the density and pressure decline more slowly with increasing nuclear distance in the arc than in the surrounding cluster gas, although the slope of this decline is sensitive to the assumed path length through the gas in the arc.
5 Metal Abundances
A knowledge of the metal abundances of the cooler gas in the arc and the hotter surrounding cluster gas is important for differentiating between various theoretical models of the arc (see Section 6.3). To study the metal abundances to the east of the nucleus, counts were extracted from two square regions, one centered on the cooler gas east of the nucleus in the arc (which we refer to as the “arc” gas), and another over the nearby cluster gas north of that (which we refer to as the “ambient” gas). There are 8667 and 3323 cts in these two regions, respectively. In order to model the spectra, an emission-weighted mean instrument response was used. This procedure does not provide a perfect description of the instrument response, with residuals corresponding to the iridium M-edge (1.8 – 2.2 keV, as noted by Markevitch and Vikhlinin [2001]), and at energies corresponding to uncertainties in ACIS gain maps (1.6 and 2.6 keV222ACIS calibration issue dated 3 Jan 2002 at http://asc.harvard.edu/cal/Links/Acis/acis/Cal_projects/index.html), the effect of which is to increase both the values of our fits and the uncertainty in our determination of the Si and S abundances that have strong emission lines in these energy ranges. The ambient gas to the northeast of the nucleus may be described by a single temperature thermal plasma model (the VMEKAL model in XSPEC) in which the abundances of O, Mg, Si, S and Fe are allowed to vary, with /d.o.f. = 134/110. The parameters of this model are given in Table 1 and the data and model are shown in the left panel of Fig. 8. The spectrum of the arc to the east of the nucleus is more complicated, and is poorly described by a single temperature thermal plasma model, which has a /d.o.f. = 254/136. The arc can be described by a two temperature thermal plasma model, with temperatures of 1.77 keV and 1.07 keV. There is a degeneracy between the relative normalizations and metalicities of the two components, and this can be broken by assuming the warmer component has the same parameters as the ambient gas. The cooler component is then found to have enhanced Mg, Si, S and Fe abundances relative to the ambient gas and comparable O abundance. The model parameters are given in Table 1 and the model fit shown in the right panel of Fig. 8 with a /d.o.f. = 188/136.
To the west of the nucleus, counts were extracted from six square regions, three centered on the cooler gas in the arc southwest of the nucleus, and three over the nearby cluster gas a similar distance west of the nucleus. There are 18065 and 10815 cts in the three regions over the arc and the three regions over the ambient gas, respectively. These extraction regions are larger than those used to the east of the nucleus because we found that a greater S/N ratio was required to discern variations in the metal abundances. The spectra of the arc and the nearby cluster gas were then analyzed in the same way as the spectra from the regions east of the nucleus. The ambient gas to the west of the nucleus can be described by a single temperature thermal plasma model (see Table 1) with /d.o.f. = 440/362. The spectrum of the arc to the southwest of the nucleus is not well described by a single temperature plasma model (/d.o.f. = 683/396). The arc can be described by a two temperature thermal plasma model, with temperatures of 2.09 keV and 1.08 keV. If the warmer component has the same parameters as the ambient gas, the cooler component is found to have enhanced Mg and Si abundances than the ambient gas, comparable O and Fe, and comparable or lower S abundance. The model parameters are given in Table 1 with a /d.o.f. = 557/395.
To summarize, the physical properties of the gas in the X-ray arc are significantly different to those of the ambient cluster gas, in particular an additional cooler thermal component is present. The metal abundances of some of the heavy elements in the cooler gas in the arc, both to the east and west, are consistent with being enhanced relative to those of the ambient gas. Our conclusions are in broad agreement with the XMM-Newton observations of M87 (Belsole et al. 2001).
6 Discussion
6.1 An Estimate of the Minimum Power of the Jet
If we assume the “holes” in the X-ray gas that correspond to the inner radio lobes (see Fig. 2) are cavities created by the radio jet then we can make a crude estimate of the minimum power of the jet. The cavities are approximately spherical with typical diameters 1.5 kpc and volumes cm3, and the pressure in the regions around the cavities is 2 10-9 dyn cm-2. An estimate of the age of a cavity can be obtained from the free-fall timescale, where is the radius of the cavity, cm, and is the sound speed, cm s-1. Assuming the gas temperature keV gives a jet power erg s-1. If the cavities are evacuated faster than , then would be higher, although there appear to be no signs of sharp edges in the X-ray image that might be shocks. Our estimate of is at the lower end of previous estimates (e.g. Bicknell & Begelman [1999] find erg s-1), although there are inevitably uncertainties in our estimates of and other quantities. The cavity cannot be inflated much more slowly than the above estimate or it would have risen too far from the nucleus through buoyancy effects. The bubbles are expected to rise at (Churazov et al. 2001), and cannot have traveled more than 2 kpc giving a maximum age of and erg s-1.
6.2 The X-ray “Fronts”
The structure in the radial distribution of X-ray surface brightness (see Figs 1 – 4) could be some effect inherent to a cooling flow. However, we have noted (Section 3) that the two most noticeable sharp declines in azimuthally averaged X-ray surface brightness are just outside the inner radio lobes and at comparable nuclear distance to the intermediate radio ridges. This similarity between the nuclear distances of the radio lobes and the declines in surface brightness suggests instead that the “edges” may be “fronts” in the cluster atmosphere created by earlier ejecta from the active nucleus of M87.
We consider a scenario based on the results of numerical hydrodynamical simulations by RHB of the effects of the jets on the intra-cluster medium. RHB discuss their simulation results in the context of powerful FR-II radio galaxies but the end results are expected to be similar in a weaker FR-I radio galaxy. The end effect of the transient jet activity is that the cluster expands in response to heating of the cluster core. An approximately spherical pulse propagates outwards at the sound speed (see Fig. 6 of RHB), ultimately leaving the core of the cluster at a fractionally lower density and a higher temperature. The amplitude of the density wave in the RHB simulation is which is dependent upon the initial conditions but is large enough to produce the fluctuations seen in the azimuthally averaged X-ray surface brightness when compared to the best fitting “-model” shown in Fig. 3. The fact that the two fronts are at slightly larger nuclear distances than the inner radio lobes and the intermediate ridges suggests that each of these radio features is in the “passive” or buoyant bubble phase that characterizes the late stage of evolution. Such would be consistent with the absence of strong shocks around the cavities inflated by the inner radio lobes. The (12 kpc) separation of successive fronts corresponds to a sound crossing time of yrs, and indicates there may be relatively brief periods of jet activity every yrs or so. If this is the case, the time-averaged energy injected into the cluster by the jet may be significantly lower than the present instantaneous power of the jet. Further detailed numerical simulations, tailored to the environment of M87, are required to determine whether such a model can indeed reproduce the “fronts” and what conditions are needed. In particular, such simulations are required to find out what effect the putative pulse has on the cluster core. The model of RHB also predicts subtle (tens of per cent) changes in the gas temperature associated with the changes in X-ray surface brightness, and while these changes are too small to be detected in our data set, one could look for them in a future observation with a significantly longer integration time.
6.3 The X-ray Arcs
Our observations of the X-ray arcs to the east and southwest and associated with the radio ridges show that they are narrow, with a FWHM of only (1 kpc). The length to width ratio of the southwestern arc is . We have also found (Section 4) that the gas in the arcs is cooler than the surrounding cluster gas, in agreement with previous studies, and appears to contain two components with different temperatures. The cooler component may have some metal abundances enhanced with respect to the warmer gas in the cluster (Table 1, Section 5).
A number of models have been proposed to explain these arcs. Firstly, it should be noted that although the X-ray emissivity of the gas may be enhanced by compression, shocks or cosmic ray heating processes tend to raise the gas temperature rather than lower it, and can be ruled out (Böhringer et al. 1995). Another possibility is that, as the radio ejecta (which are likely to be in the late “buoyant plume” phase [RHB]; cf. Section 6.2) pass through a multi-phase cooling flow, they disrupt the “cold” phase (consisting of cold, denser clouds) and mix it with the “hot” phase. This causes a rapid cooling of the hot phase and an enhancement of the density (Böhringer et al. 1995). However, whether the ambient intra-cluster medium is, in fact, multi-phase remains controversial (we are able to adequately describe most of the intra-cluster gas as a single temperature plasma). A further possibility is that cooler, low entropy gas near the nucleus is mixed into the radio plasma, generating buoyant bubbles of gas (Churazov et al. 2001; Brüggen et al. 2002; RHB). These bubbles would rise in the cluster gravitational field and expand until they have a density equal to that of the surrounding medium.
The in-situ disruption of gas in a cold phase, followed by mixing, should leave cooler gas with metal abundances comparable to the surrounding cluster gas. On the other hand, if the cool gas was entrained at a small nuclear distance and carried outwards, the buoyant bubbles of cold gas should have metal abundances appropriate to the cluster core. As discussed above (Section 5), we find that the cooler gas (see Table 1) in the arc probably has a higher metalicity for at least some elements than the ambient gas. These higher abundances favor the buoyant bubble scenario. The morphology of the X-ray arcs (i.e. narrow and well collimated) is consistent with the Churazov et al. (2001) and RHB models in which a narrow column of dense gas is created. The numerical simulations of both Churazov et al. (2001) and RHB assumed axi-symmetry which may artificially stabilize narrow structures elongated along the symmetry axis, although reasonably narrow, dense structures with an aspect ratio of are also produced in the fully 3D simulations of Brüggen et al. (2002). The sound-crossing time from the nucleus to a nuclear distance of is a yrs, which is shorter than the cooling time of gas in the arcs, which is yrs and closer to yrs at a nuclear distance of (see Fig. 7). This means that there is time for cool gas entrained by a buoyant bubble in the nucleus to be carried to the end of the arc before it has cooled completely. If this were not the case, i.e. if the cooling time of gas in the arcs was shorter than the sound-crossing time, then some in-situ heating mechanism would be required, or the cool gas must have been transported faster than the sound speed. The simulation by RHB produces both elongated, buoyant plumes which lift gas from the center of the cluster and approximately spherical pulses traveling at the sound speed that we have identified with the X-ray “fronts”. In this sense, the structure of the intra-cluster medium in the inner part of the Virgo cluster conforms qualitatively to the expected effects of repeated injections of energy over a period of 108 yrs by radio jets from the nucleus of Virgo A.
7 Conclusions
We have presented the highest resolution X-ray image to date of the core of the Virgo cluster. Structure is observed on all spatial scales, from arcsecond ( pc) to ten arcminutes ( kpc).
The inner radio lobes are aligned with depressions in the X-ray surface brightness and there is no evidence of shock heating in the X-ray emission immediately surrounding the inner radio lobes, suggesting that the radio plasma has gently pushed aside the X-ray emitting gas. These cavities cannot have been inflated much slower than the sound speed, however, or they would have risen too far from the nucleus due to buoyancy effects. We estimate the jet power to be erg s-1.
On larger scales the most striking feature is the X-ray arc running from the east, across the central regions of M87, and off to the southwest. The gas in the arc has at least two temperatures, with one component at the temperature of the ambient intra-cluster medium and a cooler component at keV. The gas in the arcs is probably over-pressured with respect to, and somewhat more metal rich than, the ambient intra-cluster medium.
Abrupt changes in surface brightness or “fronts” are seen at nuclear distances slightly larger than the nuclear distances of the inner radio lobes and intermediate radio ridges. Within the inner front, at nuclear distances ( kpc) the gas has at least two temperatures, with the cooler component at keV, similar to the X-ray arc. This cooler region is concentrated more to the north than the south of the nucleus and is correlated with the H + [NII] emission-line distribution.
We suggest that a model based on the hydrodynamical simulations of RHB, scaled to a lower power radio source such as M87, may explain the observed phenomena. Intermittent jet activity has two effects on the cluster. Firstly, it inflates buoyant bubbles of radio plasma that trail cold gas from the central regions in their wakes as they rise at – 0.7 times the sound speed, thereby producing the X-ray arcs. The gas dredged up from the nucleus is expected to have higher metal abundances than the intra-cluster medium at large nuclear distances. Secondly, at late times in the evolution of the radio source, the injection of energy into the cluster core produces a “pulse” that expands at the sound speed into the intra-cluster medium as the cluster adjusts to find a new equilibrium. We identify this pulse with the observed X-ray “fronts”. Detailed numerical simulations tailored to the Virgo cluster are required to explore this hypothesis.
References
- (1) Belsole, E., et al. 2001, A&A, 365, L188
- (2) Bicknell, G. V. & Begelman, M. C. 1999, in The Radio Galaxy Messier 87, ed. Röser, H.-J., & Meisenheimer, K. (Berlin: Springer), p. 235
- (3) Binney, J. 1999, in The Radio Galaxy Messier 87, ed. Röser, H.-J., & Meisenheimer, K. (Berlin: Springer), p. 116
- (4) Böhringer, H. 1999, in The Radio Galaxy Messier 87, ed. Röser, H.-J., & Meisenheimer, K. (Berlin: Springer), p. 83
- (5) Böhringer, H., et al. 2001, A&A, 365, L181
- (6) Böhringer, H., Briel, U. G., Schwarz, R. A., Voges, W., Hartner, G. & Trümper, J. 1994, Nature, 368, 828
- (7) Böhringer, H., Nulsen, P. E. J., Braun, R., & Fabian, A. C. 1995, MNRAS, 274, L67
- (8) Brüggen, M. & Kaiser, C. R. 2001, MNRAS, 325, 676
- (9) Brüggen, M., Kaiser, C. R., Churazov, E., & Enßlin, T. A. 2002, MNRAS, 331, 545
- (10) Canizares, C. R., Clark, G. W., Jernigan, J. G., & Markert, T. H. 1982, ApJ, 262, 33
- (11) Canizares, C. R., Clark, G. W., Markert, T. H., Berg, C., Smedira, M., Bardas, D., Schnopper, H., & Kalata, K. 1979, ApJ, 234, L33
- (12) Churazov, E., Brüggen, M., Kaiser, C. R., Böhringer, H., & Forman, W. 2001, ApJ, 554, 261
- (13) Eilek, J. 1999, in The Radio Galaxy Messier 87, ed. Röser, H.-J., & Meisenheimer, K. (Berlin: Springer), p. 77
- (14) Fabian, A. C., et al. 2000, MNRAS, 318, L65
- (15) Fabian, A. C., Sanders, J. S., Ettori, S., Taylor, G. B., Allen, S. W., Crawford, C. S., Iwasawa, K., & Johnstone, R. M. 2001, MNRAS, 321, L33
- (16) Fabricant, D. & Gorenstein P. 1983, ApJ, 267, 535
- (17) Feigelson, E. D., Wood, P. A. D., Schreier, E. J., Harris, D. E., & Reid, M. J. 1987, ApJ, 312, 101
- (18) Gavazzi, G., Boselli, A., Vílchez, J. M., Iglesias-Paramo, J., & Bonfanti, C. 2000, A&A, 361, 1
- (19) Harris, D. E., Biretta, J. A., & Junor, W. 1999, in The Radio Galaxy Messier 87, ed. Röser, H.-J., & Meisenheimer, K. (Berlin: Springer), p. 100
- (20) Hines, D. C., Eilek, J. A., & Owen, F. N. 1989, ApJ, 347
- (21) Lea, S. M., Mushotzky, R. & Holt, S. S. 1982, ApJ, 262, 24
- (22) Marshall, H. L., Miller, B. P., Davis, D. S., Perlman, E. S., Wise, M., Canizares, C. R., & Harris, D. E. 2002, ApJ, 564, 683
- (23) McNamara, B. R., et al. 2000, ApJ, 534, L135
- (24) Nulsen, P. E. J., & Böhringer, H. 1995, MNRAS, 274, 1093
- (25) Owen, F. N., Eilek, J. A., & Kassim, N. E. 2000, ApJ, 543, 611
- (26) Peterson, J. A., et al. 2001, A&A, 365, 104
- (27) Reynolds, C. S., Heinz, S., & Begelman, M. C. 2002, MNRAS, 332, 271
- (28) Rybicki, G. B., & Lightman, A. P. 1979, Radiative Processes in Astrophysics (New York: Wiley)
- (29) Sanders, J. S., & Fabian, A. C. 2001, MNRAS, 325, 178
- (30) Sarazin, C. L., & Bahcall, J. N. 1977, ApJS, 34, 451
- (31) Sarazin, C. L., & White, R. E. 1987, ApJ, 320, 32
- (32) Schmidt, R., Allen, S. W., Fabian, A. C. 2001, MNRAS, 327, 1057
- (33) Schreier, E. J., Gorenstein, P., & Feigelson, E. D. 1982, ApJ, 261, 42
- (34) Sparks, W. B. 1999, in The Radio Galaxy Messier 87, ed. Röser, H.-J., & Meisenheimer, K. (Berlin: Springer), p. 142
- (35) Sparks, W. B., Ford, H. C., & Kinney, A. L. 1993, ApJ, 413, 531
- (36) Stark, A. A., Gammie, C. F., Wilson, R. W., Bally, J., Linke, R. A., Heiles, C. & Hurwitz, M. 1992, ApJS, 79, 77
- (37) Stewart, G. C., Canizares, C. R., Fabian, A. C., & Nulsen, P. E. J. 1984, ApJ, 278, 536
- (38) Tamura, T., et al. 2001, A&A, 365, L87
- (39) Tonry, J. L. 1991, ApJ, 373, L1
- (40) Westbury, C. F., & Henriksen, R. N. 1992, ApJ, 388, 64
- (41) Wilson, A. S., & Yang, Y. 2002, ApJ, 568, 133
| Parameter | Northeast (ambient) | East (arc) | West (ambient) | Southwest (arc) |
|---|---|---|---|---|
| = Northeast (ambient) + | = West (ambient) + | |||
| Counts | 3323 | 5344 | 10815 | 7250 |
| ( cm-2) | ||||
| (keV) | ||||
| O | ||||
| Mg | ||||
| Si | ||||
| S | ||||
| Fe | ||||
| Kaavmekal normalization where is the angular size distance (cm), is the electron density (cm-3) and is the hydrogen density (cm-3). | ||||
| /d.o.f. | 134/110 | 188/136 | 440/362 | 557/395 |