Emission Line Ratios and Variations in Temperature and Ionization State in the Diffuse Ionized Gas of Five Edge–on Galaxies
Abstract
We present spectroscopic observations of ionized gas in the disk–halo regions of five edge–on galaxies, covering a wavelength range from [O II] 3727Å to [S II] 6716.4Å. The inclusion of the [O II] emission provides additional constraints on the properties of the diffuse ionized gas (DIG), in particular, the origin of the observed spatial variations in the line intensity ratios. We have derived electron temperatures, ionization fractions and abundances along the slit. Our data include both slit positions parallel and perpendicular to the galactic disks. This allowed us to examine variations in the line intensity ratios with height above the midplane as well as distance from the galactic centers. The observed increase in the [O II]/H line ratio towards the halo seems to require an increase in electron temperature caused by a non–ionizing heating mechanism. We conclude that gradients in the electron temperature can play a significant role in the observed variations in the optical emission line ratios from extraplanar DIG.
1 INTRODUCTION
Extraplanar diffuse ionized gas (eDIG) has been observed in many galaxies in addition to the Milky Way (catalog ) over the past ten years. However, the origin of this gas, and how it is heated and ionized up to several kiloparsecs away from hot OB stars in the midplane of the galaxies is still not well understood. Many attempts have been made to explain the eDIG by pure photoionization models (e.g. Domgörgen & Mathis 1994) or combinations of photoionization and at least one additional ionization process (e.g. Martin 1997; Collins & Rand 2001). This additional process was needed to explain the rise in the [O III]/H line ratio with increasing distance from the disk. However, even with these composite models it was not possible to explain the constant [S II]/[N II] line ratio, which was observed in NGC 891 (catalog ) (Rand, 1998), as well as in the Milky Way (catalog ) (Haffner, Reynolds, & Tufte 1999) and other galaxies (Otte & Dettmar, 1999). These data led Haffner et al. (1999) to the conclusion that the electron temperature increases with increasing distance from the midplane of the galaxies. Such a variation in temperature would seem to require the existence of an additional, non–ionizing heating process within the DIG (Reynolds, Haffner, & Tufte 1999).
A rise in temperature can explain both the growing [O III]/H ratio as well as the constant [S II]/[N II] ratio with increasing galactic altitude without invoking an additional ionization mechanism at high . Such a rise in electron temperature also would affect the [O II]/H line ratio, and because of its relatively high excitation energy, the [O II] 3727Å emission line provides important additional information about the ionization and heating processes in the DIG. In an earlier study, we measured line intensity ratios, including the [O II] emission line, as a function of height above the midplane in three edge–on galaxies, using three different analysis methods (Otte et al. 2001, hereafter Paper I). Paper I shows that intensity ratios of the brighter optical emission lines from the eDIG can be understood, if the electron temperature tends to increase with height above the galactic midplane. In this paper, we examine the same galaxies, but at slit positions parallel to the midplane, and two additional galaxies, using the method that yielded the most reasonable results in Paper I. The new results confirm our previous conclusion, in which case photoionization would not be the sole energy source for the eDIG.
2 OBSERVATIONS AND DATA REDUCTION
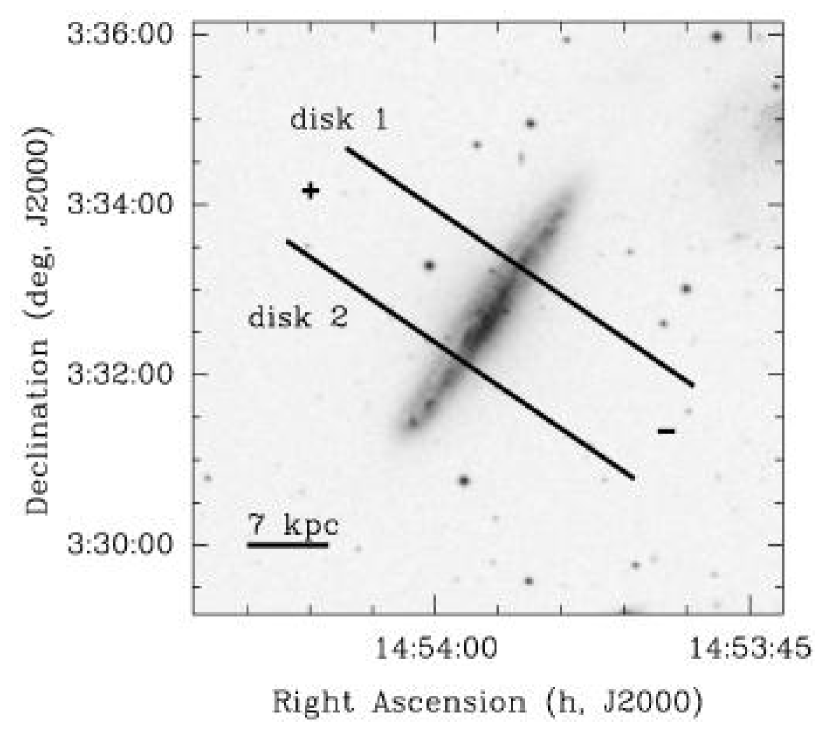
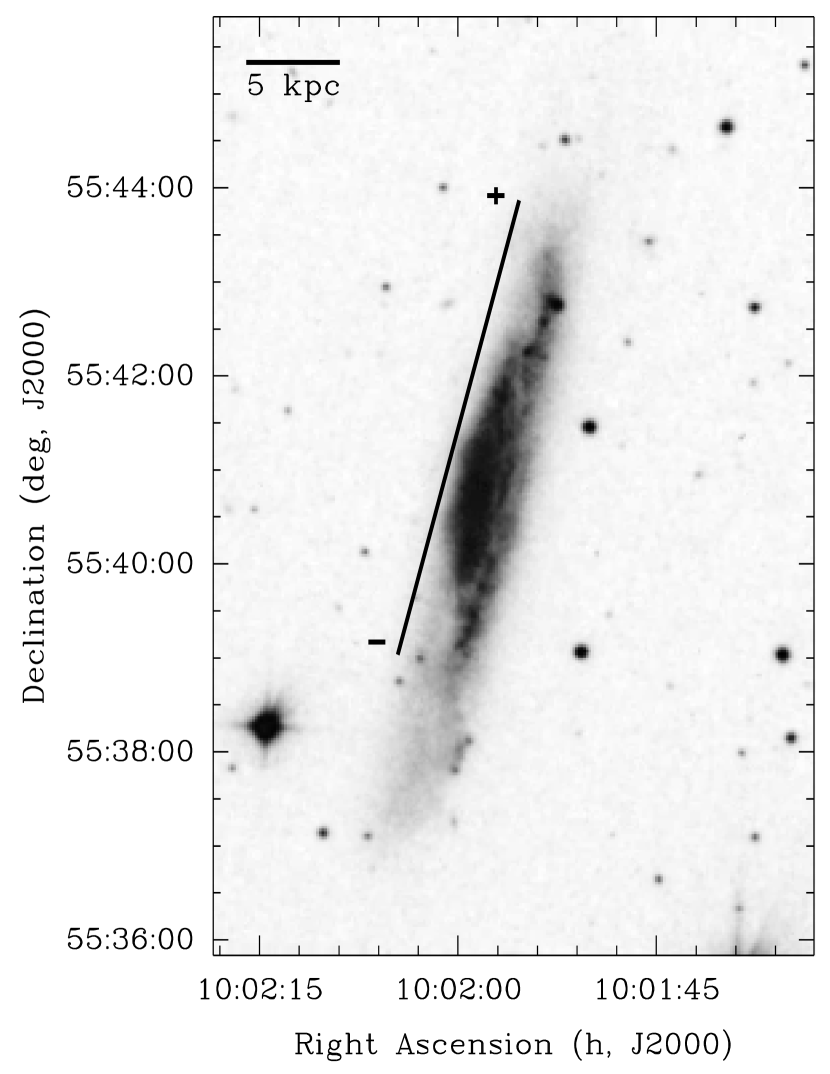
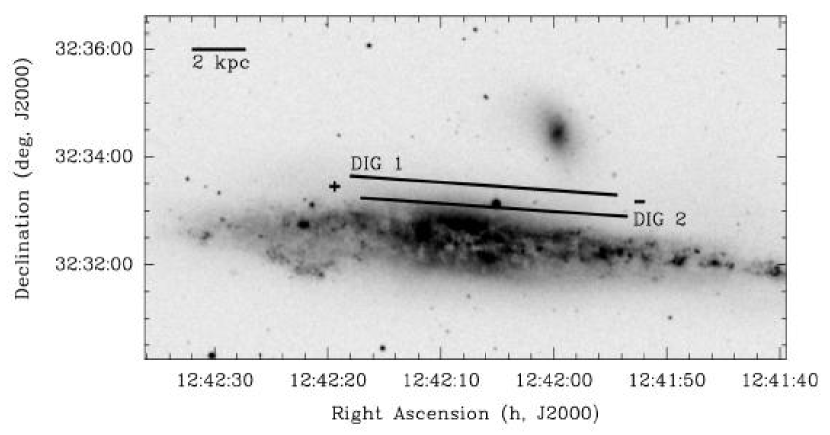
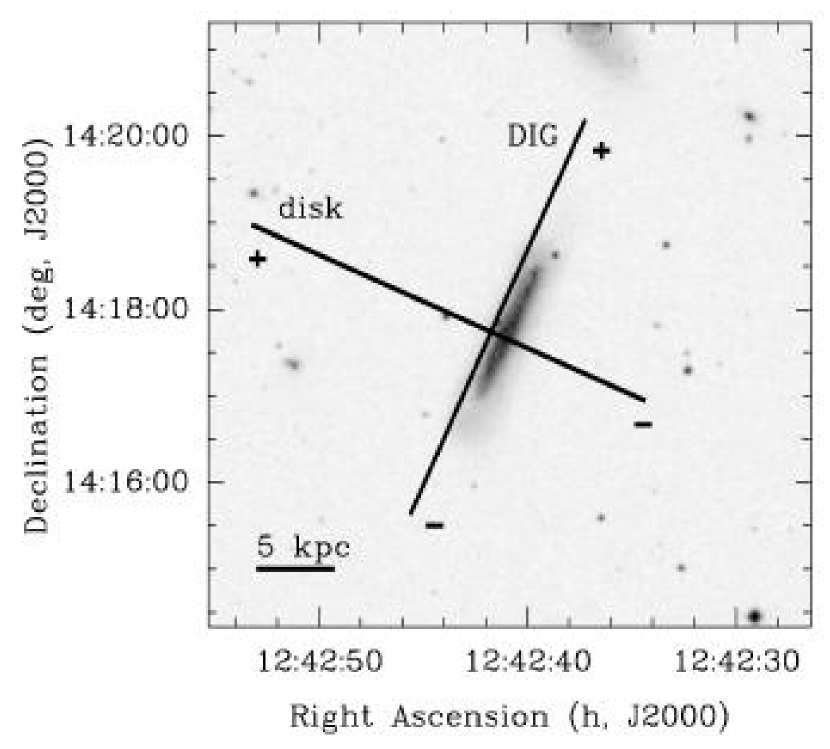
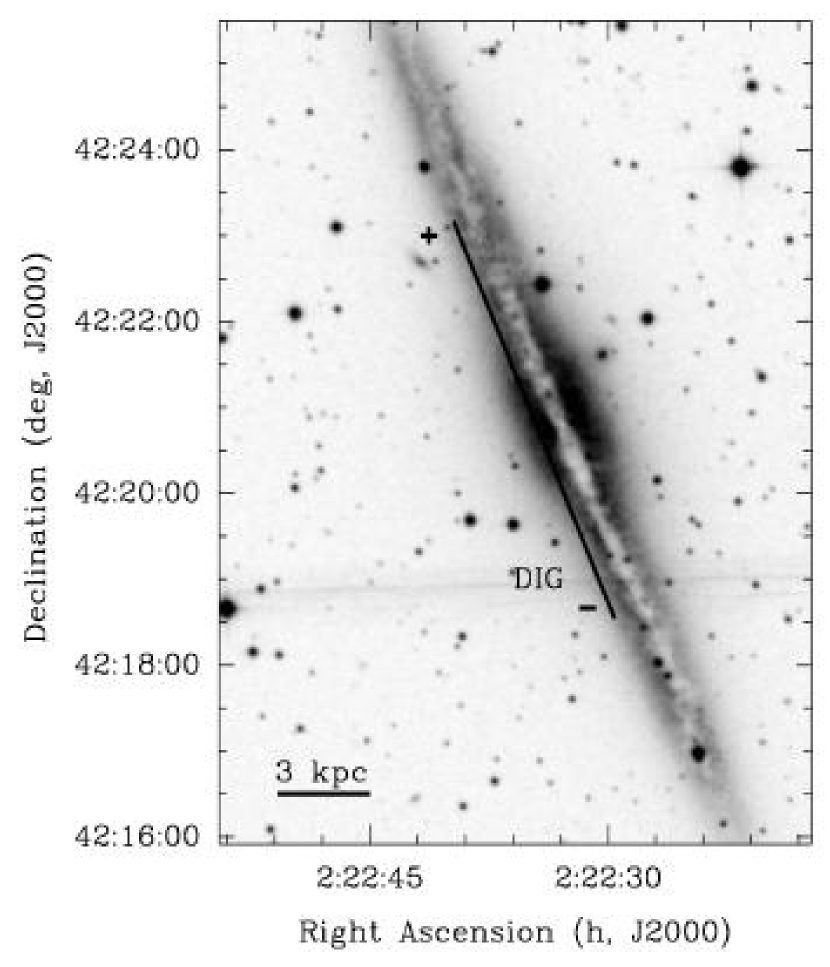
All spectra were obtained with the GoldCam spectrograph at the 2.1 m telescope on Kitt Peak, AZ, in 2000 February 29 – March 6 and September 26 – 27. We used grating 9 with decker 4 and a slitwidth of 25. This yielded a pixel scale of 080/pixel or 2.44 Å/pixel, respectively, and a wavelength range from about 3500 Å to 7400 Å. The spectral resolution was dominated by the instrumental line width and ranges from 410 at [O II] to 750 at [S II]. We used filter WG345 to remove possible overlaps between orders. Exposure times varied from 20 min to 30 min depending on the weather (with the shorter exposure times during the first night which was partly cloudy). Table 1 lists the number of combined exposures, the total integration time for each slit position, the distance of the slit position from the galactic center, and the scale. The slit positions are shown in Figures 1 to 5. “DIG” slits are parallel to the disk, and “disk” slits are perpendicular through the disk of the galaxies. We also took spectra of blank sky regions before or after each set of galaxy observations. The emission lines at the parallel slit position at higher galactic latitude in NGC 4631 (catalog ) (DIG 1 slit) were too weak, so that we moved the slit closer to the midplane of the galaxy (DIG 2 slit). We could not identify any [O II] emission in the raw data of NGC 5775 (catalog ) and therefore abandoned this galaxy during our observing run. However, the [O II] emission line became visible after careful sky subtraction.
| Object | Slit Position | Exposures | Total Integration Time | Distance to CenteraaCenter defined by the NASA/IPAC Extragalactic Database (NED) | Scale |
|---|---|---|---|---|---|
| (min) | (kpc) | (arcsec kpc-1) | |||
| NGC 891 (catalog ) | DIG | 3 | 90 | 0.7 | 21.5 |
| NGC 3079 (catalog ) | DIG | 9 | 270 | 2.3 | 11.9 |
| NGC 4631 (catalog ) | DIG 1 | 2 | 60 | 2.0 | 29.9 |
| NGC 4631 (catalog ) | DIG 2 | 9 | 265 | 1.2 | 29.9 |
| NGC 4634 (catalog ) | disk | 4 | 110 | 0.5 | 10.9 |
| NGC 4634 (catalog ) | DIG | 3 | 90 | 1.0 | 10.9 |
| NGC 5775 (catalog ) | disk 1 | 1 | 20 | 4.8 | 8.3 |
| NGC 5775 (catalog ) | disk 2 | 2 | 40 | 4.4 | 8.3 |
The spectra were reduced using standard procedures in IRAF111IRAF is distributed by the National Optical Astronomy Observatories, which are operated by the Association of Universities for Research in Astronomy, Inc., under cooperative agreement with the National Science Foundation.. The analysis was done in MIDAS222MIDAS is developed and maintained by the European Southern Observatory.. The line ratios were calculated from Gaussian fits to the emission lines. Before measuring the emission lines, we averaged over several rows to increase the signal–to–noise ratio. The number of averaged rows and the corresponding interval for each slit position are listed in Table 2. We point out that we used a gliding average. Therefore adjacent data points are strongly correlated in the subsequent figures. However, we believe that oversampling is necessary to show the full extent of the data. The plotted error bars represent the statistical uncertainties of the smoothed spectra. The H measurements were corrected for the underlying Balmer absorption line. The high values of the H/H line ratio in the plane of NGC 4634 (catalog ) and NGC 5775 (catalog ) (disk slits) show that extinction correction is necessary for these slit positions. However, the extinction correction seems to overcorrect the measurements in the blue part of the spectrum. We therefore show both extinction corrected line ratios and uncorrected line ratios for the disk slits in our analysis in section 3. None of the DIG slit positions in our small sample shows a significant increase in H/H over the theoretically expected value of 2.9 (for 10 000 K gas). We therefore did not apply an extinction correction to these slit positions. A detailed description of the data reduction procedures and the corrections for Balmer absorption lines and extinction can be found in Paper I.
| Object | Slit Position | Average | Blur FactoraaNumber of averaged rows minus 1 converted to parsecs to show the range in the subsequent figures that is affected by the averaging |
|---|---|---|---|
| (rows) | (pc) | ||
| NGC 891 (catalog ) | DIG | 9 | 300 |
| NGC 3079 (catalog ) | DIG | 5 | 270 |
| NGC 4631 (catalog ) | DIG 1 | 15 | 375 |
| NGC 4631 (catalog ) | DIG 2 | 9 | 215 |
| NGC 4634 (catalog ) | disk, pc | 1 | 0 |
| NGC 4634 (catalog ) | disk, pc | 9 | 590 |
| NGC 4634 (catalog ) | DIG | 9 | 590 |
| NGC 5775 (catalog ) | disk 1 | 9 | 770 |
| NGC 5775 (catalog ) | disk 2 | 9 | 770 |
3 RESULTS
Only four of the eight slit positions yielded reliable measurements for the six emission lines necessary for our analysis ([O II] 3727Å, H, [O III] 5006.9Å, H, [N II] 6583.4Å, [S II] 6716.4Å). Due to the low resolution in our spectra, we were not able to distinguish between [O II] 3726.0Å and [O II] 3728.8Å. Thus, we use [O II] 3727Å to mean the sum of both [O II] doublet lines. Our goal was to fit the line ratios [O II]/H, [O III]/H, [N II]/H and [S II]/H keeping the number of assumptions to a minimum. Since each line ratio depends on element abundance, ionization fraction and temperature, we had to make five assumptions: 1) We assumed that all the emitting gas is ionized. This means in particular that H. 2) Since the ionization potentials of neutral nitrogen and oxygen are similar, we assumed that the ionization fractions of both elements are the same for singly ionized atoms, i.e. N/O (e.g. Sembach et al. 2000). 3) It has been observed in several objects that the ratio of the oxygen abundance to the sulfur abundance is about 100/3, independent of metallicity (Mathis, 2000). We adopted this ratio to derive the sulfur abundance from the oxygen abundance. 4) We assumed that O+++/O (and higher ionization stages of oxygen) is negligibly small and therefore (O. (No assumptions were made for doubly ionized sulfur or doubly ionized nitrogen, i.e. we neither derived nor used these ionization fractions.) 5) One additional assumption was necessary, which yielded three different fitting methods. In Paper I, we introduced these three methods. We adopted a constant ionization fraction O++/O along the slit (Method A), a constant temperature along the slit (Method B), and a constant oxygen abundance along the slit (Method C). We concluded that using a constant oxygen abundance (Method C) yielded the most reasonable results in our simple models. In this paper, we will only use the method of constant oxygen abundance for our analysis. Since it is important to keep in mind how the properties were derived and what they depend on, we summarize the important steps of our analysis here. A detailed description of our method can be found in Paper I (Method C).
We combined the equations of the [O II]/[O III] and [O III]/H line ratios to eliminate the dependence on the ionization fractions of oxygen (Paper I). [O III]/H becomes
| (1) |
(Osterbrock, 1989). All line ratio equations contain intensities in ergs s-1 cm-2 sr-1 with being the electron temperature in 10 000 K. We assumed solar abundance for oxygen (O/ (Däppen, 2000)). The assumption of solar oxygen abundance yielded the most reasonable values for temperature, nitrogen abundance and ionization fractions in Paper I (in comparison with the other methods discussed in Paper I) with the indication that slight changes in the oxygen abundance do not change the values of the derived properties significantly. We therefore did not use this method with other values for the oxygen abundance.
We calculated the minimum and maximum allowed electron temperature for each data point along the slit by fitting the observed [O III]/H line ratios within their 1 error bars using temperature increments/decrements of 100 K in equation (1). The allowable fractions of O++ then were found by fixing the [O III]/H line ratio at its observed value, and fitting this with our estimated maximum and minimum electron temperatures at each point along the slit:
| (2) |
This approach is consistent with our parametric models where we seek to demonstrate that variations in electron temperature can explain observed trends in line ratios. However, it has the disadvantage of causing the predicted [O III]/H ratios to coincide at the maximum and minimum electron temperatures. In general, random errors are assumed to be dominated by the uncertainty of the H line strength measurements, whereas errors in line ratios of [O II] or [O III] over any red emission line (H, [N II], [S II]) tend to be systematic and dominated by the extinction correction.
For both calculated temperature extremes, we derived the nitrogen abundances and the sulfur ionization fractions using the equations
| (3) | |||||
| (4) |
(Osterbrock, 1989). The final step was to compare the observed H line ratios with the predicted ratios based upon the derivations above:
| (5) | |||||
| (6) | |||||
| (7) | |||||
| (8) |
(Osterbrock 1989; Haffner et al. 1999).
3.1 NGC 5775
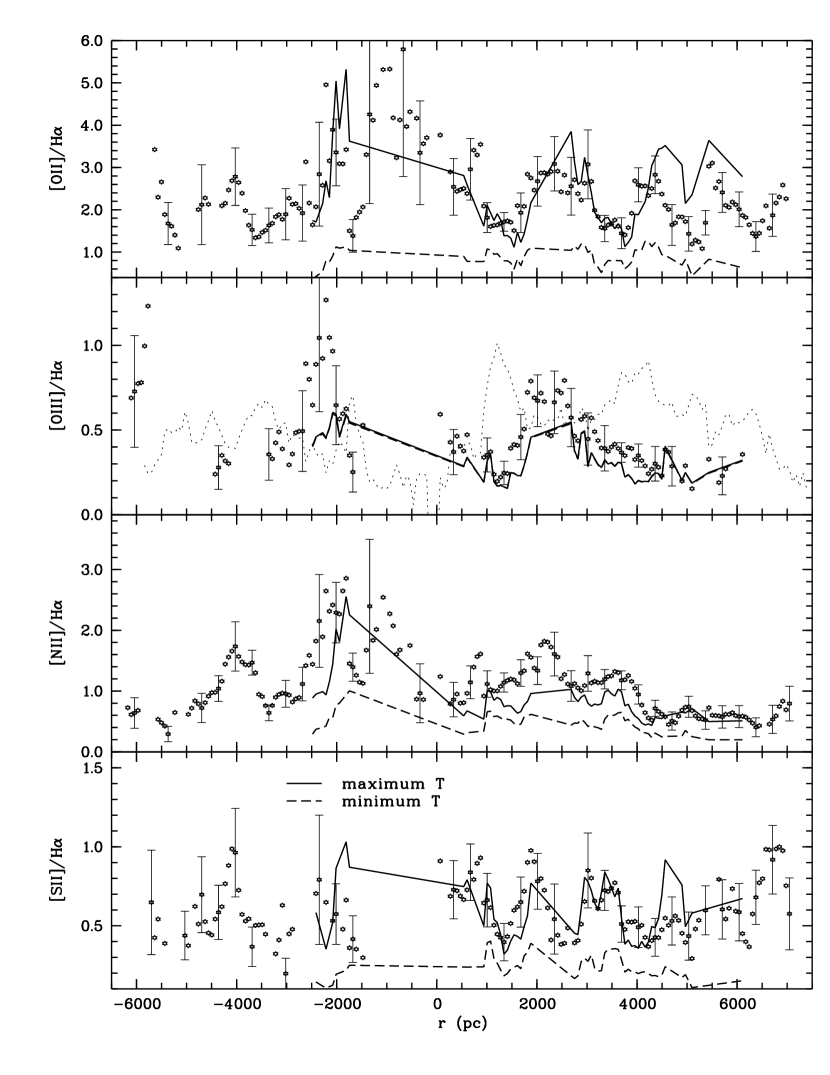
Figure 6 shows the observed line ratios and the derived properties for NGC 5775 (catalog ) (disk 2 slit) for both cases, extinction corrected and uncorrected, as a function of distance from the midplane. Our disk slits cross regions where extended emission from eDIG is seen in the deep H[N II] images of Collins et al. (2000). From these images we also estimate that eDIG is likely to dominate at distances of kpc in this slightly inclined galaxy. The optical depth as derived from H/H is relatively high () along the entire region in which we obtained measurements of high enough signal–to–noise ratios. The applied extinction correction yielded maximum factors of about 12 for [O II], 3 for H, 2.7 for [O III] and about 1 for the red emission lines. Although the actual numbers may differ a little between extinction corrected and uncorrected line ratios, the increasing or decreasing trends in the intensity line ratios are the same in both cases. The lowest line ratios correlate with the brightest line emission.
The line ratio predictions using the maximum allowed temperature match the data well within the error bars in the extinction corrected case (except for a small “bump” around pc). The predictions derived from the minimum allowed temperature also match the data within the error bars or are somewhat lower for [S II]/H and [N II]/H. In the uncorrected case, the maximum temperature yields too high values, whereas the fits of the minimum temperature lie more or less within the error bars or within the range. The predictions derived from the maximum allowed temperature also match the data reasonably, to within , with most of the problems appearing in regions where extinction corrections are important.
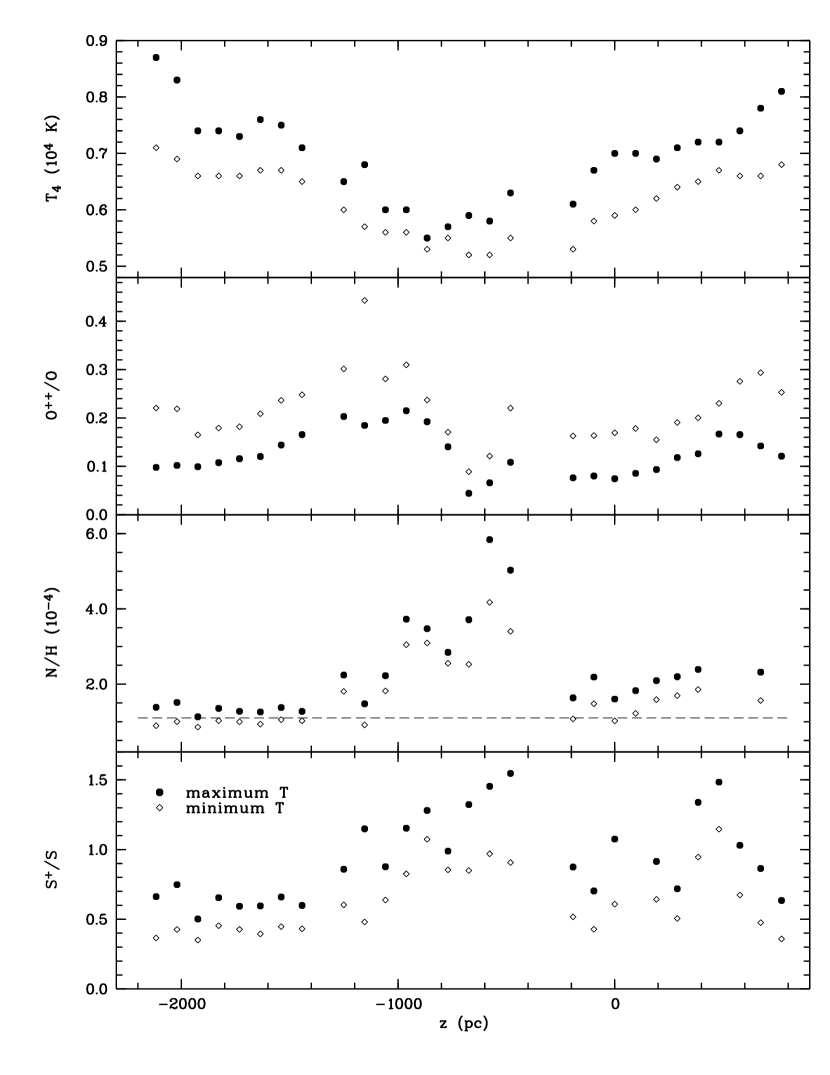
The derived electron temperature increases with in both cases, although the increase is stronger in the uncorrected case. The oxygen ionization fraction decreases with on one side of the disk ( kpc) with the uncorrected values showing the stronger decrease, but increases on the other side up to about 600 pc, before it starts to decrease again. The nitrogen abundance shows a large difference between the corrected and the uncorrected values. In the extinction corrected case, N/H seems to decrease towards positive along the slit, whereas the uncorrected N/H shows a maximum near the midplane (between kpc and 0 pc), but stays constant at solar value or slightly above along the rest of the slit. The sulfur ionization fraction also shows a larger difference between the two cases. The extinction corrected values decrease towards positive along the slit, whereas the uncorrected values for S+/S decrease with on one side (negative ), but only slightly decrease or stay constant with increasing on the other side. Most values for S+/S derived from the maximum allowed temperature are greater than unity and thus not physical. Therefore, the maximum allowed temperature can be ruled out as an option in this case. The other slit (disk 1) shows a second peak in H at pc, thus possibly associated with ionized gas in the disk. The [O II]/H line ratio reaches a local minimum in that area. However, since the other emission lines have too low signal–to–noise ratios, we could not analyze them and therefore do not discuss them here.
3.2 NGC 3079
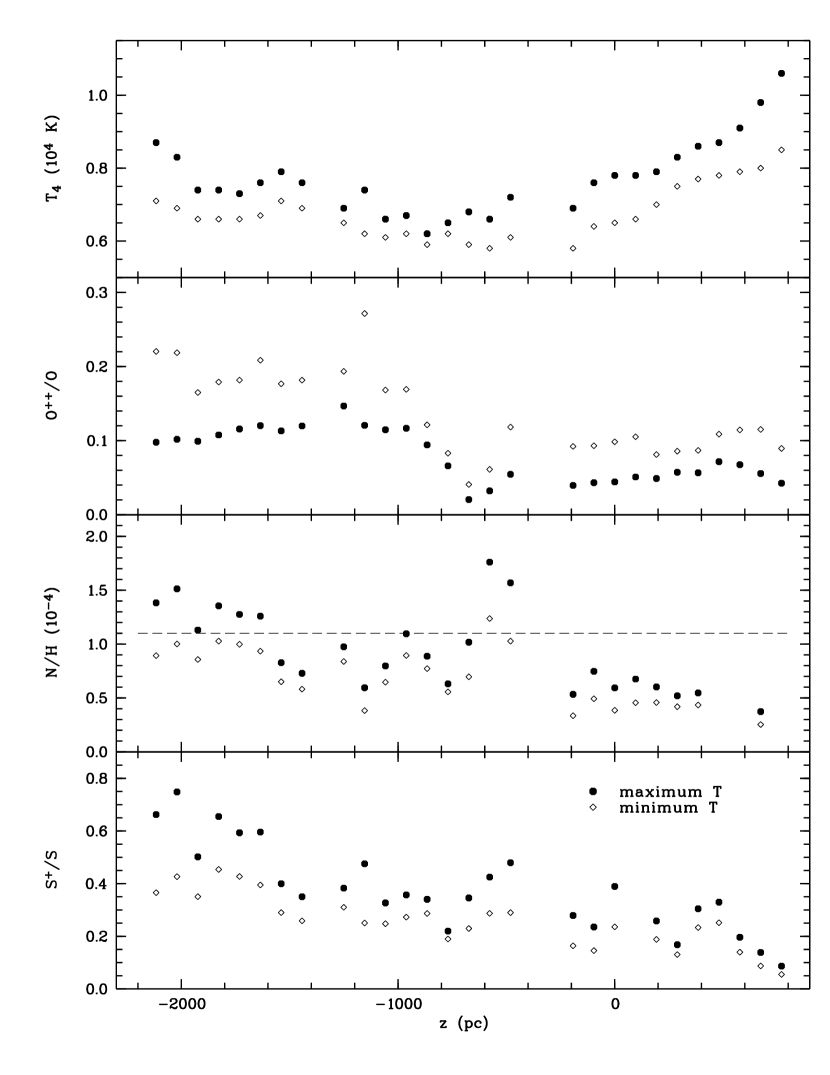
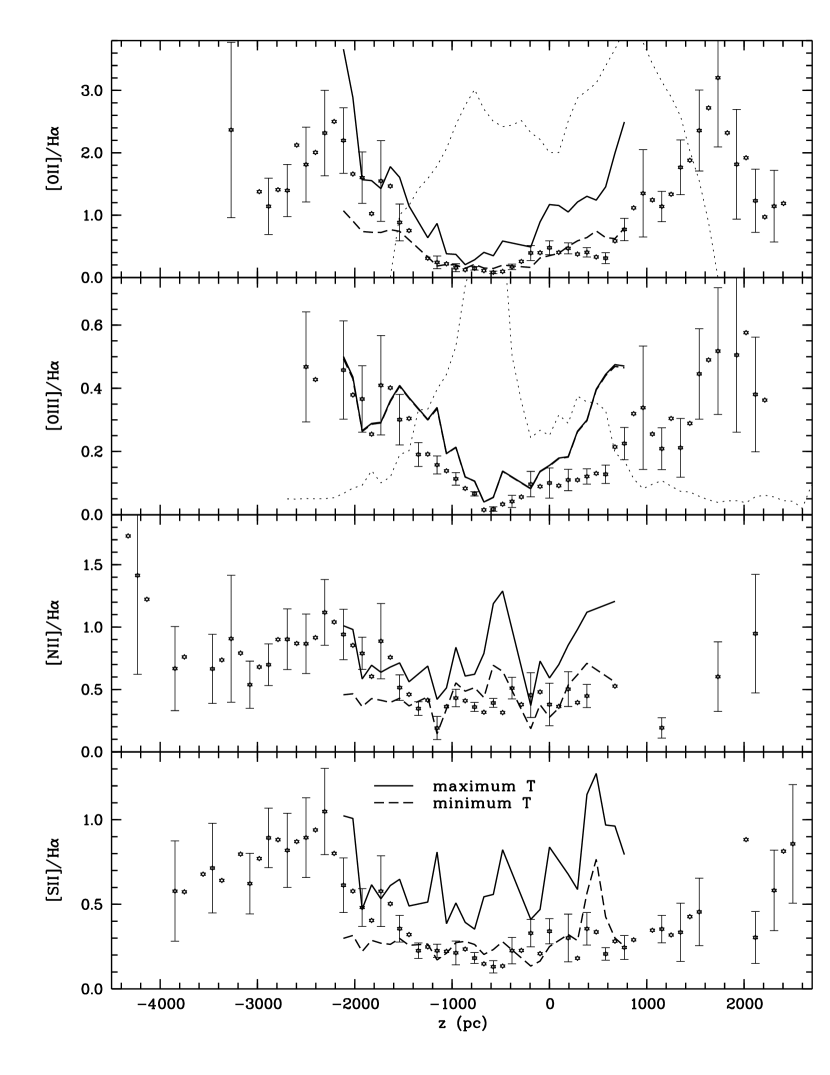
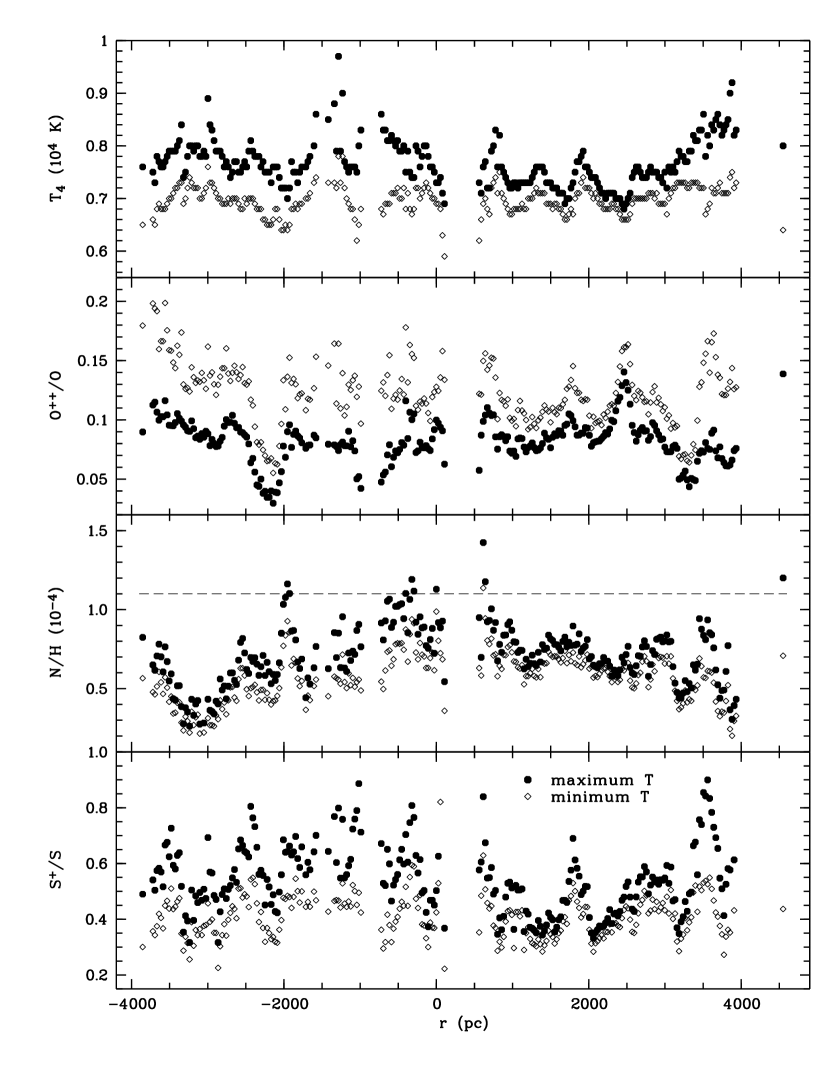
Figure 10 shows the derived electron temperatures, abundances and ionization fractions as well as the predicted line ratios for the DIG slit of NGC 3079 (catalog ) at a constant distance above the midplane. The observed [O II]/H line ratio shows variations beyond kpc which are not present in the other line ratios. The line ratio predictions using the minimum allowed temperature are too low in comparison with the observed line ratios. The line ratio predictions derived from the maximum allowed temperature are a little low for the [N II]/H and [O III]/H line ratios and somewhat higher for [O II]/H at about kpc, but in general, the predictions match the observed data within the error bars. The derived electron temperature varies along the slit by about 1500–2000 K. It is lower in regions of stronger H emission, i.e. at pc and pc (we will discuss this in more detail in section 4); however, there is no systematic trend with increasing distance from the estimated center of the galaxy. The oxygen ionization fraction stays relatively constant with a few variations along the slit. The nitrogen abundance seems to decrease slightly with increasing , as expected for a radial chemical abundance gradient. In Figure 10b we also find an apparent rapid increase in nitrogen abundance towards the end of our slit, at kpc. This suggests that a problem exists either with the model or the data, and in either case, the approach adopted here probably is not yielding reliable results. The sulfur ionization fraction appears to stay more or less constant along the slit.
3.3 NGC 4631
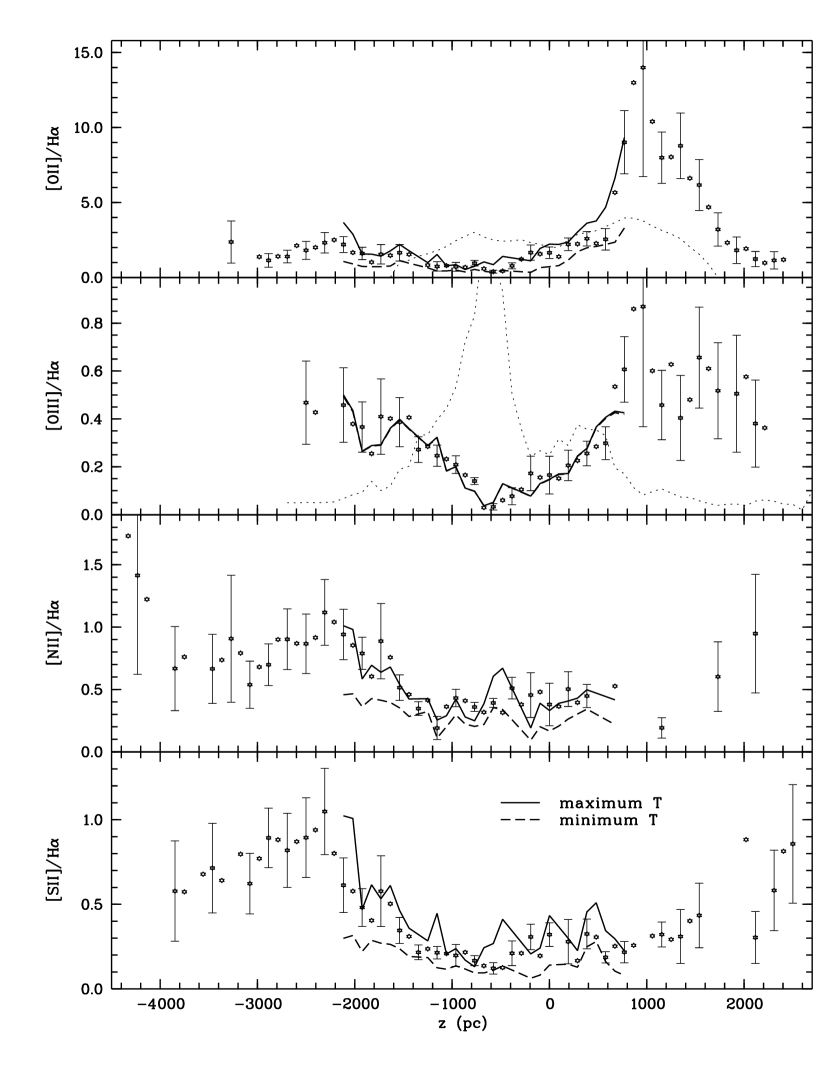
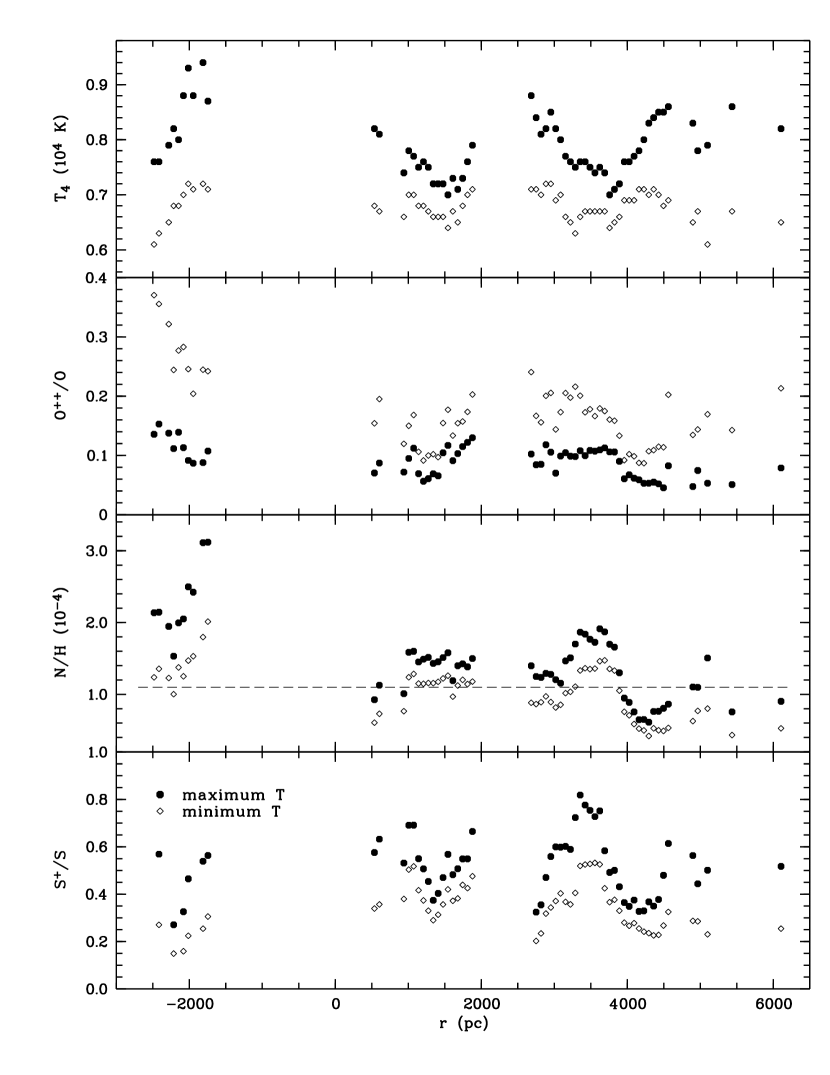
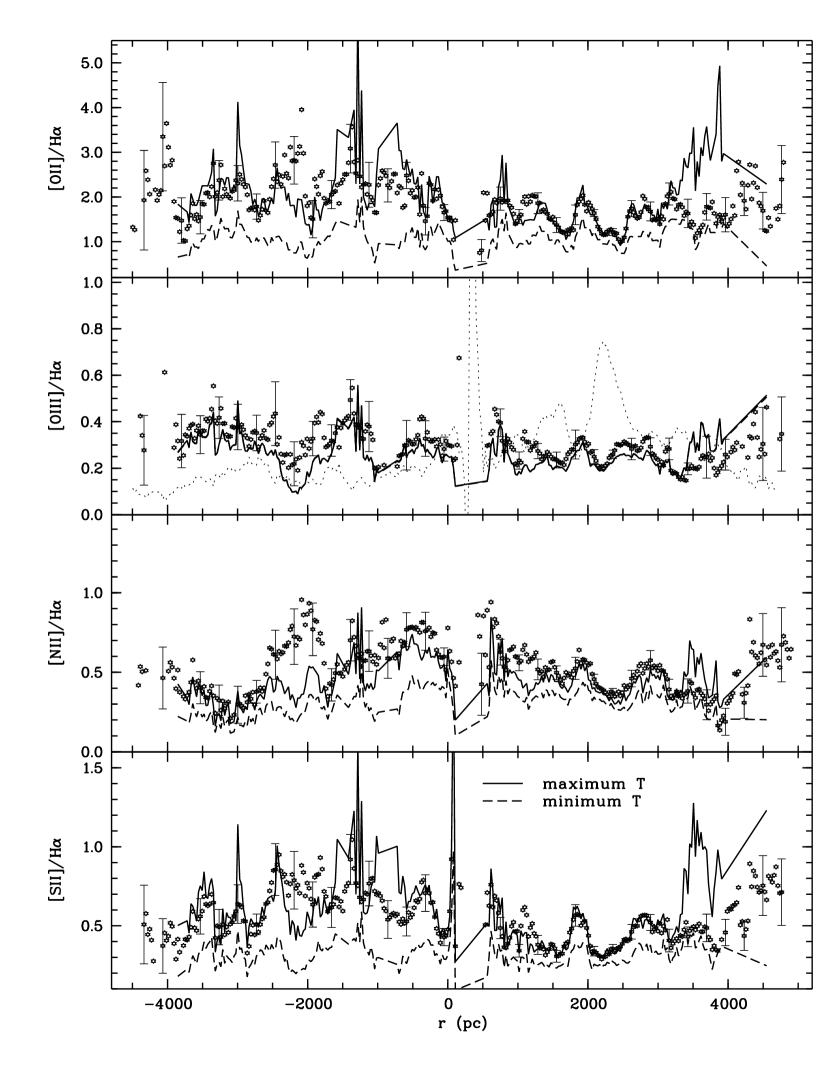
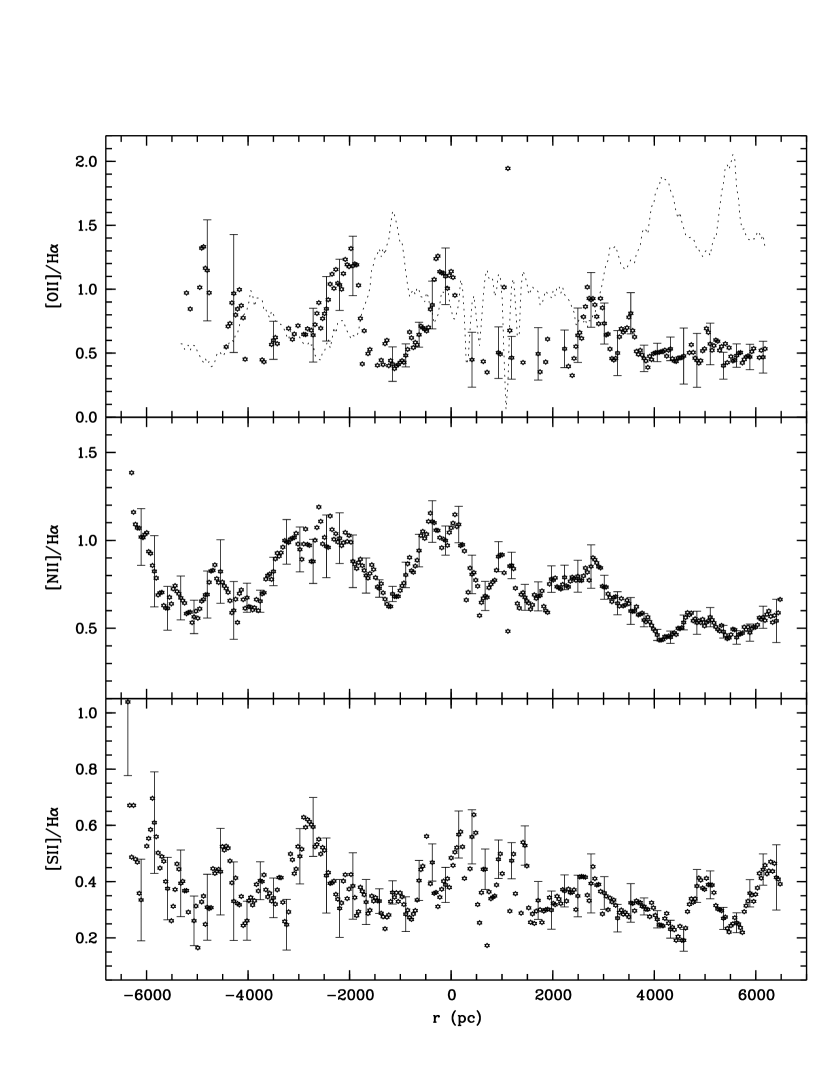
The derived properties and line ratios for the DIG 2 slit (parallel to the disk) of NGC 4631 (catalog ) are shown in Figure 12. All line ratios are higher in the western part of the slit (negative ) than in the eastern part. Variations in the line ratios coincide with variations in the emission line intensities with brighter regions having lower line ratios (cf Martin & Kern 2001). The [O II]/H and [O III]/H line ratios behave similarly except for two regions. At pc, [O II]/H reaches a maximum, whereas [O III]/H shows a minimum. Only a part of the brighter emission region at pc has lower [O III]/H values than the surrounding area. The other three line ratios have minima in this region. All line ratios appear to slightly decrease with or to stay constant in the eastern part of the slit up to about kpc, where the line ratios seem to increase with increasing distance from the center. The line ratios appear to stay constant in the western part of the slit () with a possible decrease in [S II]/H and [N II]/H beyond kpc.
The line ratio predictions using the minimum allowed electron temperature are too low along the entire slit, as it is the case in NGC 3079 (catalog ) described above. The maximum temperature predictions match the observed data within the error bars except for the [O II]/H line ratio at kpc and pc and to a lesser extent also the [S II]/H ratio in the same areas. The H/H line ratio is higher in these regions () implying that extinction correction is necessary in these areas. [O II]/H, [N II]/H, and [S II]/H show a mismatch between observed and predicted line ratios at kpc which is also related to variations in the H/H line ratio. We did not try to correct for extinction, because the H emission line is weak in these areas. The derived electron temperature seems to stay constant for most of the slit with somewhat higher values at than at , but the temperature appears to increase with beyond kpc. The oxygen ionization fraction, on the other hand, stays more or less constant at , but slightly increases with increasing at kpc. The nitrogen abundance decreases slightly with on both sides of the slit and is lower than the solar abundance along the entire slit. N/H shows a minimum at kpc. It is possible that the nitrogen ionization fraction decreases in this area instead of the nitrogen abundance, that is the second of our basic assumptions (N/O, cf section 3) could be inappropriate in this area. The sulfur ionization fraction behaves similarly to the electron temperature, i.e. it stays constant with higher values in the western part () than in the eastern part, but increases with in the eastern part beyond kpc.
The emission in the other parallel slit (called DIG 1), which is at larger distance from the midplane, is very faint and did not yield enough reliable measurements. Therefore, we do not show the line ratios here, but briefly want to mention that [O II]/H and [O III]/H values could be obtained in the area kpc. The average values ( for [O II]/H and for [O III]/H) are a little higher than those of the DIG 2 slit in this area ( and , respectively). The average electron temperature of the DIG 1 slit is at kpc, while the variations in temperature are not correlated with those observed in the DIG 2 slit shown in Figure 12b. The average oxygen ionization fraction of the DIG 1 slit in the same area is .
3.4 NGC 4634
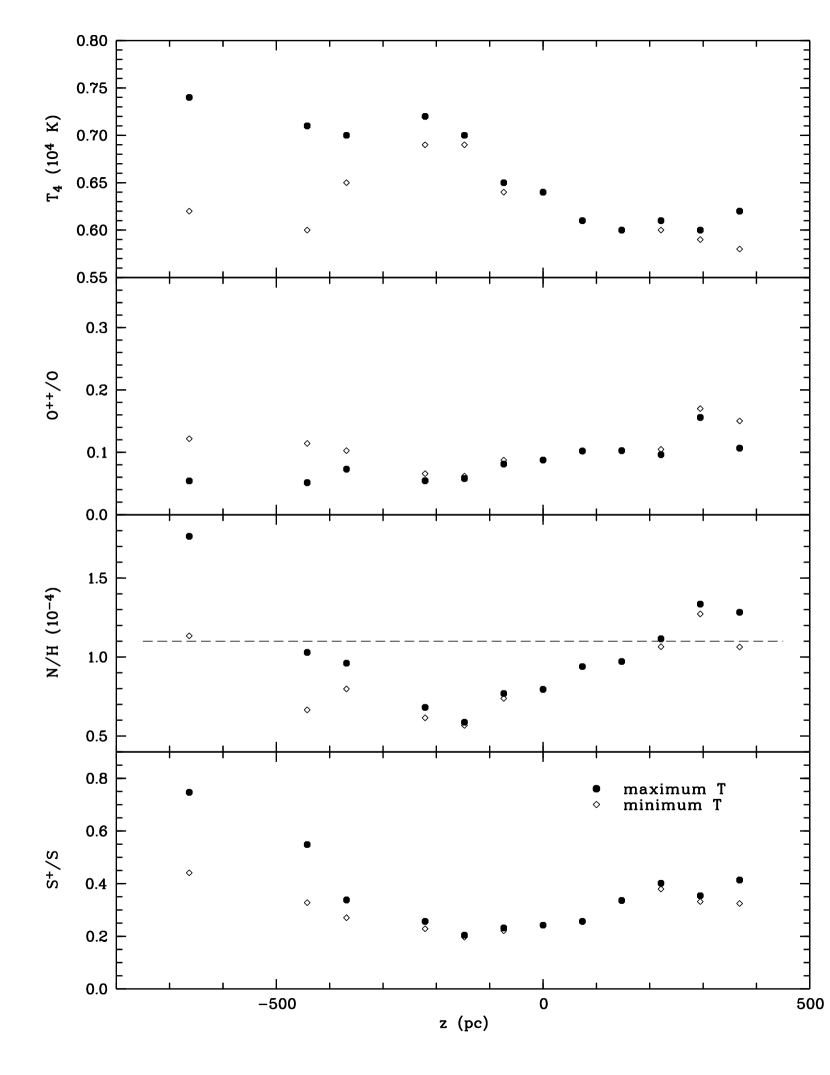
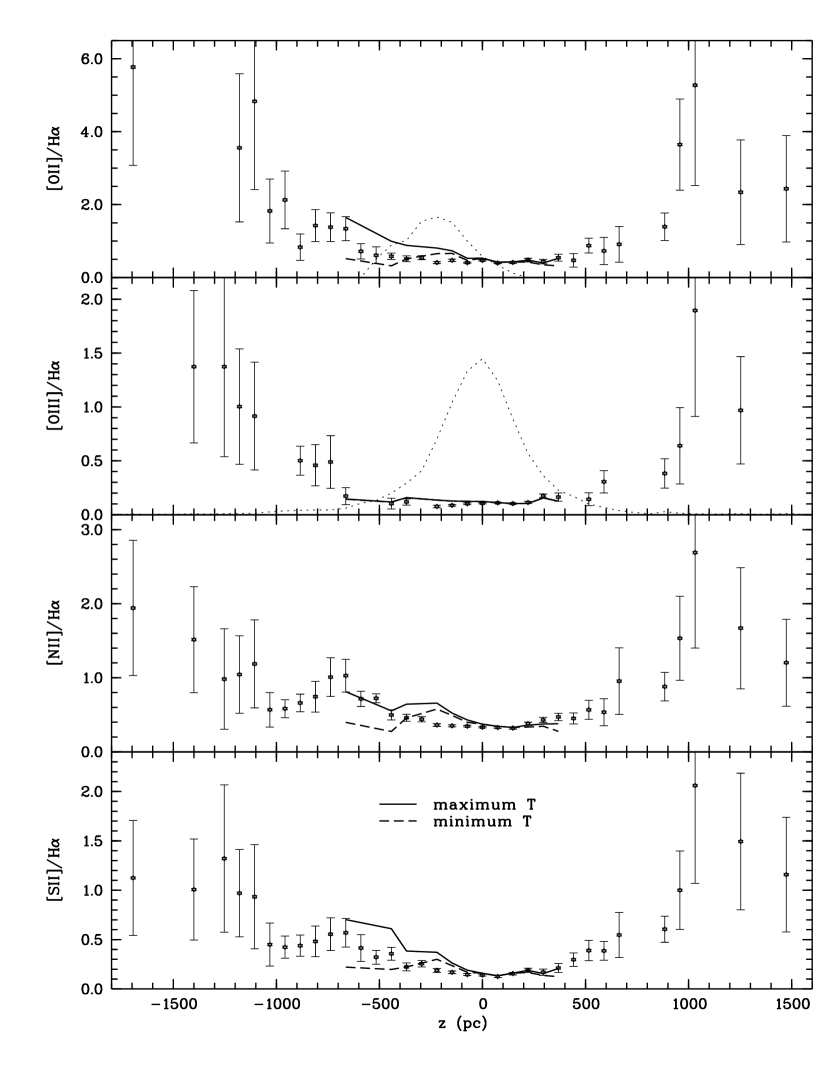
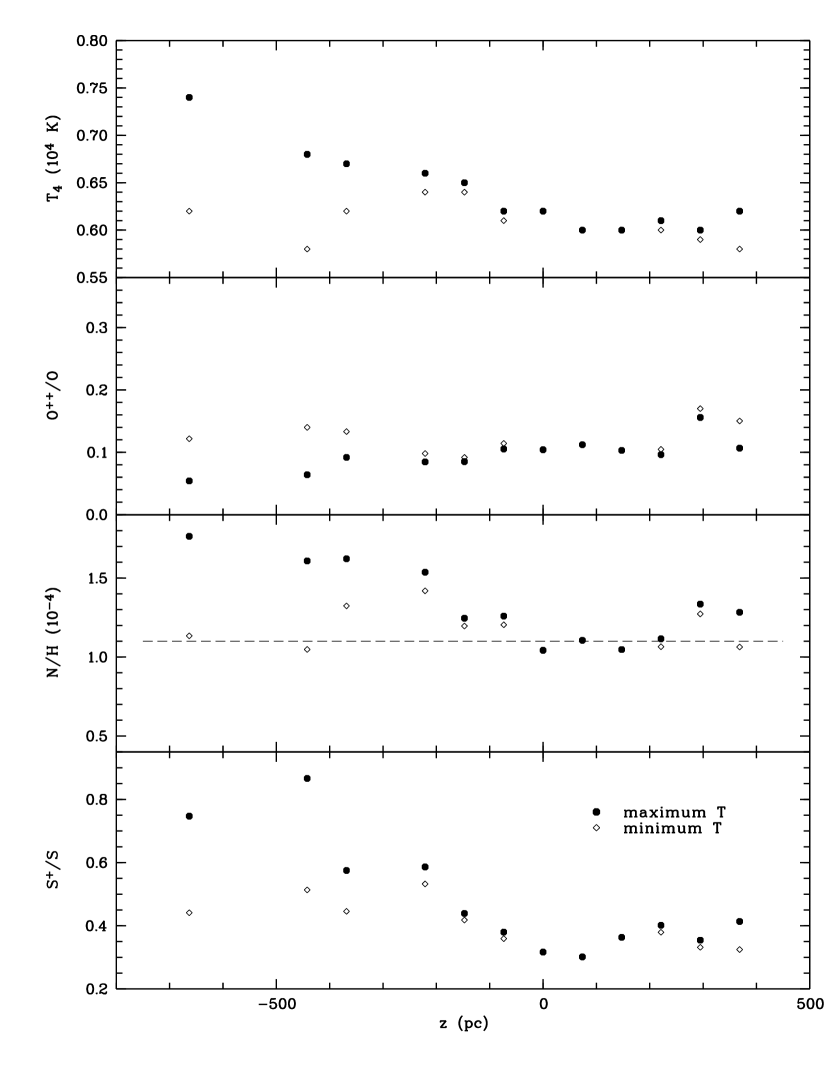
For NGC 4634 (catalog ), the line ratios and derived properties of the disk slit (i.e. perpendicular to the plane) are shown in Figure 14. The derived optical depth is relatively low in comparison with the optical depth in other galaxies (see Paper I for comparison). The applied extinction correction yielded a maximum factor of only 2.9 for [O II] (unlike 9–12 in Paper I), 1.6 for H and 1.5 for [O III], whereas the red emission lines had factors of 1. Figure 14 shows both the extinction corrected line ratios and properties and the uncorrected values for each.
Like in the galaxies discussed above, the line ratios in NGC 4634 (catalog ) are lowest (even [O III]/H), where the emission lines are brightest. The peak in the [O II]/H line ratio at pc (Fig. 14a) is introduced by the extinction correction. The predicted line ratios in the extinction corrected case are again too low for the minimum allowed temperature (as observed in the other galaxies). The predictions using the maximum temperature match the observed data reasonably well ([O III]/H, [N II]/H) or are slightly higher than the observed data ([O II]/H and [S II]/H at pc). The uncorrected line ratio predictions are too high in the area where ( pc).
The maximum allowed electron temperature increases with increasing distance from the midplane in the southwestern part of the slit () in both cases, extinction corrected as well as uncorrected derivations. The minimum allowed temperature first increases with increasing height and then decreases at about pc. The oxygen ionization fraction slightly decreases towards lower (for ) or maybe stays constant (for ). The trend in the nitrogen abundance, however, depends somewhat on the extinction correction, because it was derived using blue and red lines. The extinction corrected N/H shows a minimum at about pc, whereas the uncorrected abundance shows a minimum near . Both suggest that N/H increases with . We observed this strong variation between the two cases in other galaxies as well (see Paper I). The sulfur ionization fraction increases with in both cases, following the same shift of the minimum as the nitrogen abundance.
The line ratios of the slit parallel to the disk of NGC 4634 (catalog ) (DIG slit) are shown in Figure 18. Unfortunately, the H emission line was too weak to yield reliable measurements. Extinction correction did not seem necessary. The [O II]/H line ratio appears to overall decrease towards lower , while the emission line intensities increase towards lower . Around pc, the line ratios [N II]/H and [O III]/H are both slightly higher than at the rest of the slit. [N II]/H appears to increase beyond kpc and basically stays constant near the center of the galaxy. However, this line ratio shows two broad minima at kpc and kpc. Both minima seem to exist also in the [S II]/H line ratio. Although we were not able to apply our analysis method to this slit position, the observed line ratios might still be useful in comparison with the other DIG slits. For example, a comparison with the H line ratios and the emission line intensity of the DIG slit of NGC 4631 (catalog ) suggests that the minimum around kpc in [N II]/H and [S II]/H is caused by temperature variations, whereas the minimum around kpc is caused by decreases in abundance or ionization fraction of nitrogen and sulfur.
3.5 NGC 891
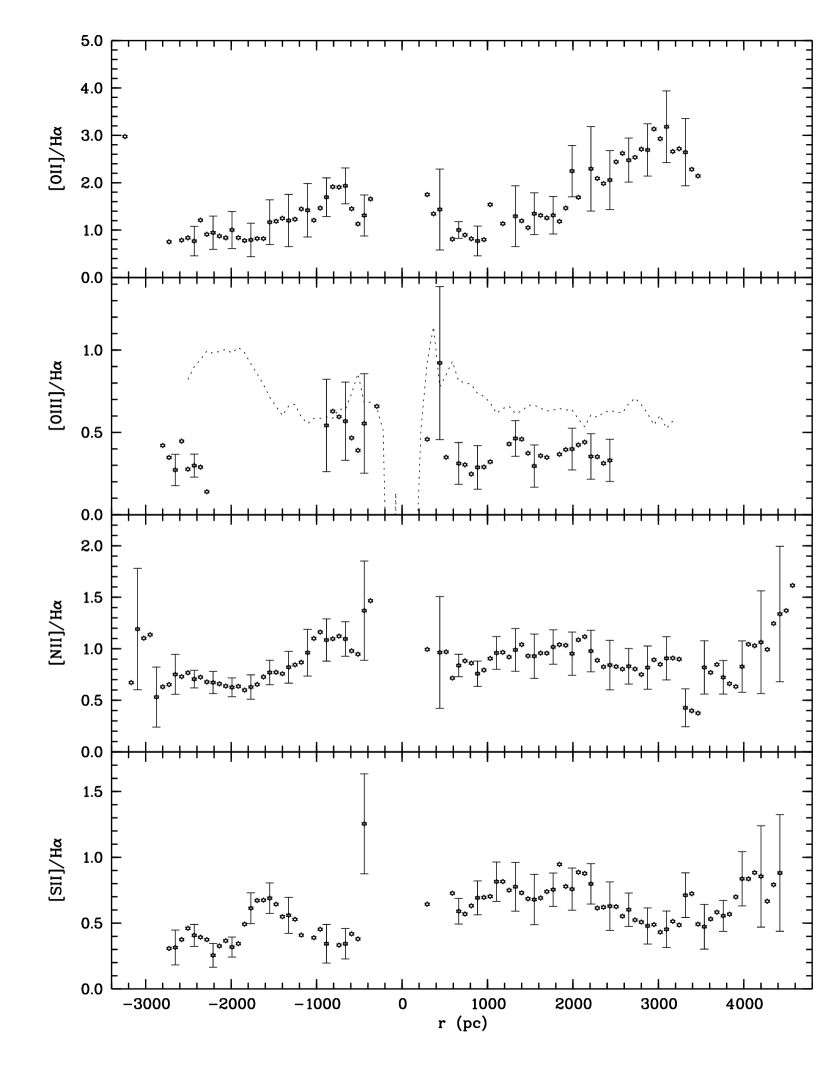
We were not able to obtain good measurements of the H line for NGC 891 (catalog ) (DIG slit). We therefore could not derive the optical depth for this slit position. However, we do not expect the extinction to be significant in these observations. We were also not able to measure [O III], leaving us only with the line ratios [O II]/H, [N II]/H, and [S II]/H, which are shown in Figure 19. The line ratios are on average higher and show stronger variations in the southwestern part of the slit () than in the northeastern part. The variations in the line ratios seem to correlate again with the brightness of the emission lines, i.e. brighter line emission yields lower line ratios. However, even though the variations in the line emission have more or less the same magnitude on both sides of the slit, the variations in the line ratios differ between the two sides (0.2–0.3 at and at for both [O II]/H and [N II]/H).
4 DISCUSSION
In general all our galaxies follow the trend of higher forbidden line intensities relative to H in regions of lower line emission. As a consequence, the line ratios of slit positions cutting through the disk increase with increasing . However, there are exceptions: [O III]/H and [O II]/H at kpc in NGC 5775 (catalog ) (disk 2) and apparently all H line ratios at kpc in NGC 4634 (catalog ). The line ratios of the slits parallel to the midplane show strong small scale variations probably due to structures in the DIG. The line ratios have on average lower values near overall brighter emission regions. This behavior has been observed in other galaxies as well including both irregulars and spirals and covering a range in properties (e.g. Ferguson, Wyse, & Gallagher 1996; Domgörgen & Dettmar 1997; Otte & Dettmar 1999; Haffner et al. 1999).
Over the last year, two other groups have obtained spectroscopic data of NGC 5775 (catalog ), Tüllmann et al. (2000) (hereafter TDSUR) and Collins & Rand (2001) (hereafter CR). TDSUR’s slit position is the same as our disk 2 slit, whereas CR’s slit 2 lies a little more towards the center of NGC 5775 (catalog ). We assumed the same distance to NGC 5775 (catalog ) as CR (24.8 Mpc) and consider in our comparisons the slightly different distance used by TDSUR (26.7 Mpc). Our [N II]/H and [S II]/H measurements match those observed by TDSUR and CR within the uncertainties except for the minimum beyond kpc in our data, which is possibly observed to a lesser extent by TDSUR, but not existent in CR’s data. CR’s [N II]/H measurements are a little lower than TDSUR’s and ours (0.55 as opposed to 0.7 or 0.8 at kpc (SW)). The difference in the line ratios between TDSUR’s and our measurements increases towards bluer lines. CR’s and our [O III]/H values are higher than those measured by TDSUR (about 0.4 at kpc (SW) as opposed to 0.2, and about 0.1-0.15 at 0 kpc as opposed to ). The difference between TDSUR’s and our measurements is largest in the [O II]/H values. TDSUR measure values from 0.05 to 0.4 between 0 kpc and kpc, whereas our measurements yield values of 0.4 (uncorrected) at 0 kpc and 1.6 at kpc, where extinction correction was no longer necessary. Unfortunately, CR did not observe the [O II] emission line and therefore cannot shed light on this large discrepancy in the [O II]/H line ratios. Despite this large difference in the [O II]/H values, the derived electron temperatures and temperature variations are comparable between TDSUR, who used the [N II]/H ratio to derive , and our measurements using the [O II]/H ratio. The temperatures are also in agreement with CR’s temperature values (also derived from the [N II]/H ratio). Our electron temperature increases from (uncorrected) or (extinction corrected) at 0 kpc to at kpc (using the average between minimum and maximum allowed temperature), while TDSUR and CR measure at 0 kpc and at kpc (SW). This suggests that [O II]/H and [N II]/H may be equally reliable in deducing variations in temperature in the DIG.
Tüllmann & Dettmar (2000) observed NGC 4634 (catalog ) as well. Their slit position s1 is the same as our disk slit of NGC 4634 (catalog ). Our [N II]/H and [S II]/H line ratios match their measurements within the error bars near the midplane. However, at larger distances from the disk Tüllmann & Dettmar measured lower line ratios than we did. In particular, the minimum at about kpc and the decrease beyond kpc do not exist in their data. Unlike Tüllmann & Dettmar, we could obtain [O II] and [O III] measurements. (Both groups also observed NGC 4302 (catalog ) and could not get reliable measurements of this galaxy, because the emission lines were too faint, whereas CR could at least measure the red emission lines.)
The oxygen and sulfur ionization fractions derived from our observations stay more or less constant in the DIG slits parallel to the midplane of our galaxies. The behavior of O++/O in the slits cutting through the disk is less clear due to the variations in O++/O along the slit and the uncertainty of the extinction correction (although the dependence of O++/O on the applied extinction correction is less than in the galaxies discussed in Paper I). The behavior of S+/S also depends strongly on the extinction correction. The values of the ionization fractions of sulfur and oxygen (including the measurements of NGC 891 (catalog ), NGC 4631 (catalog ), and NGC 3079 (catalog ) in Paper I) suggest that the ionization of the diffuse gas likely varies with distance from the midplane. However, it does not seem to vary on a large scale along the miplane at a constant height. If not all of the gas is ionized (for example H), the total amount of ionized oxygen should be reduced by a similar factor (in this example (O) due to the similar ionization potentials. Keeping the other basic assumptions unchanged (see beginning of section 3), the derived electron temperature and nitrogen abundance do not change in comparison with the H model, because the factor cancels out. However, the derived ionization fractions for oxygen and singly ionized sulfur are reduced by the same factor as the hydrogen ionization fraction. Thus, rather constant O++/O and S+/S in the H model turn to decreasing trends with increasing or when a decrease in H+/H is assumed with increasing distance from the galactic center or disk.
Smaller scale variations in the ionization fractions seem to be real and may be caused by different features or density fluctuations in the ionized gas as these variations are often related to emission line peaks. This is true for the smaller scale variations with amplitudes higher than the scatter in all the derived properties and line ratios (except maybe for peaks that were introduced or enhanced by the extinction correction). The extent of these variations is larger than the averaging done before the line measurements were taken, i.e. the variations cannot have been introduced by our averaging. Martin & Kern (2001) also observed fluctuations in the line ratios of NGC 4631 (catalog ) and concluded that they are probably the result of multiple phases in the interstellar medium.
Since the values of the nitrogen abundance also depend strongly on the extinction correction, it is not clear whether N/H decreases with increasing distance from the midplane in NGC 4634 (catalog ) and NGC 5775 (catalog ). Our DIG slits suggest that N/H decreases with increasing distance from the center, i.e. that the abundance is lower farther out in the galactic disks, where less star formation occurs. Since nitrogen is a secondary product of nucleosynthesis, its abundance depends more strongly on star formation and star formation history than the sulfur or oxygen abundances (which we assumed to be constant along the slits) and therefore is expected to be lower in the outer regions of the disks of galaxies. A decrease in oxygen abundance towards the outer regions of the galactic disks causes our models to predict an increase in electron temperature and to enhance the observed decrease in nitrogen abundance. In the DIG slit of NGC 4631 (catalog ), for example, a decrease in oxygen abundance from solar at 0 kpc to half the solar value at about kpc (i.e. decrease by a factor of 2) in the context of our models leads us to find a decrease in N/H from at kpc to at kpc, i.e. a decrease which equals or exceeds that of O/H. (In the individual models of constant oxygen abundance, N/H decreases by a factor of from 0 to 3 kpc.) The temperature increases by about 1000 K at kpc relative to the value obtained from the solar O/H model at the same position, yielding an overall increase of with . The trends in the ionization fractions are less obvious. S+/S increases by about 0.15, and O++/O increases by about at kpc when compared to the values from the solar O/H model at that position resulting in a possible increase in S+/S and O++/O with in NGC 4631 (catalog ). However, we have to keep in mind that changing other basic assumptions listed at the beginning of section 3 would change the derived properties. For example, variations in nitrogen abundance could become smaller, if we allowed changes in the nitrogen ionization fraction independently from those of O+/O.
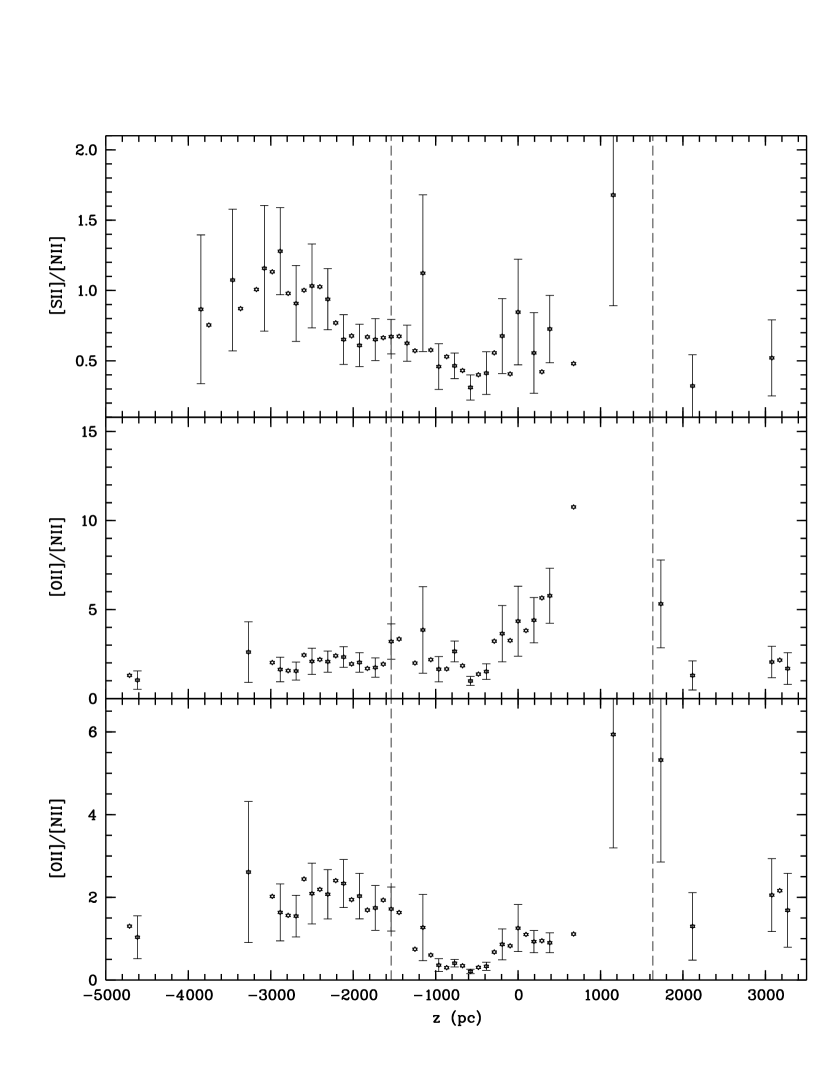
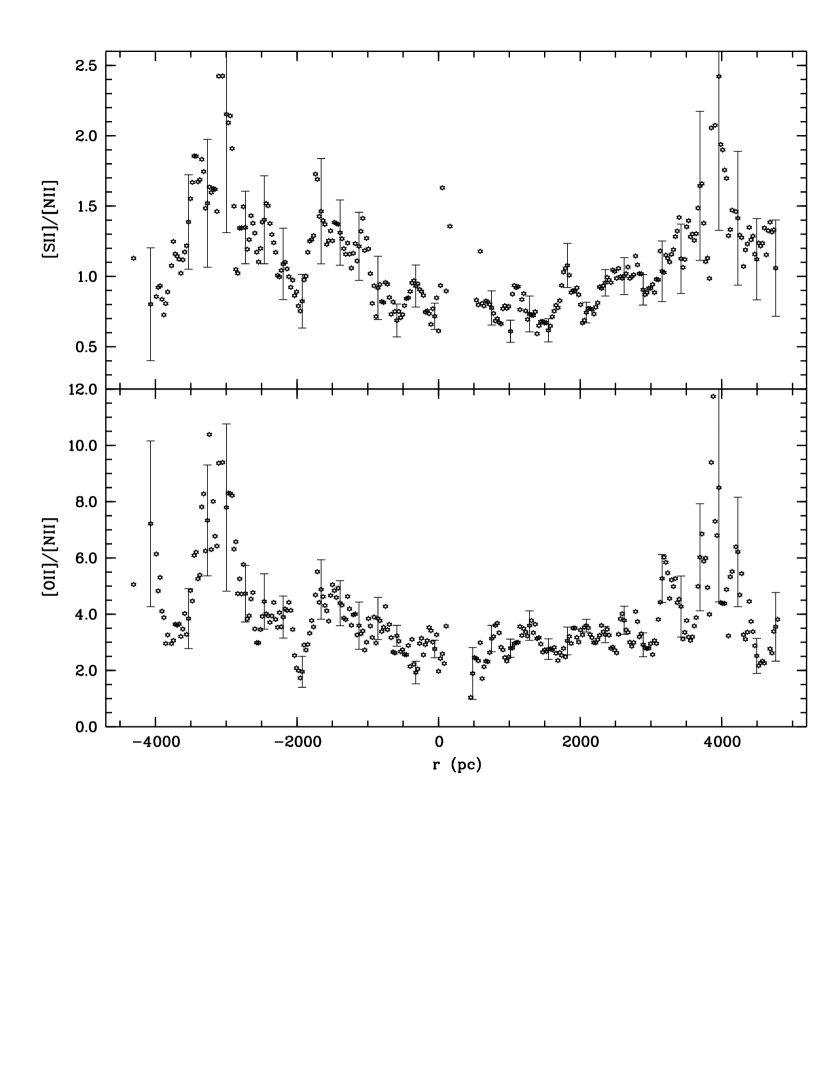
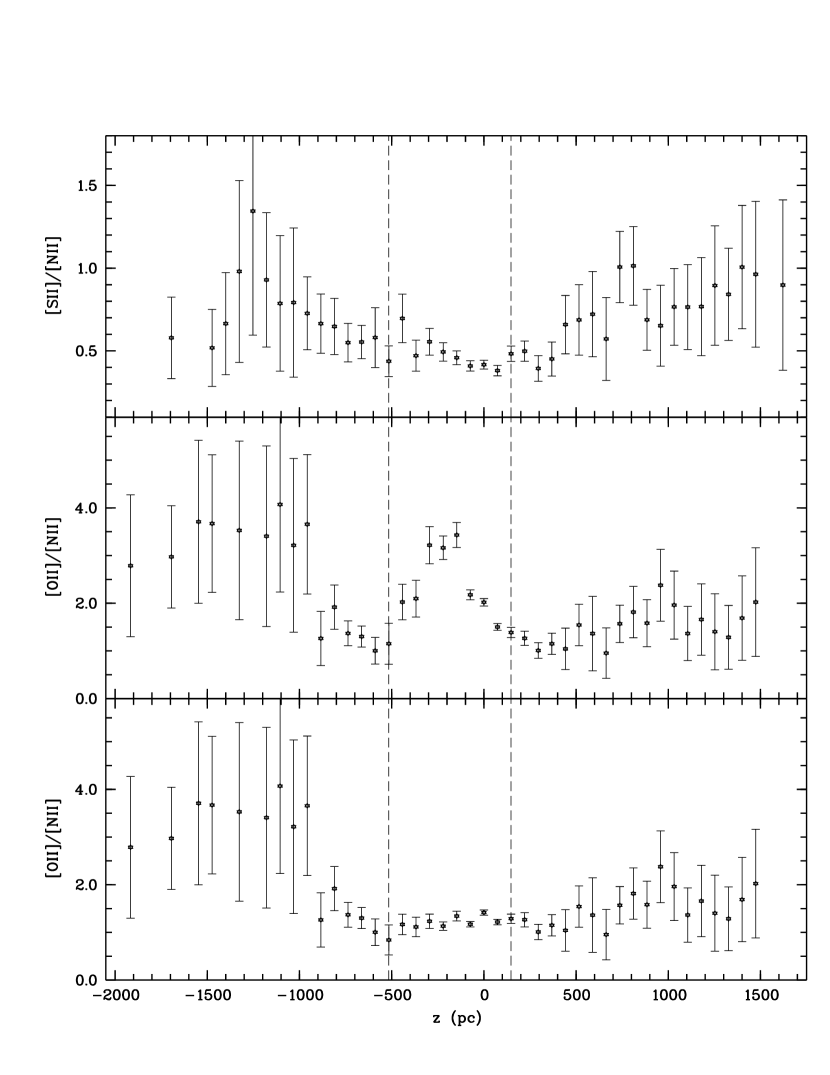
Pure photoionization models predict an increase in [S II]/[N II] with increasing . For example, an increase of in [S II]/[N II] in matter bounded models is correlated with an increase in [S II]/H from 0.2 to 0.5 (Rand, 1998) or even just from 0.2 to 0.3 (Domgörgen & Mathis, 1994). Most variations in [S II]/[N II] observed in our galaxies (including Paper I) appear to have lower gradients than those predicted by photoionization models. In Figures 20–25, we show the [S II]/[N II] and [O II]/[N II] line ratios for our five galaxies. The only disk slits in this paper are for NGC 4634 (catalog ) and NGC 5775 (catalog ). In NGC 4634 (catalog ), [S II]/[N II] increases with increasing distance from the midplane. While the gradient appears to become smaller at pc, the line ratio increases at first on the other side of the disk and then seems to decrease with at kpc. However, given the uncertainty in the data points, the [S II]/[N II] line ratio can also be constant on this side. Unfortunately, our analysis does not extend that far out into the halo due to the weak H line emission. It is not clear what causes these variations (if they are real) or whether these changes are small scale variations similar to those observed in the other slit positions. From the disk slits of NGC 3079 (catalog ), NGC 4631 (catalog ), and NGC 891 (catalog ) (Paper I) we know that [S II]/[N II] likely has a minimum near the midplane, but becomes almost constant with small scale variations at higher . In NGC 5775 (catalog ), [S II]/[N II] increases with increasing distance from the disk up to about kpc, where it starts to decrease again. Both groups TDSUR and CR observed strong variations in [S II]/[N II] with widths of up to 2 kpc and heights of up to 0.5. It is therefore impossible to judge whether the decrease beyond kpc is part of a local minimum, although the overall trend in TDSUR’s measurements is an increase with near the midplane and a slight overall decrease with beyond kpc. Our analysis extends up to kpc. Due to the uncertainty of the extinction correction, it is not clear whether a decrease in nitrogen abundance or an increase in the sulfur ionization fraction causes the initial increase of [S II]/[N II] on this side of the disk. The data points on the other side () are too sparse to reveal any trends.
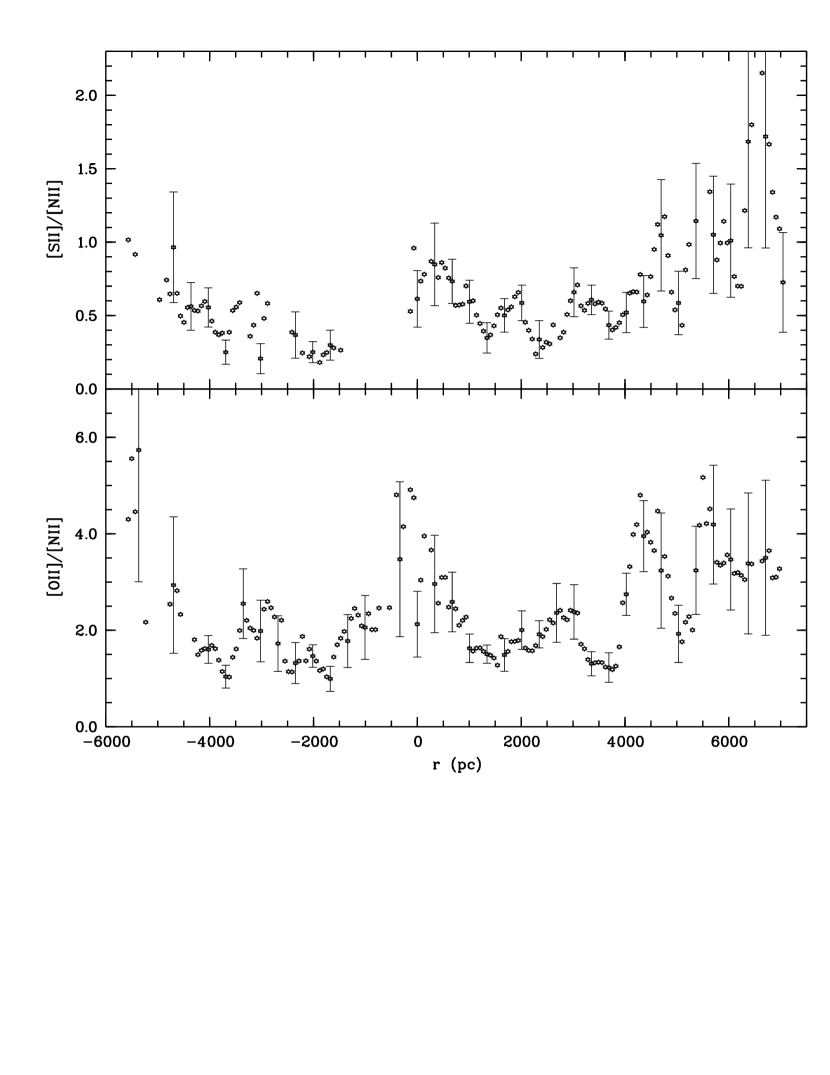
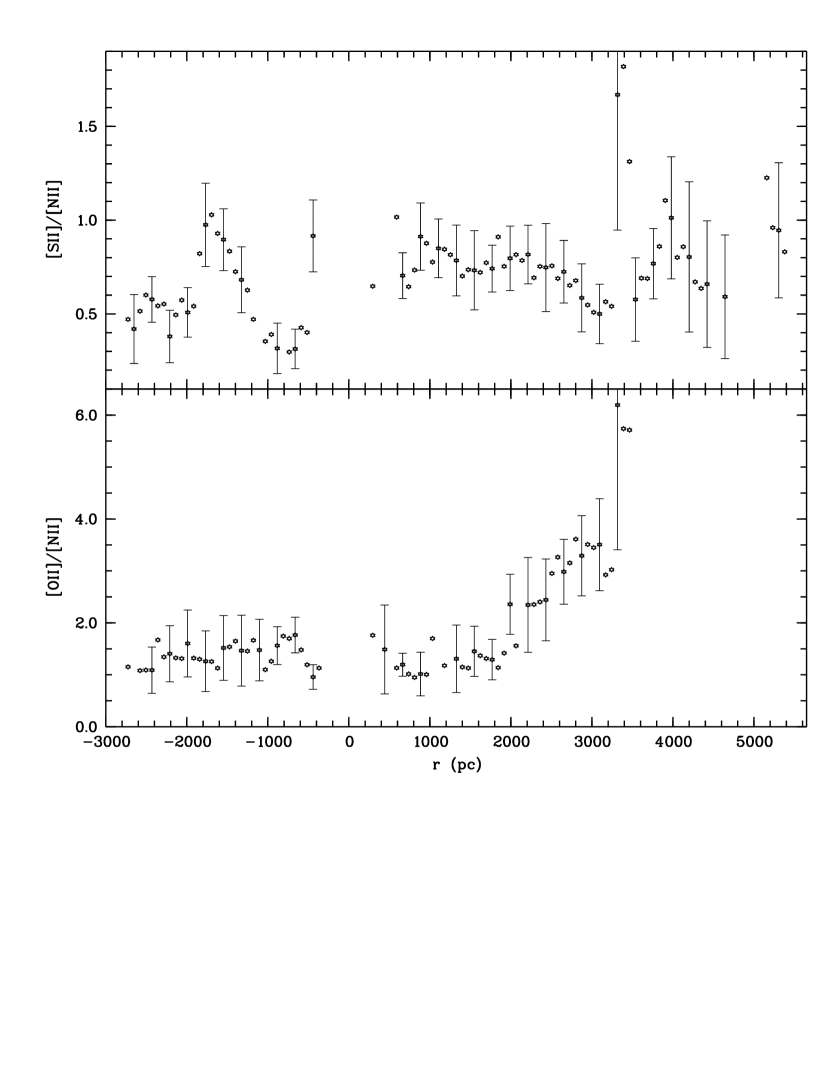
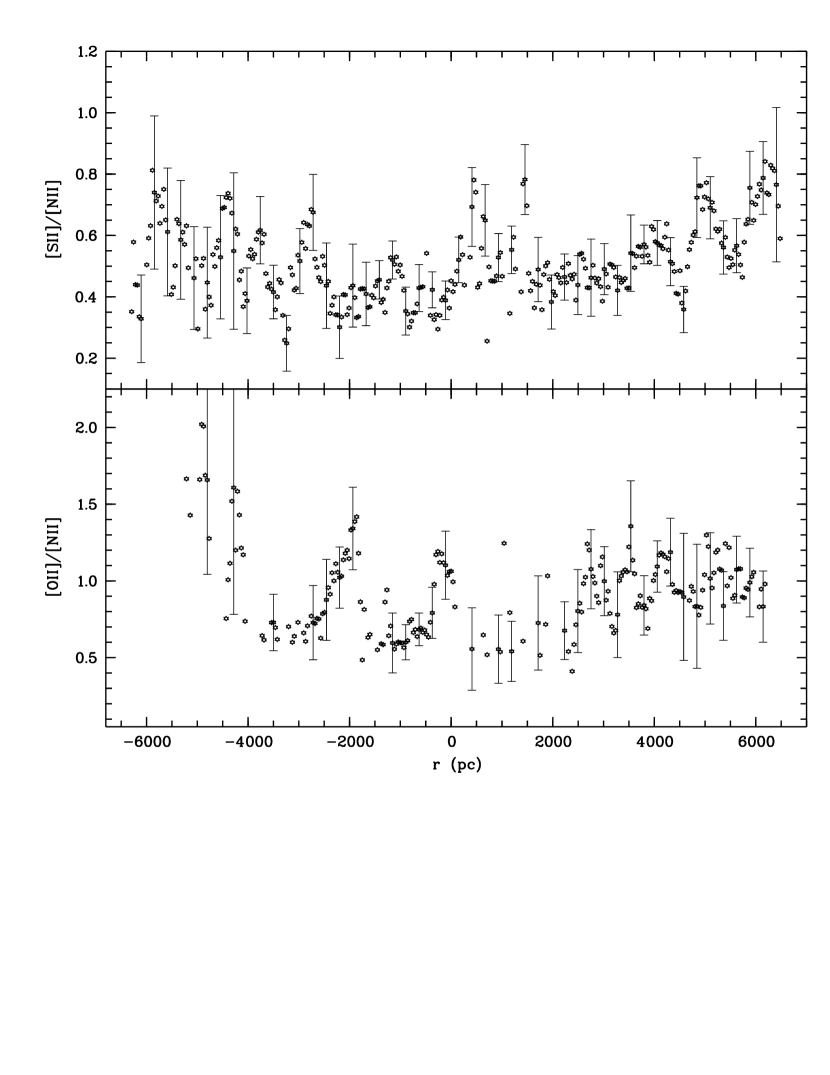
The slits parallel to the galactic disks in our sample show a relatively clear trend in the [S II]/[N II] line ratio. In three of the four DIG slits (NGC 3079 (catalog ), NGC 4631 (catalog ), NGC 891 (catalog )), [S II]/[N II] increases with increasing radial distance from the galactic center (although the line ratio decreases again in NGC 4631 (catalog ) at kpc, and the increase in NGC 891 (catalog ) at is less obvious due to the larger uncertainties). According to our analysis in section 3, this increase appears to be dominated by a radial decrease in nitrogen abundance in these galaxies. However, it is possible that variations in N+/N also play a role and thus weaken the influence of the nitrogen abundance as mentioned earlier. Only in NGC 4634 (catalog ), [S II]/[N II] stays more or less constant with several smaller scale variations along the disk. Unfortunately, we were not able to apply our analysis method to this slit position.
The behavior of the observed [O II]/[N II] line ratios varies between slit positions. In the two disk slits, [O II]/[N II] seems to increase with at first and then either levels off or undergoes small scale variations. In the DIG slits of NGC 3079 (catalog ) and NGC 4631 (catalog ), [O II]/[N II] follows the increases in the [S II]/[N II] line ratio confirming that the decreasing nitrogen abundance is the cause for the observed increases in the DIG slits. This correlation might also exist in NGC 891 (catalog ), but is not obvious due to the larger uncertainties. However, the [O II]/[N II] line ratio parallel to the disk of NGC 4634 (catalog ) stays constant on one side (), but increases with on the other side (), where [S II]/[N II] stays constant. Our data are insufficient to explain this behavior. According to our analysis, the general behavior of [O II]/[N II] can be explained by a combination of electron temperature and nitrogen abundance. Little to no correlation can be found between variations in [O II]/[N II] and changes in the oxygen ionization fraction. The behavior of the line ratios [S II]/[N II] and [O II]/[N II] in our small sample of galaxies (including the slit positions in Paper I) rule out pure photoionization as source for the observed line ratio variations.
In all our galaxies, the derived electron temperature increases with in the disk slits perpendicular to the midplane and stays more or less constant with increasing on a large scale in the DIG slits parallel to the midplane (exception: increase in at kpc in NGC 4631 (catalog )). The small scale variations in temperature derived from the model fits of the DIG slits tend to be smaller than the vertical trends seen in the disk slits. Hence, these vertical trends are influenced, but not dominated by possible small scale structures. We observed the same behavior, i.e. increasing with increasing , in the disk slits of NGC 891 (catalog ), NGC 4631 (catalog ), and NGC 3079 (catalog ) (Paper I). Pure photoionization models always require a decreasing ionization parameter with increasing height from the midplane to obtain increasing line ratios of singly ionized species (Domgörgen & Mathis, 1994). The decreasing ionization parameter also causes a decrease in O++/O and an increase in S+/S with increasing (Sembach et al., 2000). An increasing electron temperature towards the halo appears to require an additional heating mechanism. If a harder source of ionization caused the observed increasing temperatures towards the halo, O++/O would have to increase as well. This does not seem to be so in NGC 3079 (catalog ) or NGC 4634 (catalog ), but may be the case in NGC 4631 (catalog ) or NGC 891 (catalog ) (Paper I). However, with a harder source of ionization, S+/S decreases, as more sulfur becomes doubly ionized. Our data, including Paper I, do not yield a coherent picture regarding both ionization fractions (O++/O and S+/S) and the electron temperature, if a harder spectrum is assumed to be the cause for the increase in electron temperature.
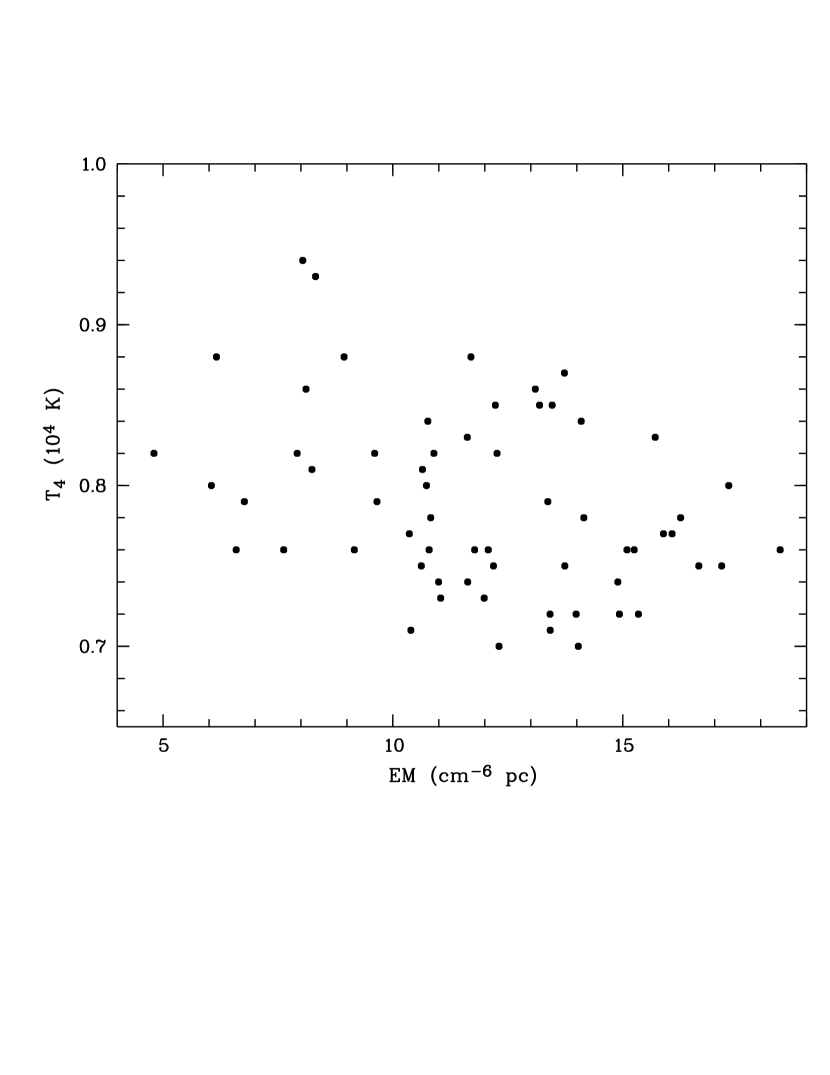
It has been suggested that increases in temperature may be associated not only with increases in , but more generally with decreases in density (Reynolds et al., 1999). Slits perpendicular to the disk might probe processes associated with height from the midplane causing an increase in temperature with that is not related to decreases in density. However, slits parallel to the midplane eliminate this ambiguity and thus allow us to analyze whether changes in temperature and variations in density are directly related. The intensity of the H emission line is proportional to and the emission measure EM, which depends on the product of and the pathlength . Figure 26 shows a versus plot for NGC 3079 (catalog ) (DIG slit). Since temperatures close to the maximum allowed temperature yielded the best predictions according to our analysis in section 3, only the maximum allowed temperature is used in the plot. Despite the large scatter of the data points, a correlation between electron temperature and the emission measure can be seen. The temperature increases with decreasing emission measure. One does not expect the pathlength to change significantly along most part of a parallel slit. It is also difficult to imagine a mechanism that would relate the pathlength of the emitting gas to the temperature. Thus, it is reasonable to assume that changes in EM are caused by changes in density, more precisely by variations in , and hence increasing temperature is associated with decreasing density.
We found the same correlation in all our slits (DIG as well as disk slits). The minimum allowed temperature stays more or less constant with decreasing intensity in the DIG slits and increases in the disk slits. However, the minimum allowed temperature did not produce good emission line predictions in our analysis and therefore does not seem to represent the real temperature as well as the maximum allowed temperature. The fact that in general the line ratio predictions for the maximum allowed temperature match the observed line ratios better than the predictions using minimum allowed temperature can be explained at least partially by the extinction correction. Since we overcorrected for extinction, the [O II] emission became too strong which then required higher temperatures. However, it is not clear whether other circumstances factor into this behavior as well.
More correlations and anti–correlations might exist among the derived quantities containing additional information on the processes in the DIG. While most of these (anti–)correlations would be the result of (anti–)correlations among the observed emission line ratios, some may be due to problems with the model or the data. We have not yet examined the possible (anti–)correlations among the other derived quantities, as our goal in this paper was to analyze trends in the electron temperature with regard to the emission line ratios.
5 CONCLUSIONS
We observed five nearly edge–on galaxies to examine variations in their emission line ratios. The forbidden line intensities relative to H are higher in regions of lower line emission. Since this behavior has been observed in other galaxies as well covering a range of types and properties, this trend seems to be associated with the gas itself rather than with peculiar situations within a given galaxy. In most cases the observed variations in the line ratios are consistent with systematic changes in electron temperature within the ionized gas and with normal radial chemical abundance gradients. In particular, the electron temperature seems to increase with increasing distance from the midplane of the galaxies. The derived values for electron temperature, ionization fractions, and nitrogen abundance rule out pure photoionization as the explanation for the observed line ratios and suggest that the increase in electron temperature with increasing is not necessarily caused by an additional source of ionization, but by an additional heating mechanism which does not ionize the diffuse gas (see Haffner et al. 1999 and references therein). Moreover, our derived temperature variations along the slits seem to be correlated with variations in density, with regions of lower density having higher temperatures.
A definitive measurement of the electron temperature in the eDIG would provide a critical test of our model. Detection of increasing electron temperatures at low densities would establish that eDIG emission partially results from the operation of heating sources other than photoionization in the gaseous halos of galaxies. Given the low intensities of eDIG optical emission lines, such direct measurements are extremely difficult, but may be feasible through emission line velocity width measurements in the Milky Way (e.g. Reynolds 1985).
We also conclude that it is important to gain a better understanding of the extinction in galaxies, as the applied extinction correction seems to overcorrect the blue emission lines and can significantly change the values of derived abundances, ionization fractions and the electron temperature. One possibility would be to obtain spectra of sufficient signal–to–noise to be able to measure the Balmer lines H and H (which were visible in two or three of our galaxies) and to derive the galactic extinction from these Balmer decrements.
References
- Collins & Rand (2001) Collins, J. A., Rand, R. J. 2001, ApJ 551, 57 (CR)
- Collins et al. (2000) Collins, J. A., Rand, R. J., Duric, N., Walterbos, R. A. M. 2000, ApJ 536, 645
- Däppen (2000) Däppen, W. 2000, in Allen’s Astrophysical Quantities, ed. A. N. Cox (New York: Springer), 27
- Domgörgen & Dettmar (1997) Domgörgen, H., Dettmar, R.–J. 1997, A&A 322, 391
- Domgörgen & Mathis (1994) Domgörgen, H., Mathis, J. S. 1994, ApJ 428, 647
- Ferguson et al. (1996) Ferguson, A. M. N., Wyse, R. F. G., Gallagher, J. S. 1996, AJ 112, 2567
- Haffner et al. (1999) Haffner, L. M., Reynolds, R. J., Tufte, S. L. 1999, ApJ 523, 223
- Mathis (2000) Mathis, J. S. 2000, in Allen’s Astrophysical Quantities, ed. A. N. Cox (New York: Springer), 523
- Martin (1997) Martin, C. L. 1997, ApJ 491, 561
- Martin & Kern (2001) Martin, C., Kern, B. 2001, ApJ 555, 258
- Osterbrock (1989) Osterbrock, D. E. 1989, Astrophysics of Gaseous Nebulae and Active Galactic Nuclei (Mill Valley: University Science Books)
- Otte & Dettmar (1999) Otte, B., Dettmar, R.–J. 1999, A&A 343, 705
- Otte et al. (2001) Otte, B., Reynolds, R. J., Gallagher, J. S., Ferguson, A. M. N. 2001, ApJ 560, 207 (Paper I)
- Rand (1998) Rand, R. J. 1998, ApJ 501, 137
- Reynolds (1985) Reynolds, R. J. 1985, ApJ, 294, 256
- Reynolds et al. (1999) Reynolds, R. J., Haffner, L. M., Tufte, S. L. 1999, ApJ 525L, 21
- Sembach et al. (2000) Sembach, K. R., Howk, J. C., Ryans, R. S. I., Keenan, F. P. 2000, ApJ 528, 310
- Tüllmann & Dettmar (2000) Tüllmann, R., Dettmar, R.–J. 2000, A&A 362, 119
- Tüllmann et al. (2000) Tüllmann, R., Dettmar, R.–J., Soida, M., Urbanik, M., Rossa, J. 2000, A&A 364L, 36 (TDSUR)