Dwarf Nova Oscillations and Quasi-Periodic Oscillations in Cataclysmic Variables: I. Observations of VW Hyi
Abstract
From archived and recent high speed photometry of VW Hyi we find Dwarf Nova Oscillations (DNOs) occasionally present throughout outburst, evolving from 14.06 s period at maximum to 40 s near the end of outburst. A relatively slow increase of period is followed by rapid increase and subsequent decrease.
Quasi-periodic Oscillations (QPOs) are seen at periods of hundreds of seconds. For the first time, an evolution of QPO period is seen, steadily increasing during the final decline of an outburst. The occasional presence of two DNOs, separated in frequency by the QPO frequency, suggests reprocessing of the rotating DNO beam by a ‘wall’ rotating progradely in the disc at the QPO period.
keywords:
accretion, accretion discs – novae, cataclysmic variables – stars: oscillations – stars: individual: VW Hyi1 Introduction
Dwarf nova oscillations (DNOs) were first discovered in outbursts of the dwarf novae CN Ori and Z Cam, and in the nova-like variable UX UMa (Warner & Robinson 1972). They have since been observed in about 15 dwarf novae and 4 nova-likes (see Table 8.2 of Warner 1995a). The DNOs are low amplitude, moderately coherent luminosity variations with periods in the range of 5–40 s. In the same kinds of cataclysmic variable (CV) stars there are also occasionally luminosity modulations of longer period (50–1000 s) and poor coherence, known as quasi-period oscillations (QPOs), first discussed by Patterson, Robinson & Nather (1977).
A variety of statistical analyses and physical models have been produced for the DNOs and QPOs (see review by Warner 1995a), but no generally accepted model yet exists. Although there has been significant progress, at least in restricting possible models, by observations made in the far ultraviolet, it is still the case that further informative observations are to be encouraged. Here we present new and archival observations of VW Hyi, and discuss their implications. But first, in Sections 2 and 3, we review the status quo of observations and interpretations of DNOs and QPOs. In Section 4 we present and analyse the observations of VW Hyi. In a subsequent paper (Warner & Woudt 2002, hereafter Paper II), we develop a model to explain these observations, and apply it to other systems.
2 DNO Phenomenology
In the optical, DNOs are low amplitude, usually sinusoidal modulations in brightness of moderate stability (‘Q’ factors = of 104–106). Although not present in all dwarf nova outbursts, when they are observable they usually appear about midway up the rising branch of outburst and disappear at a comparable brightness on the descending branch. Their coherence is maximal at the brightest phase of outburst; on the descending branch they become less coherent and difficult to detect above the noise in the Fourier transforms.
There is a very strong correlation between oscillation period and system brightness (Warner & Robinson 1972), such that passes through a minimum about one day after visual maximum, which is when the EUV luminosity reaches maximum (Mauche 1996a,b). At this time, the rate of mass transfer in the inner disc (and onto the white dwarf primary) reaches its maximum (Cannizzo 1993). Both the short periods of the DNOs and their correlation with in the inner disc show that they have their origin near the surface of the primary (Warner 1995b).
The amplitude and phase changes of the optical DNOs observed during eclipses show that in the optical the entire disc is in some manner involved. This is interpreted as implying that modulated high energy radiation from the central regions of the disc is reprocessed by the whole disc. The phase variations can be understood only by an anisotropic radiation pattern revolving at the period of the DNOs (Warner 1987); this limits physical models to bright regions revolving on the surface of the primary or in the inner disc.
Optical DNOs in some nova-like variables are intermittently present (e.g. in UX UMa, HL Aqr, V3885 Sgr), with periods that wander slowly over ranges of a few seconds (Warner & Nather 1972; Knigge et al. 1998). DNOs are, however, not ubiquitous: despite intensive observation none have been detected in RW Sex, nor in some other less well-observed nova-likes.
DNOs have been observed in the soft X-ray region of SS Cyg, VW Hyi, SU UMa and HT Cas during outbursts (see Warner 1995a for references; and van Teeseling 1997), in the EUV of SS Cyg (Mauche 1996a,b, 1998) and in the UV of UX UMa and OY Car with the use of HST (Knigge et al. 1998; Marsh & Horne 1998). In general the oscillations are monoperiodic and sinusoidal; recently noted exceptions are OY Car where two periodicities are observed, one of which has a strong harmonic (Marsh & Horne 1998), SS Cyg where a low amplitude first harmonic is seen (Mauche 1997) and V2051 Oph where two periods and a harmonic are seen (Steeghs et al. 2001). At times, the soft X-ray modulations can be as large as 100%.
The temporal behaviour of DNOs, as observed both in optical and X-rays, has features which constrict possible models. In dwarf nova outbursts, superposed on the luminosity-related systematic changes in are intervals of 1–2 h during which a constant period (with some phase noise) exists, followed by an abrupt change to another stable period. This behaviour is well illustrated in Fig. 13 of Warner, O’Donoghue & Wargau (1989), Fig. 6 of Cordova et al. (1980) and Fig. 11 of Jones & Watson (1992). As pointed out by Warner (1995b), these abrupt changes (occurring within 100 s) are not accompanied by any noticeable increase or decrease of luminosity and therefore cannot be ascribed to a change in rotation period of any substantial ( M⊙) mass. The SS Cyg X-ray observations show jumps of up to 0.07 s (Jones & Watson 1992); those of VW Hyi showed changing abruptly from 14.34 to 14.26 s (van der Woerd et al. 1987); the abrupt changes of the 25 s oscillations in TY PsA near outburst maximum are of 0.15 s relative to the slow secular change in (Warner et al. 1989). DNOs alternating between 11.58 and 11.66 s have been seen in RU Peg in outburst (Patterson et al. 1977).
Marsh & Horne (1998) have found DNOs in OY Car towards the end of a superoutburst. Their HST observations show two periods near 18 s simultaneously present in the UV with a separation of 0.22 s. Although a rare occurrence, such pairs of periodicities have been seen before in optical DNOs. We note in particular that periods of 29.08 and 30.15 s were found in the nova-like V3885 Sgr (Hesser, Lasker & Osmer 1974), but the former is normally the only (if any) period present (Warner 1973); evidence for 26.42 and 26.73 s oscillations simultaneously present in KT Per during outburst is given by Robinson (1973); and the dwarf nova WZ Sge in quiesence shows 27.87 and 28.97 s periodicities, sometimes together and at other times separately (Robinson, Nather & Patterson 1978). Recently Steeghs et al. (2001) found 59.54 s, 29.77 s and 28.06 s oscillations in the optical continuum of V2051 Oph on the decline from a normal outburst.
There is no clear evidence for the presence of more than two periodicities at a given time: some early claims (Warner & Robinson 1972) were later shown to be due to interference effects in the periodograms of signals with systematically changing periods (Warner & Brickhill 1978).
Finally, we note the perplexing optical behaviour of VW Hyi near the end of its outbursts where in one instance a 30 s DNO was observed to be modulated in amplitude by a QPO at a period of 413 s (Warner & Brickhill 1978) and on another occasion a 23.6 s DNO was modulated at 253 s (Robinson & Warner 1984). This cannot be simply a beat phenomenon between DNO periods separated by 2.2 s because the average (background) brightness is also modulated at the longer QPO period. This will become clearer below when we present the latest observations of VW Hyi.
3 QPO Phenomenology
QPOs in cataclysmic variables (see the compilation in Table 8.2 of Warner 1995a) can have a life of their own, independent of the DNOs. For example, QPOs with periods of 75 s and 150 s have been observed in U Gem (Robinson & Nather 1979) for which no optical DNOs have ever been detected. DNOs and QPOs are sometimes present at different times in the same outburst, e.g. TY PsA (Warner et al. 1989). However, the amplitude modulation of the DNOs in VW Hyi at the QPO period shows that some interaction between the two processes can occur.

The QPO amplitudes are usually only a few 0.01 mag, but larger ranges have occasionally been seen. For example, the 413 s QPO in VW Hyi in its November 1974 outburst had a range of up to 0.12 mag (Warner & Brickhill 1978). Similarly large QPOs with a period of 370 s have been observed in SW UMa (Kato, Hirata & Mineshige 1992); these comprise a nearly sinusoidal variation of range 0.075 mag with an additional narrow dip of depth 0.05 mag. The superoutburst of T Crv in February 2001 also showed QPOs, with period 600 s and range 0.1 mag (VSNET 21 Feb 2001). We show below some QPOs in VW Hyi in which individual oscillations have a range of 0.4 mag.
The QPOs generally have average periods of 5 to 15 times the DNO periods in those stars where they occur simultaneously. This statement becomes more strongly based if it is noted that many of the shorter period ( s) QPOs (Table 8.2 of Warner 1995a) should probably be reclassified as DNOs of low coherence.
Although QPOs are seen to change in (mean) period in a given object, unlike the DNOs no clear period-luminosity relationship has yet been deduced. Our new observations of VW Hyi provide the first evidence for such a relationship.
QPOs are rarely visible at high energies: four distinct possibilities are of 12% amplitude at 585 s in U Gem (Cordova & Mason 1984), of very low amplitude at 83 s in SS Cyg (Mauche 1997), of 2240 s in OY Car just after an outburst (Ramsay et al. 2001) and a modulation increasing in period from 63 s to 68 s and in amplitude from 14% to 21% in VW Hyi (van der Woerd et al. 1987). Wheatley et al. (1996) observed flux variations of large amplitude and time scale 500 s in Ginga (2-10 keV) X-ray observations of VW Hyi made at the end of outburst. As this is the place in the light curve where we see optical QPOs in VW Hyi, it is extremely probable that the X-ray observations are a different manifestation of the same phenomenon. We return to this later. Other possible X-ray QPOs are 290 s in AB Dra on the rise to outburst, 121 and 135 s in U Gem at quiescence and 254 s in the nova-like RW Sex (Cordova & Mason 1984).
It is possible that there is more than one cause for the QPOs. For example, it has been noted that the longest QPOs have periods close to the expected rotation periods at the outer edges of the accretion discs in CVs (Warner 1995a), and Lasota, Kuulkers & Charles (1999) have suggested a model for one of the DNOs in WZ Sge which uses a plasma blob at the disc rim. Nevertheless, it is also possible that all QPOs are caused by oscillations in the inner accretion disc. Perturbation analyses of such discs by Carroll et al. (1985), Lubow & Pringle (1993), and Collins, Helfer & van Horn (2000) show the possibility of a wide spectrum of non-radial oscillations, analogous to p-mode and g-mode oscillations in stars. The brightness oscillations are usually ascribed to intrinsic luminosity variations in the disc itself, but we point out in Paper II that they may also be caused by variation of intercepted radiation from the central high luminosity region of the disc, if there are vertical oscillations in thickness of some disc annuli.
4 Photometric Observations of VW Hyi
The dwarf nova VW Hyi is a rich source of short period luminosity modulations. It is the CV in which DNOs were first directly observable in the light curve (Warner & Harwood 1973) (rather than only in the Fourier transform). Unlike most dwarf novae, the optical DNOs in VW Hyi appear most conspicuously in the final stage of decline from an outburst (they could be present at a similar brightness at the start of an outburst, but no high time resolution photometry has been made that early) and follow a period-luminosity correlation over the range 20–36 s (Warner & Brickhill 1974, 1978; Robinson & Warner 1984; Haefner, Schoembs & Vogt 1979; Schoembs & Vogt 1980).
4.1 Evolution of DNOs and QPOs in VW Hyi
At the end of the November 1974 normal outburst and of the January 1978 normal outburst the QPO modulated DNOs already mentioned above were observed (Warner & Brickhill 1978, hereafter WB; Robinson & Warner 1984, hereafter RW). This behaviour has remained unique to VW Hyi, and is clearly of potential value in understanding both QPOs and DNOs. We now report a third and even more significant observation of this phenomenon, which has led us to reanalyse other observations made over the past three decades.
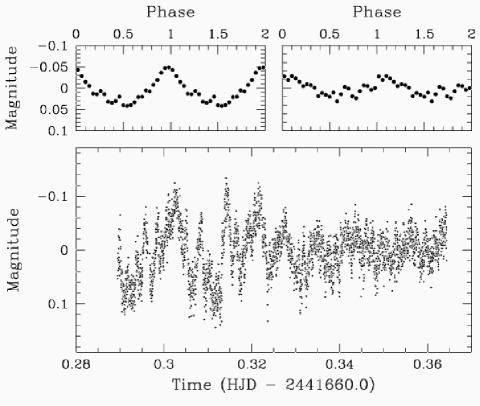
VW Hyi was observed on 5 February 2000 with the University of Cape Town CCD photometer attached to the 40 inch reflector at the Sutherland site of the South African Astronomical Observatory. 3 s integrations in white light were used, with a run length of 5h 16m, starting at 18h 40m UT. A low time resolution light curve, corrected for atmospheric extinction, is shown in Fig. 1. VW Hyi was in the final stages of decline from a normal outburst which had commenced on 3 February 2000. It was quickly apparent that in the light curve VW Hyi had DNOs with a period of 28 s (see the inset of Fig. 1) and that these were partly modulated in amplitude with a period near 450 s, thus producing only the third clear example of such behaviour to be captured in nearly thirty years of sporadic photometry.
The general form of the light curve is shown in Fig. 1 and is typical of the final decay phase of a dwarf nova outburst. There was a fall of 0.45 mag during the run; the prominent large humps are the orbital modulation (arising from differing aspects of a bright spot) beginning to be seen against the fading background of the disc. A light curve of one orbit duration obtained on the following night has a hump of approximately the same amplitude (on an intensity scale) as in Fig. 1, showing that there were no large changes in mass transfer rate from the secondary in the late stages of this normal outburst. Eliminating the orbital humps, VW Hyi was fading at 0.09 mag h-1 on our photometric system.
Also prominent in Fig. 1 are modulations with a time scale 7 min which are present throughout, riding happily over the orbital humps and maintaining a peak-to-peak range of 0.10 mag. These represent an approximately constant modulated fraction of the declining luminosity (if Fig. 1 is plotted on an intensity scale the 7 min modulation increases in amplitude by a factor of 2 through the run).
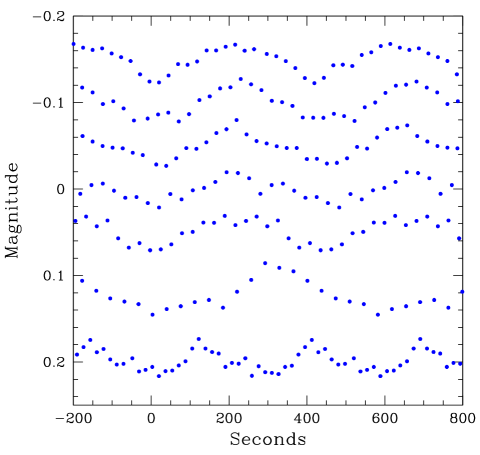
To illustrate more clearly the 7 min modulation, which is an example of a QPO, in Fig. 2 we have removed the mean, first order trend and orbital hump (represented by a sine wave and first harmonic at the orbital period) from the light curve and have plotted mean brightnesses averaged over 10 integration bins (i.e. 30 s), which concomitantly smooths over the 30 s DNOs described below. Fourier analysis of contiguous sections of the light curve shows that the mean period of the QPOs increases from 400 s to 600 s during the run. This variation is displayed in Fig. 3, and is the first clear example of a systematic dependence of QPO period on luminosity. However, the QPO period of the final section is omitted because it has halved. The average pulse shapes are shown in Fig. 4. In the penultimate section some first harmonic is visible; in the final section it has become almost entirely first harmonic.
In two of the three previously published studies of VW Hyi at the late phase of its outbursts (the November 1974 outburst: WB, and the January 1978 outburst: RW) the mean brightness (interpolated under the orbital humps) was nearly constant and the QPO periods averaged 413 s and 253 s respectively with no detectable systematic variations during the runs (which had durations of 4.91 h and 3.60 h respectively). The background-subtracted and binned light curves, showing the QPOs, are incorporated into Fig. 2. The mean amplitudes (half peak-to-peak) of the QPOs in those runs were 0.03 mag and 0.02 mag respectively. In our observations of the February 2000 outburst the mean amplitude is 0.02 mag. In all three cases individual cycles can have amplitudes from nearly zero to two or three times the average.
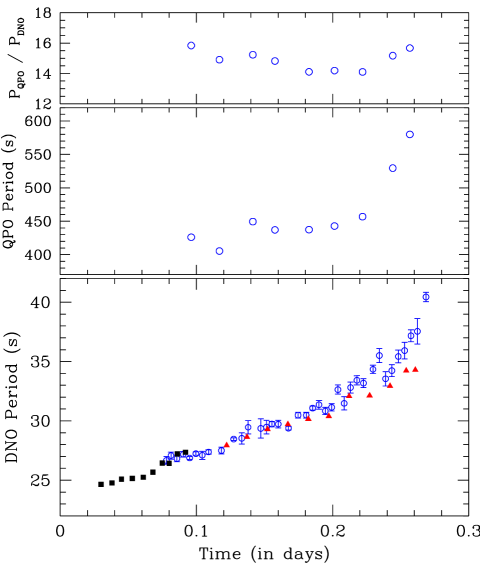
A third study (Warner & Brickhill 1974) was of VW Hyi at the end of a superoutburst and showed DNOs rapidly increasing in period. We have reanalysed the run and have incorporated the DNO evolution in Fig. 3. We also find low amplitude QPOs, not recognised in the earlier study. After the superoutburst the DNOs lengthen in period more slowly than after the normal outburst. The ratio of periods is nearly constant at in both runs.
4.2 DNOs and QPOs in VW Hyi: the overall picture

Stimulated by the newly recognised evolution of the DNOs and QPOs we decided to reinvestigate our archive of VW Hyi observations and to make new observations. In order to place each run in its respective position in the outburst we constructed a grand mean light curve. It has long been known that the decay parts of normal outbursts of a dwarf nova are very similar to each other (e.g. Bailey 1975), and alignments of superoutbursts of VW Hyi according to the final rise to supermaximum result in nearly identical outburst profiles (Marino & Walker 1979). Because we are interested here largely in the decay portion only, we have aligned these using a data file for the years 1969 – 2000 kindly made available by the Royal Astronomical Society of New Zealand. In performing this analysis we found that normal and superoutburst declines closely follow the same profile. We also found, incidentally, that the normal outbursts can be classified into three discrete groups, of different durations. Smak (1985) found correlations of outburst widths with outburst intervals, but not that outburst widths show signs of preference for certain values.
Fig. 5 shows the final ‘template’ which we used to define where our individual runs are positioned. The principal portion of the decay is identical independent of the type of outburst. The profiles near maximum, and the final decays and brightnesses at quiescence, show small differences. The zero of the time scale is an arbitrarily chosen point.
| Run | Date | Outburst | Phase | Length | DNO | QPO | Remarks |
| Type | (days) | (hours) | |||||
| S0110 | 10 Dec 1972 | Super | –14.85 | 2.47 | No | No | Early rise to supermaximum, no DNOs . |
| S0111 | 10 Dec 1972 | Super | –14.77 | 0.97 | No | No | Rise to supermaximum, no DNOs . |
| S0112 | 10 Dec 1972 | Super | –14.67 | 2.31 | No | No | Final rise to supermaximum, no DNOs . |
| S2230 | 9 Dec 1975 | Super | –13.33 | 0.68 | No | — | No DNOs . |
| S2233 | 10 Dec 1975 | Super | –12.40 | 0.59 | No | — | No DNOs . |
| S3434 | 24 Oct 1984 | Super | –11.70 | 3 65 | No | No | At supermaximum, no DNOs . |
| S2241 | 11 Dec 1975 | Super | –11.34 | 2.63 | No | Yes? | No DNOs , some evidence for QPO |
| at 745 s towards the end of the run. | |||||||
| S3435 | 25 Oct 1984 | Super | –10.70 | 3.68 | No | — | No DNOs . |
| S2243 | 12 Dec 1975 | Super | –10.36 | 1.65 | No | Yes | Probable QPO at 425 s. No DNOs . |
| S3436 | 26 Oct 1984 | Super | –9.79 | 2.06 | Yes | No | DNO at 14.29 s () in first 50 min. |
| S0115 | 18 Dec 1972 | Super | –6.86 | 1.20 | No | No | No DNOs . |
| S3078 | 19 Dec 1982 | Super | –5.32 | 1.95 | Yes | No | Stable DNO at 14.06 s, ampl. . |
| S0480 | 30 Nov 1973 | Super | –5.19 | 1.73 | No | No | No DNOs . |
| S0118 | 20 Dec 1972 | Super | –4.86 | 1.93 | No | No | No DNOs . |
| S3437 | 31 Oct 1984 | Super | –4.62 | 2.90 | No | — | No DNOs . |
| S0120 | 21 Dec 1972 | Super | –3.87 | 2.03 | No | No | No DNOs . |
| S3692 | 8 Nov 1985 | Super | –3.81 | 0.36 | No | — | No DNOs . |
| S3693 | 8 Nov 1985 | Super | –3.80 | 0.29 | No | — | No DNOs . |
| S3438 | 1 Nov 1984 | Super | –3.75 | 1.94 | No | No | No DNOs . |
| S2911 | 25 Nov 1981 | Normal (L) | –2.71 | 3.14 | No | No | Final rise to normal maximum, no DNOs . |
| S2621 | 3 Jan 1978 | Normal (M) | –2.26 | 2.75 | No | No | Final rise to normal maximum, no DNOs . |
| S0122 | 23 Dec 1972 | Super | –1.82 | 2.56 | No | Yes | QPO at 410s in first half of the run (). |
| No DNOs . | |||||||
| S1277 | 31 Oct 1974 | Normal (?) | –1.77 | 1.78 | No | No | At normal maximum, no DNOs . |
| S1571 | 20 Dec 1974 | Super | –1.04 | 1.99 | No | Yes? | Start of fall from supermaximum plateau. Possible |
| QPO at 1151 s (). No DNOs . | |||||||
| S6183 | 15 Feb 2001 | Normal (L) | –0.94 | 1.68 | No | No | No DNOs . |
| S3703 | 11 Nov 1985 | Super | –0.83 | 1.04 | No | No | No DNOs . |
| S0124 | 24 Dec 1972 | Super | –0.79 | 1.84 | No | No | No DNOs . |
| S2914 | 27 Nov 1981 | Normal (L) | –0.73 | 0.52 | No | No | No DNOs . |
| S3410 | 22 Sep 1984 | Normal (M) | –0.58 | 0.51 | No | — | No DNOs . |
| S1307 | 2 Nov 1974 | Normal (M) | –0.3⋆ | 1.33 | Yes | Yes | QPOs at 185 s (). DNOs at 18.2 s, frequent |
| small period changes. Average , max. . | |||||||
| S0018 | 11 Sep 1972 | Normal (L) | –0.11 | 2.04 | Yes | No | DNOs lengthening (20.2 – 20.6 s, ampl. ). |
| S1594 | 21 Dec 1974 | Super | –0.05 | 2.77 | No | No | No DNOs . |
| S6184 | 16 Feb 2001 | Normal (L) | 0.06 | 1.68 | Yes | Yes | DNO evolution (24.6 27.4 s), see discussion in text. |
| S2915 | 28 Nov 1981 | Normal (L) | 0.10 | 0.73 | Yes | No | Average DNO at 21.3 s, short coherence (660 s). Range |
| in DNO period 20.6 – 22.4 s. | |||||||
| S0127 | 25 Dec 1972 | Super | 0.17 | 3.77 | Yes | Yes | DNO evolution (28 34 s), see discussion in text. |
| S6059 | 5 Feb 2000 | Normal (M) | 0.18 | 5.27 | Yes | Yes | DNO (27 40 s) / QPO evolution, see discussion in text. |
| S6138 | 19 Dec 2000 | Normal (M) | 0.54 | 7.63 | Yes | Yes | DNOs in range 25 – 34 s of short coherence (1260 s). |
| S3416 | 23 Sep 1984 | Normal (M) | 0.56 | 1.19 | Yes | Yes | DNOs in range 25 – 30 s of short coherence. Modulation |
| at QPO period of 300 s (see text). | |||||||
| S1322 | 3 Nov 1974 | Normal (M) | 0.7⋆ | 4.91 | Yes | Yes | DNOs in range 26 – 33 s. See WB. |
| S5248 | 6 Nov 1990 | Normal (M) | 0.76 | 4.66 | Yes | Yes | QPO at 2100 s + first and second harmonic, see text. |
| Occasional DNOs near 40 s of low coherence. | |||||||
| S2623 | 6 Jan 1978 | Normal (M) | 0.78 | 3.60 | Yes | Yes | DNOs in range 22 – 27 s. See RW. |
| S0484 | 6 Dec 1973 | Super | 0.79 | 3.91 | Yes | Yes | Strong QPO at 1326 s (), see Fig. 13. |
| DNOs in range of 29 – 38 s of short coherence, see text. | |||||||
| S0019 | 12 Sep 1972 | Normal (L) | 0.94 | 4.30 | Yes | Yes | Large amplitude QPOs at s (). |
| S1616 | 22 Dec 1974 | Super | 0.96 | 2.27 | No | No | No DNOs . |
| S0129 | 8 Jan 1973 | Normal (S) | 1.04 | 2.14 | No | No | No DNOs . |
| S6060 | 6 Feb 2000 | Normal (M) | 1.11 | 1.53 | No | No | No DNOs . |
| S0026 | 13 Sep 1972 | Normal (L) | 1.92 | 3.32 | No | Yes | QPOs at 1043 s (). |
| S0128 | 27 Dec 1972 | Super | 2.14 | 1.86 | No | No | No DNOs . |
| S3715 | 14 Nov 1985 | Super | 2.26 | 1.27 | Yes | Yes | DNOs at 24.7 s () and QPOs at 360 s |
| in last hour of run. | |||||||
| S2917 | 30 Nov 1981 | Normal (L) | 2.34 | 2.18 | No | No | No DNOs . |
| S0030 | 14 Sep 1972 | Normal (L) | 2.96 | 6.92 | No | Yes | Evidence for QPO behaviour, but of low coherence. |
| Several cycles at 1140 s (). |
| Run | Date | Outburst | Phase | Length | DNO | QPO | Remarks |
| Type | (days) | (hours) | |||||
| S0077 | 11 Oct 1972 | Quiescence | 4.11 | No | Yes? | Some evidence for occasional QPO at 935 s. | |
| No DNOs . | |||||||
| S0085 | 13 Oct 1972 | Quiescence | 1.67 | No | Yes? | Evidence for few cycles of QPO at 720 s. | |
| No DNOs . | |||||||
| S0093 | 14 Oct 1972 | Quiescence | 3.33 | No | ? | No DNOs . | |
| S0073 | 26 Nov 1972 | Quiescence | 2.83 | No | Yes? | Possible QPO at 260 s. No DNOs . | |
| S0102 | 5 Dec 1972 | Quiescence | 1.31 | No | Yes | QPO at 833 s + first harmonic. No DNOs . | |
| S0105 | 8 Dec 1972 | Quiescence | 1.80 | No | Yes | QPO near 600 s + first harmonic (). | |
| No DNOs . | |||||||
| S1414 | 2 Dec 1974 | Quiescence | 2.89 | No | Yes? | Evidence for QPO of short coherence at 980 s. | |
| No DNOs . |
Our relative magnitudes taken from photoelectric photometry have been used to determine the phase of our observations on these dates with respect to the outburst template. This outburst was sparsely sampled by the observers who reported to the RASNZ.
4.2.1 The DNOs
In the process of analysing the runs we discovered previously overlooked features. Table 1 lists the runs which had significant results – including absence of DNOs (our upper limit on the DNO amplitude corresponds approximately to 3 significance) during outburst. We have omitted many of the runs made during quiescence which showed neither DNOs nor QPOs.

The first notable result is the presence of a DNO with period 14.06 s in the run made on 19 December 1982, on the plateau of a superoutburst at V 9.5, 9 days after the rise to maximum. Interestingly, it is at precisely the same period as that seen in the soft X-rays at V = 9.4 in the November 1983 superoutburst of VW Hyi (van der Woerd et al. 1987), which will be discussed in Section 3 of Paper II. Schoembs & Vogt (1980) found a 33.9 s DNO in the superoutburst of VW Hyi of 27 October 1978, also at V 9.5. This perplexed us at first, until we noticed that their time resolution was 10 s, which would place a 14 s period above the Nyquist frequency – but the beat period between 10 s and 33.9 s is 14.18 s, so there evidently was a 14.18 s DNO which appeared as a beat at considerably reduced amplitude. We also found a DNO at 14.29 s present for a short time in the superoutburst of 26 October 1984. The optical and X-ray coverage of VW Hyi has been quite extensive, so we conclude that these very stable 14 s DNOs are rare and of short duration.
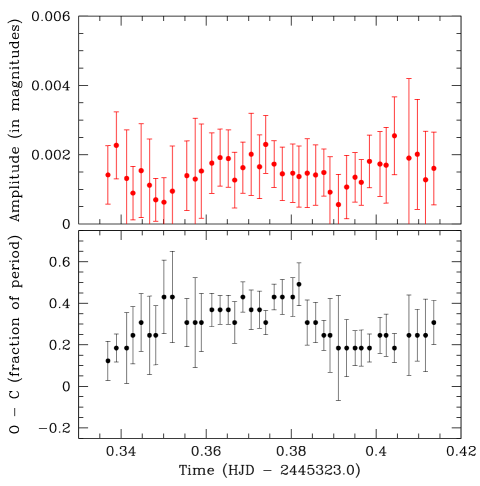
Our Fourier transform for 19 December 1982 is shown in Fig. 6, in which the spike at 14.06 s is very narrow, denoting a stable period over the 2 h run. There is no significant power at the subharmonic or the first harmonic. In Fig. 7 we show O–C and amplitude variations, relative to a constant period of 14.06 s. Although there are slow variations in phase, these are limited in range and show none of the sudden jumps in period discussed below. This is the most stable DNO that we have observed in VW Hyi. The amplitude (0.001 mag) is very low and would not be detected if the signal were much less stable. It is possible, therefore, that 14 s modulation is commonly present at maximum light but not detectable with common Fourier techniques.
There is a suggestion of sinusoidal variation of O–C in Fig. 7 with a period near the orbital period. The phasing relative to the position of the white dwarf in its orbit is in rough agreement with what might be expected of a light travel time effect, but the expected O–C range of , where is the mass ratio, is only 0.032 P, whereas we see a range of 0.2 P. The O–C variations must therefore be ascribed to small intrinsic variations in DNO period over the 2 h run.
We also found three other examples of DNOs at periods (18 – 22 s), shorter than any hitherto recorded in optical observations.
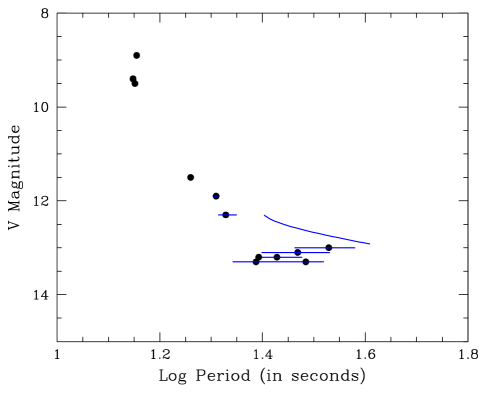
In Fig. 8 we show the evolution of DNO periods through decline of outburst, based on the data in Table 1 and in Section 4.1. We have included the X-ray period (van der Woerd et al. 1987) and Schoembs & Vogt’s (1980) beat period in this diagram. For V 12.5 there is a clear correlation between brightness and period, similar to what is commonly seen in dwarf nova outbursts. The slope of this relationship is , which is just within the range seen in other systems (Warner 1995a). However, as VW Hyi fades through V = 12.5 the rapid increase in period illustrated in Fig. 3 takes over and the slope steepens to at least when has increased to 40 s. We have not yet caught the end of this short-lived phase. Subsequently, shorter periods (22 – 35 s) are seen, but whether there is a frequency doubling, and whether different outbursts behave differently, we do not have sufficient data to judge. At this stage of outburst (the final approach to quiescence) the DNOs are very incoherent.


Our observations provide the frequency histogram shown in Fig. 9, which displays the fractional success rate for detection of DNOs on the decline of the outburst. In the range DNOs are almost always present. Earlier and later in outbursts their occurence falls away rapidly.
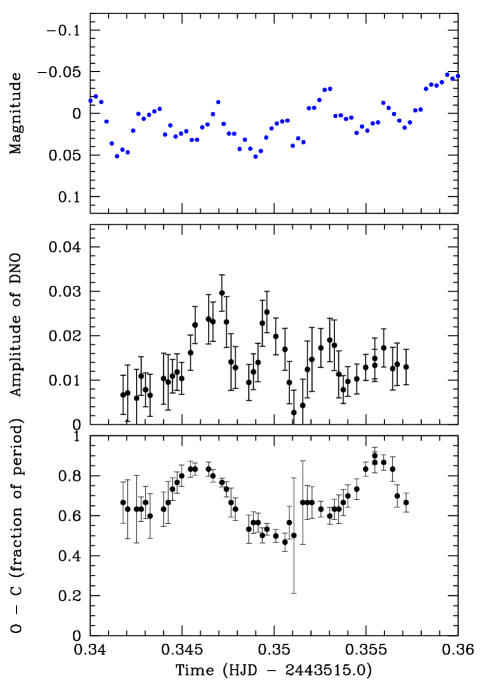
The DNOs present in the February 2000 light curve present the highest signal-to-noise and longest data train available to us. The detailed evolution of these DNOs is shown in Fig. 10 in which the upper and the lower panels show O–C curves, of 4 cycles of DNO with 75% overlap, relative to constants periods of 28.0 s and 33.0 s respectively for the first and last halves of the run. The central panel illustrates the central 50 percent, calculated with respect to a 30.5 s period. A few very uncertain points (because of small oscillation amplitude) have been omitted.
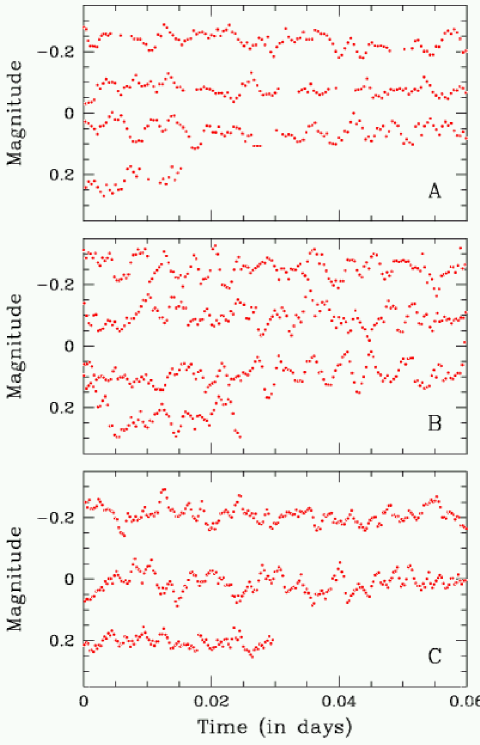
The quasi-cyclical variations of O–C that are readily visible in the central section of each panel are present throughout the run, and may be detected in the compression and rarefaction of points along the curves. These variations often correlate with QPO modulations and are described in Section 4.2.3. There are also, in this run as in most of our DNO observations, abrupt changes of period and occasional abrupt phase shifts. We illustrate in Fig. 11 some examples of these discontinuities, which are of the same kind as already mentioned for other CVs in Section 2. There are abrupt period changes at times 0.4645 and 0.4810, and phase discontinuities at 0.4690 and 0.4780. After 0.4810 the change in period is so large that the O–C values run off the top of the panel and ‘wrap around’. The O–C variations in this example do not correlate with the general brightness changes.

4.2.2 The QPOs
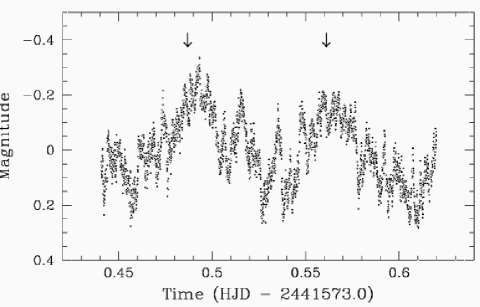
A few runs have QPOs of large amplitude. These are listed in Table 1 and two average profiles are shown in Fig. 13. Although these QPOs are obvious in the light curves, their presence in VW Hyi (and, by implication, in the light curves of other CVs) has previously been ascribed to slow flickering. The most extreme examples are shown in the upper panel of Fig. 12, which shows the second run on VW Hyi made by the senior author at a time when QPOs had yet to be identified by Patterson et al. (1977), and which was used merely as part of the series of runs which first disclosed orbital modulation in VW Hyi (Warner 1975). The coherence of the apparent large flares and dips in the upper panel of Fig. 12 can be judged from the mean light curve (the lower profile) given in Fig. 13.
The question of coherence is an important one. By their very nature, QPOs of short coherence are difficult to detect in the Fourier transform. Fig. 14 shows the details of the 71 min of light curve obtained on 23 September 1984 near the end of a normal outburst. The QPO maxima, spaced 300 s apart, are shown by vertical bars. We can interpret the evolution of the QPO in this light curve as the growth and decay of a QPO (indicated by single vertical bars) over about 5 cycles, followed by growth and decay over 4 - 6 cycles of another QPO (double bars) of similar period, but phase shifted relative to the first QPO by 0.4 cycle. Such a phase shift leads to spread of power and lowering of peak amplitude in the Fourier transform.
A characteristic of large QPOs is that at their minima they drag the intensity well below the smooth lower envelope of the light curve.


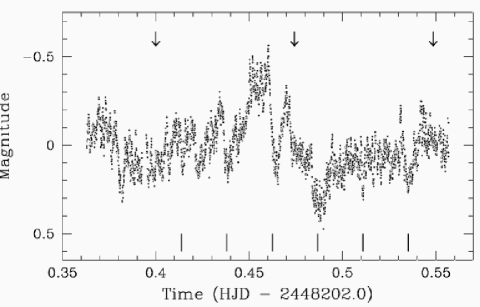
We illustrate in the lower part of Fig. 12 another light curve, obtained near the end of a normal outburst, in which the QPO phenomenon is very strong as judged by the dips and flares. The Fourier transform of this light curve, Fig. 15, shows the fundamental, first and second harmonics of a period near 2100 s, which account for the repetitive narrow dips marked in Fig. 12. The predicted times of orbital hump maxima are shown in the light curve of 6 November 1990, the first predicted hump is absent and the third is of low amplitude. Rapid changes in hump size were also seen by WB and imply large variations of rate of mass transfer from the secondary at the end of outburst, perhaps the result of searching for stability after enduring a slightly increased rate through the effect of irradiation during the outburst.
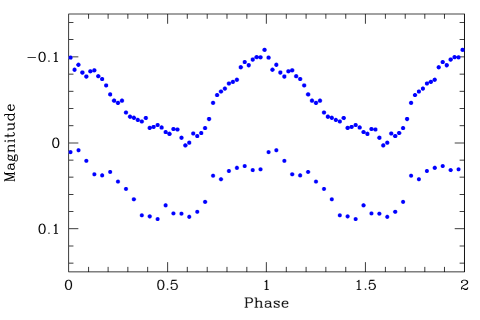
The final entries in Table 1 list seven light curves in which, in the light of the experience of analysing QPOs in outburst, we see or suspect QPOs in VW Hyi at quiescence. This is the first claim of the presence of QPOs in quiescent light curves of a dwarf nova. We illustrate one of these light curves in Fig. 16, and its Fourier transform in Fig. 17. There is a QPO with a period near 600 s which is strong in the first half of the run but decreases in amplitude during the latter half. The average profiles of the QPO for the first and second halves are included in Fig. 16. There is some power at the first harmonic of the QPO, which shows in the departure from sinusoidality of these mean profiles.
4.2.3 The interaction of DNOs and QPOs
Of greater interpretative value are the presence of what we will call QPO sidebands. Fig. 18 shows the power spectrum of the first 45 minutes of the light curve obtained on 3 November 1974. The DNO at 28.77 s has a companion at 31.16 s and there is a peak very close to half the period of the latter, giving physical authenticity to what might otherwise have been dismissed as a noise spike. The difference frequency of the two DNOs is very close to that of the 349 s QPO present in the light curve at that time. The sinusoidal profile of the 28.77 s signal, and the departure from sinusoidality of its companion (confirming the reality of the harmonic) are shown in Fig. 19. Clearly the 31.16 s signal is caused by interaction with the QPO signal – but is not due to amplitude modulation otherwise there would be two sidebands of equal amplitude. The effect is similar to the orbital sideband in intermediate polars (e.g. Warner 1986), where the lower frequency signal arises from reprocessing of a rotating beam (from the primary) periodically illuminating the secondary or bright spot region, which makes “QPO sideband” an appropriate description. In Paper II we suggest that the QPO sideband arises from a progradely rotating ‘wall’ in the inner disc.


These signals are only clearly present in the first part of the light curve. From an O–C analysis we find that at this time the DNOs show only relatively small jumps in period or phase, which is what allows the Fourier transform process to detect the signals easily. It is possible that in the remainder of this run, and in other similar runs, the QPO sideband and/or its harmonic may be physically present, but do not stay still long enough to be captured by our analysis techniques.
In the earlier studies by WB and RW examples were given of the amplitudes of the DNOs being modulated at the QPO period. We have found several further examples of this, though it is rare to find both oscillations of sufficient amplitude for this to be readily visible. There are also examples where the DNO amplitude is unaffected by the QPO modulation.
The examples are too numerous to show in their entirety, but reference to Fig. 14 illustrates some of these points. Some of the QPO maxima have large DNO amplitude associated with them – in a way that indicates the growth and decay of DNO amplitude over the QPO maximum. Other QPO maxima have DNOs of low amplitude. DNOs of large amplitude can be seen midway between the fourth and fifth QPO maxima. DNOs of nearly constant amplitude through a QPO cycle can be seen in the inset to Fig. 1.
To expand on these examples, and those given in WB and RW, we show detailed analyses in Figs. 20 and 21. Fig. 20 shows a positive correlation between DNOs and QPOs, in the sense that the DNOs have maximum amplitude at the peaks of the QPOs. During this run the DNO phases appear largely independent of the amplitude variations. In Fig. 21 the DNO amplitudes appear relatively uncorrelated with the large QPO modulation, but there is an overall anticorrelation between DNO phase and QPO. It is certainly noticeable that the time scale of the modulations of DNO phase is similar to that of the QPO variations.

5 Concluding Remarks
This study was stimulated by the lightcurve of VW Hyi at the end of outburst, obtained in February 2000 (Fig. 1). At first sight this light curve looks typical of the flickering seen in a CV late in outburst. But closer inspection shows that there is almost no flickering present – the light curve is made up of an orbital modulation plus variable amplitude DNOs and QPOs. The evolution of the DNO and QPO periods in this light curve has assisted in selection among the various models of DNOs and QPOs that have been proposed. It is evident that QPOs are more common than realised – their short coherence time results in a broad and noisy signal in the Fourier transform, where (as originally pointed out by Patterson et al. 1977), they are easily overlooked even though they may be obvious to the eye in the light curve. There is a need for an operational definition of QPOs, which can be applied objectively to the light curves of CVs.
Acknowledgments
We thank the American Association of Variable Star Observers and the Royal Astronomical Society of New Zealand, specifically and respectively Janet Mattei and Frank Bateson, for supplying magnitudes of VW Hyi from their archives. We thank also Darragh O’Donoghue for the use of his EAGLE program. Many observers have contributed to the VW Hyi archive, in particular, and at our request, Gerald Handler. BW’s research is supported by funds from the Research Committee of the University of Cape Town, but not by the National Research Foundation. Financial support for PAW comes from strategic funds made available to BW by the University of Cape Town.
References
- [1] Bailey J.A., 1975, JBAA, 86, 30
- [2] Cannizzo J.K., 1993, ApJ, 419, 318
- [3] Carroll B.W., Cabot W., McDermott P.N., Savedoff M.P., van Horn H.M., 1985, ApJ, 296, 529
- [4] Collins T.J.B., Helfer H.L., Van Horn H.M., 2000, ApJ, 534, 934
- [5] Cordova F.A., Mason K.O., 1984, MNRAS, 206, 879
- [6] Cordova F.A., Chester T.J., Tuohy I., Garmire G.P., 1980, ApJ, 235, 163
- [7] Haefner R., Schoembs R., Vogt N., 1979, A&A, 77, 7
- [8] Hesser J.E., Lasker B.M., Osmer P.S., 1974, ApJ, 189, 315
- [9] Jones M.H., Watson M.G., 1992, MNRAS, 257, 633
- [10] Kato T., Hirata R., Mineshige S., 1992, PASJ, 44, 215L
- [11] Knigge C., Drake N., Long K.S., Wade R.A., Horne K., Baptista R., 1998, ApJ, 499, 429
- [12] Lasota J.-P., Kuulkers E., Charles P., 1999, MNRAS, 305, 473
- [13] Lubow S.H., Pringle J.E., 1993, ApJ, 409, 360
- [14] Marino B.F., Walker W.S.G., 1979, IAU Colloq. No. 46, 29
- [15] Marsh T.R., Horne K., 1998, MNRAS, 299, 92
- [16] Mauche C.W., 1996a, ApJ, 463, 87L
- [17] Mauche C.W., 1996b, in Bowyer S., Malina R.F., eds., Astrophysics of the Extreme Ultraviolet. Kluwer, Dordrecht, p. 317
- [18] Mauche C.W., 1997, in Wickramasinghe D.T., et al., eds., ASP Conf. Ser. Vol. 121, Accretion Phenomena and Related Outflows. Astron. Soc. Pac., San Francisco, p. 251
- [19] Mauche C.W., 1998, in Howell S., Kuulkers E., Woodward C., eds., ASP Conf. Ser. Vol. 137, Wild Stars in the Old West. Astron. Soc. Pac., San Francisco, p. 113
- [20] Patterson J., Robinson E.L., Nather R.E., 1977, ApJ 214, 144
- [21] Ramsay G., Poole T., Mason K., Córdova F., Priedhorsky W., Breeveld A., Much R., Osborne J., Pandel D., Potter S., West J., Wheatley P., 2001, A&A, 365, 288L
- [22] Robinson E.L., 1973, ApJ, 183, 193
- [23] Robinson E.L., Nather R.E., 1979, ApJS, 39, 461
- [24] Robinson E.L., Warner B., 1984, ApJ, 277, 250 (RW)
- [25] Robinson E.L., Nather R.E., Patterson J., 1978, ApJ, 219, 168
- [26] Schoembs R., Vogt N., 1980, A&A, 91, 25
- [27] Smak J., 1985, Acta Astr., 35, 357
- [28] Steeghs D., O’Brien K., Horne K., Gomer R., Oke J.B., 2001, MNRAS, 323, 484 (S2001)
- [29] van der Woerd H., Heise J., Paerels F., Beuermann K., van der Klis M., Motch C., van Paradijs J., 1987, A&A, 182, 219
- [30] van Teeseling A., 1997, A&A, 324, 73
- [31] Warner B., 1973, MNRAS, 163, 25P
- [32] Warner B., 1975, MNRAS, 173, 37P
- [33] Warner B., 1986, MNRAS, 219, 347
- [34] Warner B., 1987, Lect. Notes Phys., 274, 384
- [35] Warner B., 1995a, Cataclysmic Variable Stars, Cambridge Univ. Press, Cambridge
- [36] Warner B., 1995b, in Buckley D.A.H., Warner B., eds., ASP Conf. Ser. Vol. 85, Cape Workshop on Magnetic Variables. Astron. Soc. Pac., San Francisco, p. 343
- [37] Warner B., Brickhill A.J., 1974, MNRAS, 166, 673
- [38] Warner B., Brickhill A.J., 1978, MNRAS, 182, 777 (WB)
- [39] Warner B., Harwood J., 1973, Inf. Bull. Var. Stars, No. 756
- [40] Warner B., Nather R.E., 1972, MNRAS, 159, 429
- [41] Warner B., Robinson E.L., 1972, Nature Phys. Sci., 239, 2
- [42] Warner B., Woudt P.A., 2002, MNRAS, submitted (Paper II)
- [43] Warner B., O’Donoghue D., Wargau W., 1989, MNRAS, 238, 73
- [44] Wheatley P.J., Verbunt F., Belloni T., Watson M.G., Naylor T., Ishida M., Duck S.R., Pfefferman E., 1996, A&A, 307, 137