X-rays from the jet in 3C 273:
clues from the radio–optical
spectra
Using new deep VLA and HST observations of the large-scale jet in 3C 273 matched to 03 resolution, we have detected excess near-ultraviolet emission () above a synchrotron cutoff spectrum accounting for the emission from radio through optical (–). This necessitates a two-component model for the emission. The radio–optical–X-ray spectral energy distributions suggest a common origin for the UV excess and the X-rays from the jet.
Key Words.:
Galaxies: jets – quasars: individual: 3C 273 – radiation mechanisms: non-thermal1 Introduction
Recent Chandra observations have shown that X-rays from large-scale extragalactic jets are more common than expected from earlier observations using the Einstein Observatory and ROSAT (Harris & Krawczynski 2002). They are most likely of non-thermal origin, but for many cases is has been impossible to establish the relative contributions from synchrotron and inverse Compton emission.
One of these is the jet of the quasar 3C 273. Due to its large angular extent of over 20″( 60 kpc at =0.158111; ) and its high surface brightness in the radio, optical and in X-rays, it is readily observable and serves as a sample case for the study of extragalactic jets. The high degree of optical polarisation (10%–20%; Röser & Meisenheimer 1991) and the overall agreement with the radio polarisation properties (Röser et al. 1996) imply that the bulk of the jet’s optical light is synchrotron emission from the same electron population responsible for the radio emission. However, the X-rays could be synchrotron emission from this same electron population only for regions A and B of the jet (Röser et al. 2000; Marshall et al. 2001). Since self-Compton scattering of the radio-optical emission can account only for a small fraction of the observed X-ray fluxes, Röser et al. (2000) suggested to consider the X-rays as synchrotron emission from a second, higher-energy electron population. As an alternative, a contribution by beamed inverse Compton scattering of the cosmic microwave background has been suggested (Marshall et al. 2001; Sambruna et al. 2001). A distinction between these models is not possible based on the currently available X-ray data. Both require somewhat exotic physical conditions. In this letter, we present new radio-optical observations which suggest a common origin for the X-rays and part of the jet’s ultraviolet emission.
We employ observations at wavelengths of 3.6, 2.0, 1.3 (VLA222The National Radio Astronomy Observatory is a facility of the National Science Foundation operated under cooperative agreement by Associated Universities, Inc.), 1.6 m (HST-NICMOS333Based on observations made with the NASA/ESA Hubble Space Telescope, obtained at the Space Telescope Science Institute, which is operated by the Association of Universities for Research in Astronomy, Inc. under NASA contract No. NAS5-26555. These observations are associated with proposals #5980 and #7848.), 620 and 300 (HST-WFPC233footnotemark: 3). The WFPC2 data have been described in Jester et al. (2001). Details of the NICMOS data are contained in Jester (2001) and will be reported elsewhere Jester et al., in prep., as will the full VLA data set Perley et al., in prep..
2 Observed spectra
We have performed photometry for circular Gaussian beams at common FWHM of 03. We make sure that the relative alignment of photometric apertures across all wavelengths is better than 003, so that identical volumes are sampled. We first consider the observed shape of the spectral energy distribution before describing it with a theoretical model.
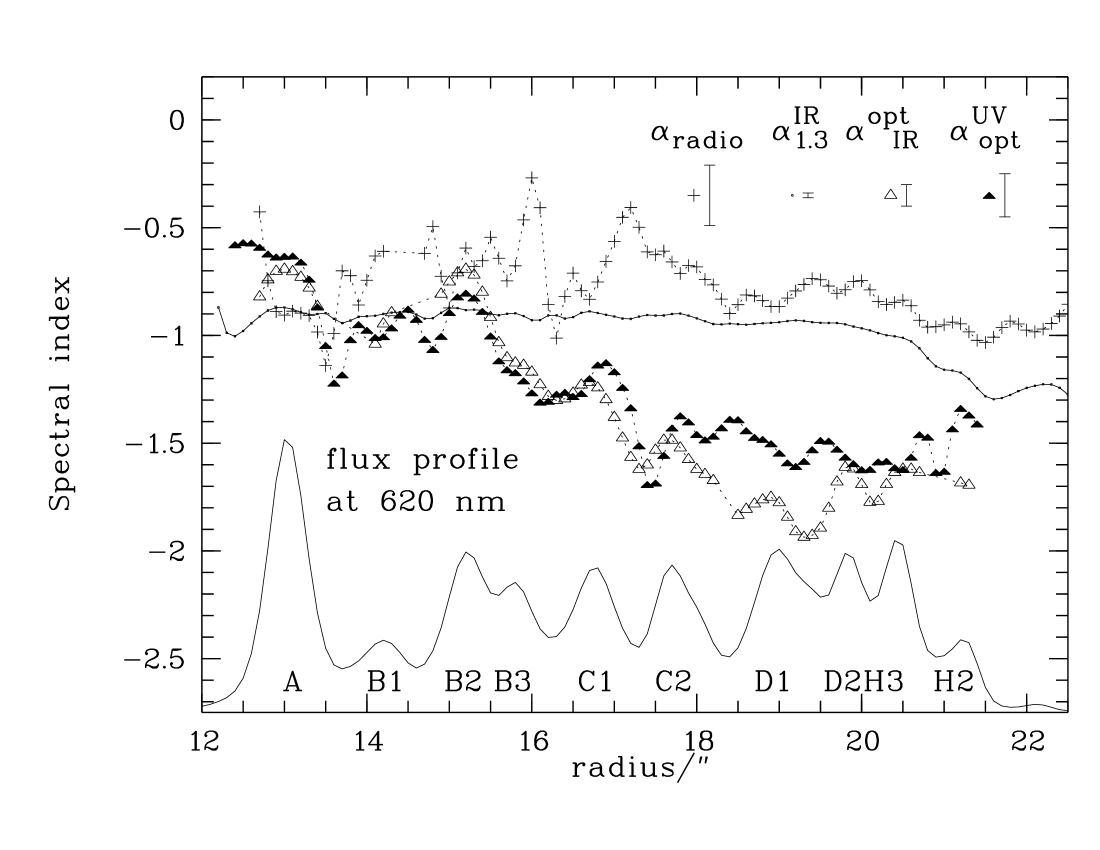
Figure 1 shows the run of spectral indices along the optically bright part of the jet (setting on at from the quasar core). It shows remarkable features. Firstly, variations in are much smaller than in other indices, i. e., the overall spectral shape is amazingly constant within the entire jet (apart from the radio hot spot). This reflects the jet’s similar appearance over more than four decades in frequency. It implies that there is a physical mechanism maintaining a similar electron distribution everywhere in the jet. Secondly, in regions A () and B2 (), both the ultraviolet-optical spectral index and the infrared-optical index are flatter, i. e., is smaller, than the radio-infrared spectral index (see also Fig. 2). In regions C2 to D2/H3, from to , is flatter than , although both are now steeper than the radio-infrared spectral index. A similar flattening was already seen between determined with the HST and the optical spectral index determined on ground-based data at slightly lower frequencies (Fig. 4 in Jester et al. 2001).
To assess the significance of this flattening, it is necessary to distinguish between various error sources. The shot noise is less than 0.5% per 03 beam in all bands. The HST data have flat-field errors of 1% (WFPC2) – 3% (NICMOS; compare the error discussion in Perlman et al. 2001). The uncertainty in the background estimation is estimated from the scatter in blank sky regions as 0.01 Jy per 03 beam for WFPC2, and 0.03 Jy for NICMOS, forming an error floor significant only for the faintest parts of the jet. An error source unique to the interferometric radio data is the image fidelity, i. e., errors in the sense that the inferred brightness distribution does not correspond to the true distribution on sky, in particular for the fainter parts of the jet. We use a 3% error to account for this. All these error sources limit the accuracy of relative photometry within one waveband, and the error bars in Fig. 1 show these errors. In addition, all wavebands will suffer an error from the absolute photometric calibration, typically 2%. This calibration error changes all measurements within one filter by the same factor, i. e., it is a systematic error. Its effect is to offset an entire spectral index run by a constant amount. The absolute photometry errors are too small to allow matching the run of with that of in C2–H3, which in any case would not remove the flattening of below in A and B2. The observed flattening is thus real.
Observed synchrotron spectra are commonly described as power laws, and are thought to arise from a power-law electron energy distribution. Since synchrotron losses increase with the square of the electron energy, any non-ideal electron distribution will give rise to a spectrum with convex shape in against , i. e., higher-frequency spectral indices are steeper than those at lower frequencies, and any high-frequency flux must lie below a power-law extrapolation from lower frequencies. The observed high-frequency flattening in A, B2, and C2–D2/H3 excludes that the jet emission can be described using a simple, single electron population. Instead, a two-component model is required. The radio and optical fluxes are dominated by the first component. A second component must contribute in excess of this, either mainly in the infrared, or mainly in the ultraviolet and at higher frequencies.
3 Is there an infrared or ultraviolet excess?
We describe the lower-frequency component by fitting model spectra according to Heavens & Meisenheimer (1987), which have been applied successfully to observations of hot spots (Meisenheimer et al. 1997). These spectra self-consistently account for synchrotron losses arising from a Fermi-accelerated electron population which is continuously injected into a loss region, and include losses even during the acceleration phase. The resulting finite maximum particle energy leads to a quasi-exponential cutoff at the synchrotron frequency corresponding to the highest electron energies. These spectra are appropriate here as the optically radiating electrons must be accelerated within the jet itself (Jester et al. 2001).
The original aim of these fits is the determination of the synchrotron cutoff frequency and hence the maximum particle energy along the jet; a detailed description and results will be published separately (Jester et al., in prep., and Jester 2001). Here, we consider the excess of the observed infrared or ultraviolet emission above the spectrum arising from the lower-energy electron population, and its implications for the X-ray emission mechanism.
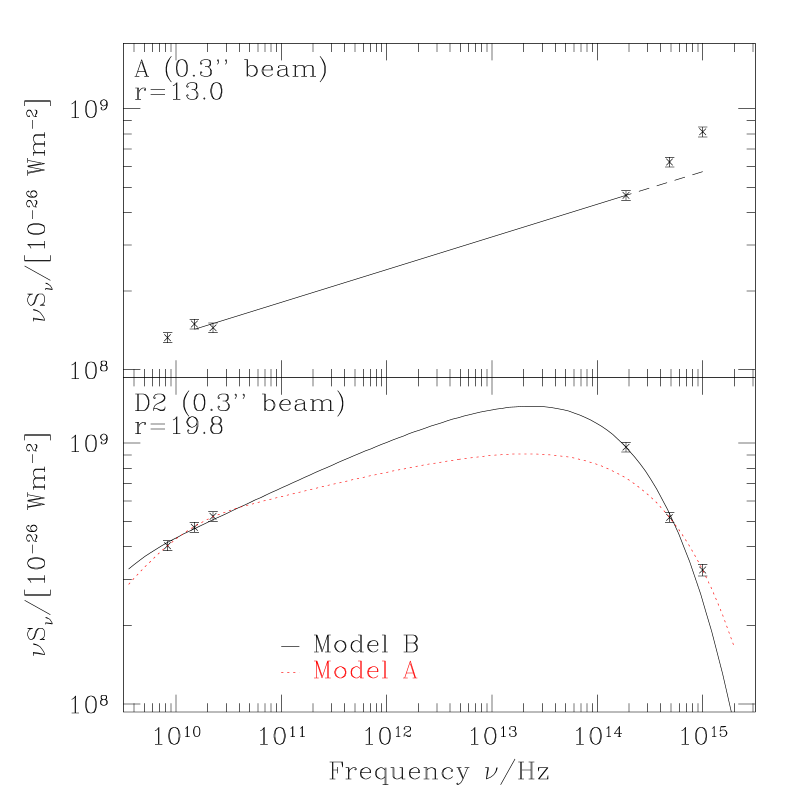
We fit the observed radio-optical spectral energy distribution at 03 beam size for all locations of the optical jet, performing two separate fits which differ in the determination of the cutoff frequency (Fig. 2): either the cutoff is described by the optical-ultraviolet spectral index leading to an infrared excess (Model A), or conversely, the true cutoff is described by the infrared-optical spectrum and there is additional flux in the ultraviolet (Model B).
Model A disregards the near-infrared flux point in the data set. This is motivated by the indication that the radio cocoon around the jet (Röser et al. 1996) may also be detectable at 2.1 m (Neumann et al. 1997), suggesting that the flux from the jet at 1.6 m may be contaminated by emission from the cocoon as well. However, the residuals in Model A contribute up to 30% of the observed infrared flux, which is a much larger fraction than expected for a cocoon spectral energy distribution peaking at radio frequencies. Moreover, a comparison of the residuals with our new high-resolution radio polarisation map Perley et al., in prep. shows that the largest residuals are not cospatial with those regions showing the highest fractional polarisation (Jester 2001). These properties make this component very different from the original cocoon, which has a steep spectrum (hence low flux at the short wavelengths considered here) and high polarisation. In this model, the upward curvature of the observed spectra at the inner end of the optical jet, in regions A–B, remains unexplained. There is no plausible alternative infrared emission process or source. Model A is therefore discarded.
Model B assigns a low weight to the ultraviolet flux point, so that the location of the cutoff is dominated by the infrared and optical points at 1.6 m and 620, respectively. There is a significant ultraviolet excess above the fitted infrared-optical cutoff or the radio-infrared power-law extrapolation in all parts of the jet. As the actual cutoff could be steeper than the fit including the UV point, the ultraviolet excess determined in this way is actually a lower limit to the true excess. At 300, already a significant fraction of the observed flux may be contributed by this additional component. A smaller fraction of the optical emission will be contributed by the same component. Unlike the cocoon, which would be expected to contribute only in a limited part of the jet, the presumed additional ultraviolet component may be present in the entire jet and can account for the discrepancy between infrared-optical and optical-ultraviolet spectrum everywhere it is observed.
As is the case for the X-ray emission, the origin of this excess ultraviolet flux is unknown. Instead of postulating yet another emission component, we suggest a common non-thermal origin for the ultraviolet excess and the X-ray emission. To assess quantitatively whether both could stem from the same electron population, we consider whether the emission in both wavelength regions can be explained by a single simple model.
4 Discussion: The X-ray emission from the jet
| Frequency | Integrated flux density [Jy] | |
|---|---|---|
| [Hz] | Knot A | D2+H3 |
| 8.33 | (78.7 2.4) | (866 26) |
| 1.45 | (50.4 1.5) | (536 16) |
| 2.25 | (35.5 1.1) | (371 11) |
| 1.87 | 9.66 0.35 | 41.9 1.5 |
| 4.84 | 4.20 0.09 | 7.56 0.17 |
| 1.00 | 2.40 0.05 | 2.27 0.05 |
| 2.42 | 0.038 0.004 | 0.0083 0.0008 |
| radio) [W] | 1.7 | 1.0 |
| X-ray) [W] | 1.4 | 4.1 |


The three high-frequency data points presented here are not sufficient to fully disentangle contributions from two different processes. We therefore only consider whether the UV excess derived using our spectral fits is consistent with an extrapolation of the X-ray flux and spectral index.
The best current X-ray data have been presented by Marshall et al. (2001). They have a spatial resolution of 07. The comparison is therefore carried out only for two regions of the jet for which Marshall et al. (2001) quote an X-ray flux and spectral index (their Table 2) and for which the association with optical features is clear: Region A1 and Region D2+H3 (beware of slightly different nomenclature). We sum the near-infrared, optical and ultraviolet flux and the ultraviolet excess above the radio-infrared power law for A and the fitted cutoff for D2/H3, respectively (Tab. 1), and compare these with a power-law extrapolation from X-rays. As evidenced by Fig. 3, there is a surprisingly good match in both regions between the UV excess determined here and the extrapolation of the X-ray observations, suggesting a common origin.
We thus propose a two-component model for the emission of this jet: a “low-energy” synchrotron component and a second “high-energy” component, which accounts for the X-rays and is already noticeable at ultraviolet wavelengths, either synchrotron emission (the observed X-ray spectral index is in the typical range for synchrotron emission from jets; Meisenheimer et al. 1997) or beamed inverse Compton emission (microwave photons are upscattered into the UV by electrons with Lorentz factors of 5–10 for jet Lorentz factors of 20–5). As synchrotron spectra are necessarily convex in against , the observed high-frequency flattening implies the presence of a second emission component in the UV even for different model spectra from those assumed here. Only the magnitude of the excess depends on the spectral shape, and hence the proposed common origin of UV excess and X-rays. As evidenced by the small changes in the radio-infrared spectral index, the shape of the “low-energy” electron energy distribution is kept constant within the entire jet by some unknown physical mechanism.
With the present radio-optical data, no statements can be made about the spectral shape of the “high-energy” component beyond the plausibility argument presented here. In order to confirm the reality of the UV excess and to characterise its spectrum, it is both necessary to constrain the run of the optical synchrotron spectrum more accurately by further observations in the near-infrared and optical, and to characterise the spectrum of the UV excess by far-ultraviolet observations. Deeper Chandra observations are needed to establish the detailed X-ray morphology of the outermost part of the jet and confirm the tentative detection of X-ray spectral index changes H. Marshall, priv.comm., and thus test our model of a common origin for the ultraviolet excess and the jet’s X-ray emission. Ideally, X-ray polarimetry would provide the most stringent test for the X-ray emission mechanism beyond our spectral studies. However, such a study will have to await the construction of X-ray polarimeters with sufficient sensitivity and resolution, which are currently in the development stage.
Acknowledgements.
We acknowledge fruitful discussions with Herman Marshall. We thank the referee, Dan Harris, for rapid and thorough criticism.References
- Harris & Krawczynski (2002) Harris, D. & Krawczynski, H. 2002, ApJ, 565, 244
- Heavens & Meisenheimer (1987) Heavens, A. F. & Meisenheimer, K. 1987, MNRAS, 225, 335
- Jester (2001) Jester, S. 2001, PhD thesis, U. Heidelberg, http://www.ub.uni-heidelberg.de/archiv/1806
- Jester et al. (2001) Jester, S., Röser, H.-J., Meisenheimer, K., Perley, R., & Conway, R. G. 2001, A&A, 373, 447
- Marshall et al. (2001) Marshall, H. L., Harris, D. E., Grimes, J. P., et al. 2001, ApJ, 549, L167
- Meisenheimer et al. (1997) Meisenheimer, K., Yates, M. G., & Röser, H.-J. 1997, A&A, 325, 57
- Neumann et al. (1997) Neumann, M., Meisenheimer, K., & Röser, H.-J. 1997, A&A, 326, 69
- Perlman et al. (2001) Perlman, E. S., Biretta, J. A., Sparks, W. B., Macchetto, F. D., & Leahy, J. P. 2001, ApJ, 551, 206
- Röser et al. (1996) Röser, H.-J., Conway, R. G., & Meisenheimer, K. 1996, A&A, 314, 414
- Röser & Meisenheimer (1991) Röser, H.-J. & Meisenheimer, K. 1991, A&A, 252, 458
- Röser et al. (2000) Röser, H. J., Meisenheimer, K., Neumann, M., Conway, R. G., & Perley, R. A. 2000, A&A, 360, 99
- Sambruna et al. (2001) Sambruna, R. M., Urry, C. M., Tavecchio, F., et al. 2001, ApJ, 549, L161