The Evolution of type 1 AGN in the IR
(15m).
The view from ELAIS-S1
††thanks: Based on observations with the Infrared Space
Observatory (ISO). ISO is an ESA project
with instruments funded by
ESA Member States (especially the PI countries: France, Germany,
The Netherlands and the United Kingdom) and with the participation
of ISAS and NASA.
Abstract
We present the 15m luminosity function of AGN1 (QSO + Seyfert 1). Our sample of 21 high-redshift sources is selected from the Preliminary Analysis catalogue in the S1 field of the European Large Area ISO Survey (ELAIS). To study the cosmological evolution of the AGN1 luminosity function, our sample has been combined with a local sample of 41 sources observed by IRAS. We find that the luminosity function of AGN1 at 15m is fairly well represented by a double-power-law-function. There is evidence for significant cosmological evolution consistent with a pure luminosity evolution (PLE) model , with . The value of depends on the existence or not of an evolution cut-off at redshift 2, and on the adopted cosmology. From the luminosity function and its evolution we estimate a contribution of AGN1 to the Cosmic Infrared Background (CIRB) of W m-2 sr-1 at 15m. This corresponds to of the total observed CIRB at this wavelength. Under the usual assumptions of unified models for AGN, the expected contribution of the whole AGN population to the CIRB at 15m is .
keywords:
surveys – galaxies: active – cosmology: observations – infrared: galaxies1 Introduction
The measurement of the luminosity function (LF) of Active Galactic Nuclei (AGN) and its evolution provides fundamental information on the accretion history of the Universe, the physics related to it, how structures have been formed and on the contribution of this population to the Cosmic Background.
Historically, AGN have been classified using their optical characteristics and divided into two categories: type 1 (AGN1) and 2 (AGN2), according to the presence or absence of broad emission lines in their optical spectra (we will use this definition throughout this paper).
Unified models assume a dusty, IR emitting, torus around the central engine. These models distinguish AGN1 and AGN2 depending on the torus orientation; AGN1 are galaxies with low absorption from the mid-IR to the soft X-ray while AGN2 are objects with the largest column densities (e.g. Antonucci 1993; Urry & Padovani 1995).
The strength of the AGN1 LF evolution has been determined in the optical, soft and hard X-rays (e.g. Boyle et al. 2000; Miyaji et al. 2000; La Franca et al. 2002), while in the mid infrared (5-30 m: mid-IR) it is still unknown. The only measure available at these wavelengths, for AGN1, is the local LF at 12 m from IRAS data (Rush, Malkan & Spinoglio, 1993; RMS hereafter).
The situation for AGN2 is quite different because they are strongly absorbed and thus difficult to select and/or spectroscopically identify. Statistically significant samples of AGN2 need to be built up in the far infrared or the hard X-rays where absorption is less significant. However, in these cases the optical spectroscopic identification is also a difficult task.
For these reasons the contribution of AGN to the Cosmic Infrared Background (CIRB) is still unknown. The only estimate is based on AGN1 evolution measured at other wavelengths, under assumptions on the AGN spectral energy distribution (SED), and the AGN1/AGN2 ratio (e.g. Granato, Danese & Franceschini 1997).
We have spectroscopically identified 25 AGN1 at 15m from the Preliminary Analysis (PA) catalogue of the European Large Area ISO Survey (ELAIS). Our spectroscopic sample is the only one able to probe the high redshift population of AGN1 in this waveband. Other published ISO samples (i.e. CFRS, Flores et al. 1999; ISO-HDF north, Aussel et al. 1999; ISO-HDF south, Oliver et al. 2002) do not have enough sources and/or spectroscopic identifications.
Here we present our measurement of the evolution of LF of AGN1 at 15m using our data combined with the 12m local sample from RMS. The data are presented in section 2. In section 3 we describe the method used to derive the LF, while the results are presented and discussed in section 4.
2 The Sample
ELAIS is the largest single open time project conducted by ISO (Oliver et al. 2000), mapping an area of 12 deg2 at 15m with ISOCAM and at 90m with ISOPHOT. Four main fields were chosen in order to reduce the effects of cosmic variance (N1, N2, N3 in the north hemisphere and S1 in the south) at high Ecliptic latitudes () on selected areas of low extinction.
A Preliminary Analysis (PA) catalogue was produced for the 4 main fields (Serjeant et al. 2000). The Final Analysis (FA) uses the Lari technique and the catalogue of the S1 field (J2000,, covering an area of 3.96 deg2) has been recently released by Lari et al. (2001).
Optical identifications were possible due to an extensive R-band CCD survey, performed with the ESO/Danish 1.5m and the ESO/MPE 2.2m telescopes. The spectroscopic follow-up program was carried out with the AAT at the Anglo-Australian Observatory (AAO), the 3.6m and NTT at ESO/La Silla. The selection of targets for spectroscopic identification was carried out randomly in order to cover uniformly 70% of the sources in the magnitude range R. The dominant class is star-forming galaxies (about 50%), however AGN (type 1 + 2) constitute a significant fraction of the identifications in this magnitude range (30%). The ELAIS-S1 field has also been completely covered in the radio at 1.4 GHz down to 0.3 mJy (Gruppioni et al. 1999), and in 50 of its area in the X-rays with BeppoSAX (Alexander et al. 2001).
In order to assess our sample of optically identified PA sources, we took advantage of the already completed FA catalogue in the ELAIS-S1 region (Lari et al. 2001). The FA catalogue contains 462 sources at 5 confidence level, while the PA catalogue we used contains 762 sources, as it includes also less significant sources.
All the PA sources with spectroscopic identifications were analyzed, and the flux recomputed with the Lari Technique at confidence level: 23 out of 25 PA AGN1 were confirmed and used for our statistical analysis.
The fluxes of the PA catalogue were recomputed according to the FA calibration by using all the objects in common, plus the PA objects with existing spectroscopy and detected also with the Lari Technique at confidence level. The effective area, as a function of flux, of our PA selected sample has been statistically estimated by comparing the PA “corrected” counts (i.e. including only those detected at confidence level with the Lari Technique) with the counts derived from the FA catalogue by Gruppioni et al. (2002).
Our final sample consists of 21 AGN1 (0.33.2, see Figure 1) with and R (two objects fainter than R=20 fall outside these limits).
To represent the local mid-infrared population of type 1 AGN we have combined our data with a sample of 41 AGN1 belonging to the RMS sample selected from the IRAS Faint Source Catalog, Version 2 (Moshir et al. 1991). This sample is complete down to 300 mJy at 12m.

3 The Luminosity Function
In this work we define as at 15m. Detailed -corrections (over the 15m LW3 filter from ISO and the 12m filter from IRAS) are necessary in order to derive the 15m luminosities for our sources, as well as to convert the 12m luminosity from the RMS sample into a 15m luminosity. We adopted the mean spectral energy distribution (SED) of radio-quiet QSOs from Elvis et al. (1994) as representative of our AGN1 population. The standard -correction was computed following Lang (1980). Figure 1 illustrates the luminosity-redshift space distribution of all AGN1 used in this study.
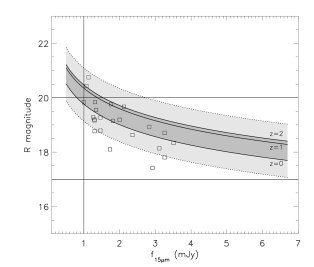
A parametric, unbinned maximum likelihood method was used to fit simultaneously the evolution and luminosity function parameters (Marshall et al. 1983) of the combined sample. Since ELAIS identifications were carried out in the R-band magnitude interval 17.0R20.0, a factor , which takes into account the optical limits, was introduced into the likelihood function. represents the probability that a source with a given luminosity at 15m () and redshift , had a R-magnitude within the limits of the sample, and was derived taking into account the 1 internal spread in the assumed SED (Elvis et al. 1994). The R-band -corrections were taken from Natali et al. (1998). In order to show the dependence of our sample completeness on the assumed SED we plot the expected relation (and its 1 spread) between the IR and optical fluxes (Figure 2). From this we estimate that our sample of AGN1 is about 76% complete. The missing fraction of objects is expected to be found in the interval 20.0R22.0. The function to be minimized can therefore be written as , being the likelihood function,
where N is the total number of sources in the two samples, is the fractional area of the sky over which a source with luminosity and redshift could have been observed, is the differential comoving volume and the space and luminosity density of the sources being considered.
Following studies of AGN1 in the optical and in the X-ray, we adopted a smooth double power-law for the space density distribution in the local Universe,
and tested a Pure Luminosity Evolution (PLE) model of the form:
Confidence regions for each parameter have been obtained by computing at a number of values around the best-fitting () parameter, while allowing the other parameters to float (see Lampton, Margon & Bowyer 1976). The 68% confidence levels quoted correspond to . The normalization factor was determined by requiring agreement with the observed total number of sources (ELAIS + RMS).
Bidimensional Kolmogorov-Smirnov (2D-KS) probabilities (see Peacock 1983; Fasano & Franceschini 1987) were derived for each of the best fitting PLE models.
We computed the LF both in a (,)=(1.0,0.0) and (,)=(0.3,0.7) cosmology, assuming .
-
Errors correspond to 68% confidence level for a single interesting parameter.
-
corresponds to and is given in .
-
The normalization, , is given in .
-
Contribution () of type 1 AGN to the 15m Mid-IR background in units of .
4 Results and Discussion
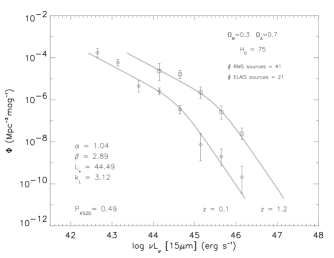
Figure 3 and Table 1 show the results of the fit for the 2 cosmologies considered together with the 2D-KS probabilities. The points plotted in Figure 3 correspond to the space densities of the observed sources, corrected for evolution within the redshift intervals as explained in La Franca & Cristiani (1997).
Our (,)=(1.0,0.0) local LF is not fully consistent with the estimate of RMS. Our bright slope is steeper than the estimate of RMS. This difference can probably be attributed both to a steeper high- LF and to the effects of evolution on the brightest bins used by RMS.
The Mid-Infrared LF, for either cosmologies, is steeper than that observed in the optical and in the soft and hard X-ray. The faint 15m slope is while the bright slope is . In the optical Boyle et al. (2000) found and (here we quote slope-1 in order to convert to units). In the soft and hard X-rays the faint slope is while the bright slope is (Miyaji, Hasinger & Schmidt 2000; La Franca et al. 2002).
According to the blue optical spectra of our identified AGN1, we can exclude the possibility that a different population has been selected. As a consequence this steepening at longer wavelength of the LF, taken at face value, would imply a dependence of the spectral energy distribution of AGN1 on luminosity and/or redshift. For example, a larger IR contribution from the SED of the fainter AGN1 (possibly caused by a more relevant contribution from the hosting galaxy) could be the origin of the observed behaviour. A more detailed discussion on this issue will be carried out when the results from the identifications of the FA catalogue from ELAIS are available.
Similarly to what has been observed in the optical, the evolution at 15m is fairly well represented by a PLE model with . Our data are not statistically significant enough to probe the presence of a cut-off in the evolution () as observed in the optical and X-ray bands. As shown in Table 1, our fits are consistent with a typical value , similar to what has been found from optical and X-ray studies (e.g. Boyle et al. 2000; Miyaji et al. 2000). All the fits show a good 2D-KS probability, with larger values in a Universe.
Our estimates of the 15m LF allow us to compute the contribution of AGN1 to the 15m CIRB. Direct measurements of the CIRB in the 5-100m range are difficult. Hauser et al. 2001, report an upper limit of 470 and 500 at 12 and 25m respectively, based on the attenuation of the -ray photons (see also Hauser et al. 1998). On the other hand, a lower limit of at 15m is found from the integrated light of source counts derived from observations with ISOCAM (Altieri et al. 1999).
The intensity of the Cosmic Background at 15m is given by,
where represents the observed flux density of a source with an intrinsic luminosity at redshift . According to our derived PLE models, we estimate a contribution of the AGN1 to the CIRB at 15m (in units of ) in the range , depending on the cosmology adopted and on the existence or not of a redshift cut-off (, see Table 1). The integral has been computed for up to . These values correspond to about of the integrated light measured by Altieri et al. (1999). If we assume that the ratio of AGN2 to AGN1, which is about 4 locally (e.g. Lawrence 1991; Maiolino & Rieke, 1995), does not change substantially with redshift and that the shape and evolution of the luminosity function of AGN2 is similar to those of AGN1, the total contribution for AGN to the background measured by Altieri et al. (1999) would be . This value is in rough agreement with what is predicted by the models of dusty tori in AGN from Granato et al. (1997). The predictions from Xu et al. (2001) on the contribution of AGN to the CIRB at 15m is about a factor of 2 lower than our estimate. This difference is probably due to two reasons. First, the slope of their local LF of AGN1+AGN2 is flatter than our estimates at faint luminosities. Second, their assumed evolution (a PLE with =3.5 up to =1.5 and then dropping as =-3) has a lower and a faster decay at high redshift.
Acknowledgments
We acknowledge J. Kotilainen, A. Verma and M. Linden-Vernle for carrying out part of the CCD R-band photometric observations and data reduction. Based on observations collected at the European Southern Observatory, Chile. IM acknowledges the receipt of a fellowship within the CRA-OAP-IAC agreement. This research has been partly supported by ASI contracts ARS-99-75, MURST grants Cofin-98-02-32, Cofin-0002036 and EC TMR Network programme (FMRX-CT96-0068).
References
- [2001] Alexander D.M. et al., 2001, ApJ, 554, 18
- [1999] Altieri B. et al., 1999, A&A, 343, L65
- [1993] Antonucci R., 1993, ARA&A, 31, 473
- [1999] Aussel H., Cesarsky C., Elbaz D., Starck J.L., 1999, A&A 342, 313
- [1999] Boyle B.J., Shanks T., Croom S.M. , Smith R.J., Miller L., Loaring N., Heymans C., 2000, MNRAS, 317, 1014
- [1994] Elvis M. et al., 1994, ApJS, 95, 1
- [1987] Fasano G., Franceschini A., 1987, MNRAS, 225, 155
- [1998] Flores H. et al., 1999, ApJ 517, 148
- [1999] Granato G., Danese L., Franceschini A., 1997, ApJ, 486, 147
- [1999] Gruppioni C. et al., 1999, MNRAS, 395, 297
- [2002] Gruppioni C. et al., 2002, MNRAS submitted
- [1998] Hauser M.G. etal., 1998, ApJ, 508, 25
- [2001] Hauser M.G., Dwek E., 2001, ARA&A, 39, 249
- [1976] Lampton M., Magon B., Bowyer S. 1976, ApJ, 207, 894
- [1980] Lang K.R., 1980, Astrophysical Formulae (Berlin:Springer)
- [2001] Lari C., Pozzi F., Gruppioni C. et al., 2001, MNRAS, 325, 1173
- [1997] La Franca F., Cristiani S. 1997, AJ, 113, 1517
- [2001] La Franca F. et al., 2002, ApJ, in press (astro-ph/0112455)
- [1991] Lawrance A., 1991, MNRAS, 252, 586
- [1995] Maiolino R., Rieke G.H., 1995, ApJ, 454, 95
- [1983] Marshall H.L., Avni Y., Tananbaum H., Zamorani G., 1983, ApJ, 269, 35
- [2000] Miyaji T., Hasinger G., Schmidt M., 2000, A&A, 353, 25
- [1991] Moshir M. et al., 1991, Explanatory Supplement to the IRAS Faint Source Survey, Version 2 (Pasadena: JPL)
- [1998] Natali F., Giallongo E., Cristiani S., La Franca F., 1998, AJ, 115, 397
- [1983] Peacock J. A., 1983, MNRAS, 202, 615
- [2000] Oliver S. et al., 2000, MNRAS, 316, 749
- [2001] Oliver S. et al., 2002, MNRAS, in press (astro-ph/0201506)
- [1993] Rush B., Malkan M.A., Spinoglio L., 1993, ApJS, 89, 1
- [2000] Serjeant S. et al., 2000, MNRAS, 316, 768S
- [1995] Urry C.M., Padovani P., 1995, PASP, 107, 803
- [2001] Xu C., Lonsdale C.J., Shupe D.L., O’Linger J., Masci F., 2001, ApJ, 562, 179