The Expected Properties of Dark Lenses
Abstract
We investigate the properties of multiple-image gravitational lens systems formed by dark matter halos. Both the Navarro-Frenk-White (NFW) and Moore et al. mass profiles are considered, and the effects of quadrupole perturbations to the lensing potential are taken into account. The systems produced by dark halos exhibit two generic properties that serve as powerful benchmarks for scrutinizing individual lens candidates: small flux ratios between the two brightest images in triples, and detectable odd images. In contrast, most currently ambiguous quasar pairs consist of two components with flux ratios 3:1. Such systems are statistical outliers in the expected distribution of dark lenses, and are therefore likely to be binary quasars.
1 Introduction
Observational evidence indicates that virtually all galaxies are embedded in dark matter halos, but do all halos host galaxies? Differences in the slope of the mass function for galaxies (e.g., Blanton et al. 2001) and dark halos (Press & Schechter 1974) suggest that a substantial fraction of halos may be empty, particularly at lower masses (e.g., Nagamine et al. 2001). Because cold dark matter (CDM) simulations predict cuspy halos (e.g., Navarro, Frenk & White 1997; Moore et al. 1999b; Jing & Suto 2000) that are sufficiently concentrated to multiply image background sources (Li & Ostriker 2002; Wyithe, Turner & Spergel 2001), strong gravitational lensing may be a powerful tool for detecting empty dark matter halos.
The identification of gravitational lens candidates is based on the presence of two or more closely-separated quasars at the same redshift. In cases where a galaxy, group or cluster is responsible for the multiple imaging, the lens hypothesis can be unambiguously confirmed by directly detecting the lensing mass through optical or infrared observations. This is clearly not possible for dark lenses. A thorough investigation of the quasar components is therefore necessary to determine whether a system is a genuine dark lens, or a pair of physically distinct quasars. The lensing hypothesis can be robustly rejected by finding some spectral or photometric property that the quasars do not share in common. For example, a pair with only one radio-bright component (an system, see Kochanek, Falco & Muñoz 1999) is inconsistent with gravitational lensing, and must therefore be a binary quasar. The inability to uncover differences in the quasars is not compelling evidence for lensing, however, as similarities can be at least partially attributed to the common formation history and cosmic environment of binaries. Unless the presence of three or more quasar components makes the lensing identification obvious, a measurement of the time delay or a detection of correlated milliarcsecond-scale radio substructure would likely be necessary to prove that a system is a dark lens.
A number of wide-separation () quasar pairs with no detectable lensing mass have been reported (e.g., Hawkins 1997; Mortlock, Webster & Francis 1999), and their true nature has been the subject of continuing debate. Several of the quasar pairs are systems (e.g., MGC 2214+3550; Muñoz et al. 1998), and therefore binaries. For others the lensing hypothesis has been rejected based on incompatible spectral line widths (e.g., CTQ 839; Morgan et al. 2000) or X-ray properties (e.g., Q2345+007; Green et al. 2002). Yet, there exist systems for which the identification remains ambiguous. Statistical arguments suggest that most of these pairs are likely to be binary quasars (Kochanek et al. 1999). The scarcity of radio-bright/radio-bright dark lens candidates is particularly difficult to reconcile with a sample dominated by lenses, considering how many radio lenses have been discovered. Still, the existence of several dark lenses is allowed by statistical constraints, and such arguments cannot determine the nature of any one source. It is therefore desirable to find additional criteria by which to scrutinize individual dark lens candidates.
Most studies of strong gravitational lensing by dark matter halos have focussed on their contribution to the optical depth (Keeton & Madau 2001; Li & Ostriker 2002; Sarbu, Rusin & Ma 2001), rather than the properties of the lens systems produced. This paper bridges the gap, and will serve as a ’field guide’ for dark lenses. In §2 we investigate lenses formed by plausible models of dark halos, quantifying the distribution of magnification ratios between the two brightest images in triples, as well as the relative flux of the third image. In §3 current dark lens candidates are compared to our model predictions. Section 4 summarizes our findings and discusses their implications.
2 Predictions for Dark Lens Models
Numerical simulations predict CDM halos with cuspy but shallow inner mass profiles ( at small radii, where ; Navarro et al. 1997; Moore et al. 1999b). This result applies to halos in their “primordial” state. Cooling baryons will modify the dark matter profile through adiabatic compression (e.g., Blumenthal et al. 1986; Keeton 2001; Kochanek & White 2001), producing the more centrally-concentrated mass distributions that are characteristic of lens galaxies (e.g., Cohn et al. 2001; Kochanek 1995a; Rusin & Ma 2001). Inversely, if the baryons have not cooled, the dark matter halo is expected to retain its primordial profile (e.g., Navarro, Frenk & White 1995; Eke, Navarro & Frenk 1998). Star formation should be greatly inhibited in such halos, so the mass distributions will be truly “dark” (except perhaps at X-ray wavelengths). The existence of a characteristic mass scale separating cooled halos with nearly isothermal profiles (efficient lenses) and non-cooled halos with primordial dark matter profiles (inefficient lenses; e.g., Wyithe et al. 2001) is vital for converting the halo mass function into the observed distribution of lensed image separations (Porciani & Madau 2000; Kochanek & White 2001). Specifically, halos above this scale must have a much lower cross section per unit mass to account for the sharp decline in observed lenses with . The necessary mass scale () agrees well with the predictions of semi-analytic cooling models (e.g., Cole et al. 2000). To produce arcsecond-scale () lens systems, halos that retain their shallow primordial profiles require virial masses (e.g., Li & Ostriker 2002) – larger than the cooling scale. Consequently, the formation of observable multiple-image lenses by uncooled and largely unmodified CDM halos is self-consistent. Note, however, that the lack of star formation may not imply an uncompressed halo. In particular, baryons in halos with can cool into a disk that is stable to star formation if the spin parameter is high (Jimenez et al. 1997). Such halos would be both dark and concentrated. But even if the resulting mass profile were as steep as isothermal, the limit of corresponds to a lensed image separation of less than an arcsecond (e.g., Li & Ostriker 2002). The above arguments therefore suggest that arcsecond-scale dark lens systems are likely to be produced by shallow CDM mass profiles.
This paper investigates two popular models for cuspy CDM halos: the Navarro-Frenk-White (NFW; 1997) mass distribution (), and the steeper () profile of Moore et al. (1999b). While the inner profile slope may be mass dependent (Jing & Suto 2000), the above models span the typical range of values found. Spherical mass models are considered for computational simplicity, but we place them in constant shear fields (magnitude ) to mimic the effects of deflector ellipticity and environmental perturbations. We focus on two/three-image configurations, which we term “triples,” because these are the systems most likely to be confused with binary quasars. The deflector models are analyzed by numerically solving for the image positions and magnifications () of point sources placed on a uniform grid behind the lens. The distributions of two quantities are then extracted: the magnification ratio between the two brightest images (), and that between the brightest and third brightest images ().
The properties of dark lenses differ significantly from those of the more concentrated, nearly isothermal () galaxy lenses. Specifically, the magnification ratio distributions are very sensitive to the size of the radial critical curve, which increases as the slope of the inner mass profile is decreased from isothermal (Blandford & Kochanek 1987; Wallington & Narayan 1993; see Kormann, Schneider & Bartelmann 1994 for plots). First, source positions enclosed by only the radial caustic produce triples in which the second (negative-parity) image resides outside of the radial critical curve; the central (positive-parity) image resides within it. Large radial critical curves imply that the outer images tend to form at similar distances from the lens center, resulting in similar magnifications and small primary flux ratios . The third image can also form farther from the lens center, away from the high central convergence that would otherwise strongly demagnify it. Consequently, this image carries more flux, leading to smaller values of . Second, the critical structures of shallower mass profiles are more susceptible to shear (e.g., Wallington & Narayan 1993), which allows for the production of naked cusp configurations. Here, source positions enclosed by only the tangential caustic are lensed into three images on the same side of the deflector, each with similar magnification (e.g., Kormann et al. 1994). This class of triples is characterized by very small magnification ratios and bright third images, thereby reinforcing the above trends.
Flux ratio distributions are affected by magnification bias, which favors the detection of more magnified lens systems (e.g., Turner 1980). The bias factor depends on the lens model, the number-flux relation of the sources, and the method of finding lenses. A full accounting of magnification bias is beyond the scope of this paper. However, we illustrate the bias effect by simply weighting each lens system generated on the source plane grid by its total magnification (). For example, the biased fraction of lenses with is , where = 1 if for a source at , and 0 otherwise. The integral is evaluated over the three-image caustic regions. This scheme mimics the bias produced by the differential number-flux relation , which closely approximates the population of compact radio sources (Rusin & Tegmark 2001). Faint optical quasars have a much shallower luminosity function, and hence they are nearly unbiased (Kochanek 1996). Bright optical quasars are more strongly biased, as the luminosity function is very steep in that regime.
2.1 NFW Profile
The NFW model is described by the mass density
| (2-1) |
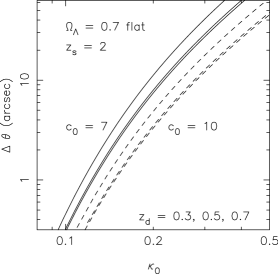
where , is the radius within which the average density is 200 times the critical density at redshift , and is the concentration parameter. For a flat cosmology, (e.g., Bartelmann et al. 1998) and evolves as (e.g., Bullock et al. 2001). The density amplitude is . The spherical NFW profile has an analytic projected surface density and deflection angle (Bartelmann 1996). Its lensing properties depend on the parameter , where is the critical surface mass density. The angular image splitting scale () is set by the size of the tangential critical curve. In Fig. 1, is plotted as a function of for some typical redshifts and concentrations.
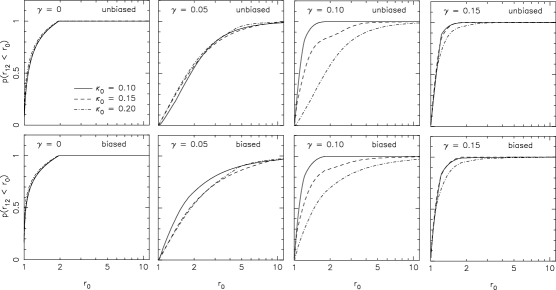
The fractions of NFW triples with a magnification ratio between the two brightest images of , and are plotted in Fig. 2. For clarity, we plot the cumulative distributions of for , , and in Fig. 3. Note that magnification bias only slightly alters the values, and does not affect the general trends. For a spherically-symmetric potential (), almost all triples have . Shear perturbations create a tangential caustic on the source plane, affecting the distribution of magnification ratios. If the cusp of the tangential caustic resides within the radial caustic, a single highly magnified image results for sources near the cusp. Such systems can have large , and therefore the fraction of lenses with less than some nominal value is decreased. If the cusp is not enclosed by the radial caustic, however, the deflector can produce naked cusp configurations. Such systems have , and therefore the fraction of lenses with small is increased. Deflectors with smaller are more susceptible to shear perturbations, as the ratio of the radial to tangential critical curve increases with decreasing (Bartelmann 1996). Hence, for a fixed , the fraction of systems with small rises sharply below that at which naked cusp configurations begin to dominate. This effect is clearly seen in Figs. 2 and 3. The conclusion is that NFW dark lenses with (using the conversion in Fig. 1) are expected to have flux ratios very close to unity if either the potentials are nearly spherical, or have moderate to large shear perturbations (). But even in the intermediate regime, systems with high flux ratios are still rare. For , nearly half of arcsecond-scale NFW lenses will have , and almost all will have (Fig. 2). In comparison, of the lenses produced by a singular isothermal sphere, 11% have and 44% have .
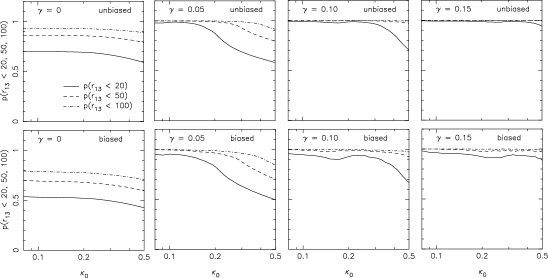
The relative magnification of the third image () is examined in Figs. 4 and 5. Plotted in Fig. 4 are the fractions of NFW triples with , and . Plotted in Fig. 5 are the cumulative distributions of for , , and . The third image tends to be very bright and easily detectable, independent of or . In almost all cases, at least half of the triples will have . The third image is even more detectable in regions of parameter space dominated by naked cusps, as these systems have three images of very similar magnification.
2.2 Moore Profile
The model of Moore et al. (1999b) is described by the mass density
| (2-2) |
where , and is a factor of a few smaller than the NFW value. There is no analytic form for the projected surface density or deflection angle. Typical input parameters, however, produce lensed images at radii that are much smaller than the arcminute-scale angular break radius derived from . Because lenses will be dominated by the inner cusp, the Moore profile can be well represented by the power-law mass density . The critical structures of power-law models scale in a self-similar manner with the profile normalization, and hence the lensing properties are normalization-independent. Trial analyses of the real Moore profile demonstrate that it is well approximated by the power law and exhibits the expected normalization behavior. We therefore present results for the singular power-law model, which were calculated using the deflection angles and magnification matrices derived by Barkana (1998) and implemented in the FASTELL software package.
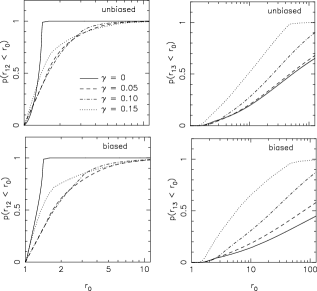
Plotted in Fig. 6 are the cumulative distributions of and for the Moore profile. The unbiased fractions of Moore triples with , and are, respectively, , and for ; , and for ; , and for ; and , and for . The unbiased fractions of Moore triples with , and are, respectively, , and for ; , and for ; , and for , and , and for . The largest difference between the Moore and NFW predictions for arcsecond-scale triples is due to the naked cusp configurations. The tangential caustic is less prominent for a Moore model than it is for an NFW model in the same shear field. Consequently, while naked cusps comprise a significant fraction of NFW triples for small shears (), they do not contribute at all to the Moore statistics until the shear grows large (). But despite this effect, dark halos described by the steeper mass profile of Moore et al. still produce lensed triples with small magnification ratios and relatively bright third images.
3 Comparison to Current Candidates
A number of dark lens candidates have been reported in the literature, and their true nature is still a matter of vigorous debate (e.g., Hawkins 1997; Kochanek et al. 1999; Mortlock et al. 1999; Peng et al. 1999). Table 1 lists nine ambiguous quasar pairs. We have excluded those systems for which the lensing hypothesis has been rejected based on gross spectral or photometric differences between the components. Technically Q2345+007 (Weedman et al. 1982) is no longer ambiguous, as recent X-ray observations have shown it to be a binary (Green et al. 2002), but we include it for historical reasons. Below we determine whether the component fluxes of these quasar pairs are compatible with the dark lens hypothesis.
First, dark lens candidates typically consist of two, not three, detectable images. Bounds on additional images in these systems are listed in Table 1. The absence of third images down to these levels () would be very unlikely in a candidate sample dominated by lenses, particularly if dark halos were best approximated by an NFW model (Figs. 4 and 5). Second, the observed flux ratios in many of the ambiguous pairs are significantly larger than unity. Three of the nine pairs have , which Figs. 2, 3 and 6 show to be virtually impossible for genuine dark lenses. However, even the quasar pairs with moderate flux ratios () would be uncommon in the dark lens hypothesis. Note that the paucity of small flux ratio pairs cannot be due to the selection function, as their identification is always favored (Kochanek 1995b).
Quantitative results are presented in Table 2. For each quasar pair and model, we calculate the unbiased fraction of triples that have a primary magnification ratio smaller than the observed value, or a third image brighter than the listed bound. Fractions with the third image constraint excluded are also shown. Each of the systems is an outlier in the predicted dark lens distributions, particularly those for the NFW profile. Five of the nine pairs have in all eight models studied. These pairs are strongly incompatible with dark lensing. Three other pairs have in each of the models. QJ0240–343, with an observed flux ratio of , is moderately compatible with one of the four Moore models, but no NFW models. Magnification bias has little effect on the above results. In conclusion, while no quasar pair can be absolutely rejected as a dark lens based on probability arguments alone, the above analysis demonstrates that most current candidates fail to exhibit the properties expected for dark lenses. Therefore, these pairs are likely to be binary quasars, as suggested by Kochanek et al. (1999).
The only system that meets the qualitative dark lens criteria is APM 08279+5255 (Ibata et al. 1999), which consists of three quasar components with a maximum separation of . The outer two components carry nearly equal flux (), and the central component is very bright (). The striking similarity of the quasar colors and the presence of a third compact component means that APM 08279+5255 is almost certainly a lens. No lensing galaxy has yet been detected, but this is not a surprise considering the brightness of the quasars (). Radio observations have recently detected line emission offset from the position of the three lensed components (Lewis et al. 2002), which suggests imaging by a naked cusp. Because third images are rare for the steep mass profiles of galaxy lenses (Wallington & Narayan 1993; Rusin & Ma 2001), the unique morphology of APM 08279+5255 opens the possibility of strong lensing by a shallow dark matter halo. Assuming that the system is a standard triple (source inside the radial caustic), Muñoz, Kochanek & Keeton (2001) have demonstrated that a cuspy profile even shallower than NFW is necessary to reproduce the image data. Our Monte Carlo tests find that the flux ratios of APM 08279+5255 are moderately consistent with an NFW model normalized to a present-day concentration of , but only if the quadrupole is small (). Naked cusps dominate for larger shears, and such systems tend to have values of and much smaller than the observed ratios. In contrast, while Moore triples commonly form with (Fig. 6), the third image tends to be significantly fainter. Hence, while APM 08279+5255 exhibits the qualitative properties expected for a dark lens, none of the standard models provide a particularly good quantitative match to the system.
4 Discussion
This paper has investigated the properties of gravitational lens systems produced by dark matter halos. While galaxy lenses form with a wide range of magnification ratios and typically have undetectable central images, dark lenses are expected to have very small magnification ratios and prominent third images. These characteristics result from the shallow inner mass profiles of dark halos, as derived by N-body simulations. Relative component fluxes in candidate dark lens systems are powerful benchmarks for evaluating their viability. The majority of current candidates have flux ratios that differ significantly from unity, and do not feature any third image. These sources therefore fail to exhibit the expected properties of genuine dark lenses. While the above arguments cannot absolutely reject any source as a dark lens, they offer further evidence that binary quasars dominate the sample. The only system that meets the qualitative dark lens criteria is APM 08279+5255 (Ibata et al. 1999).
There are several possible criticisms of the results presented in this paper. First, the dark matter profiles were assumed to be smooth, despite the fact that simulations predict copious substructure in CDM halos (e.g., Moore et al. 1999a). Substructure can alter the magnifications of individual lensed images (Mao & Schneider 1998), an effect that may have already been detected (Dalal & Kochanek 2002). However, Monte Carlo tests indicate that substructure tends to decrease magnification ratios in doubles (Metcalf & Madau 2001), at least for isothermal profiles. If this result can be extrapolated to the shallow halo profiles, then high flux ratio dark lenses may be even rarer than we predict. Second, we assumed that dark lenses will have concentration parameters similar to those of the general halo population. The simulations of Bullock et al. (2001), for example, predict a range of halo concentrations, and lensing will tend to select more concentrated mass distributions because of their larger cross sections. Will this make the gravitational potentials of dark lenses significantly steeper? Consider NFW halos with concentration parameters a factor of three larger than their typical values. There are not many halos found in this range (Bullock et al. 2001). Lenses with then correspond to normalizations of (). Because Figs. 2 and 4 show that such lenses still have very small primary flux ratios and bright third images, “concentration bias” should not alter our general conclusions. Finally, one might suggest that the measured flux ratios may not be good estimators of the true magnification ratios if these pairs were real lenses, because of either differential extinction, microlensing, or a conspiracy between source variability and time delays. This is unlikely to be a major concern, however. Similarity between the quasar colors (e.g., Tyson et al. 1986; Hewett et al. 1998), often cited in support of lensing, argues against the extinction hypothesis. Furthermore, the relatively small levels of variation observed in the flux ratios – in some cases over a baseline of more than a decade – suggest that time delays and microlensing are not significantly clouding the measurements.
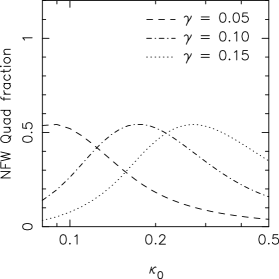
While we have focussed on triples, five-image lens systems are expected to play an important role in dark lensing. Small quadrupole perturbations will result in a large tangential caustic for shallow profiles, thereby producing many quads. Plotted in Fig. 7 are the unbiased fractions of five-image lenses formed by the NFW model. More than half of NFW lenses may be quads, even for very small shears. These fractions will be further increased by magnification bias. Using the Moore profile, the unbiased quad fractions are , and for , and , respectively. The absence of quads makes the current dark lens candidate sample even more peculiar.
Dark lenses would be powerful probes of the mass distributions in primordial dark matter halos – assuming they can be found. Unfortunately, the shallow profiles mean that CDM halos are very inefficient lenses (e.g., Wyithe et al. 2001). Cases of strong lensing are thus expected to be rare, even if empty halos were abundant. Consequently, the best hope for uncovering dark lenses are large systematic quasar surveys. None were found in the Cosmic Lens All-Sky Survey (e.g., Myers et al. 1999; 2002), as lens galaxies have been identified in virtually all of the systems (Jackson et al. 1998; Browne et al. 2002), and radio spectral data strongly suggest that the quasar pair B0827+525 (Koopmans et al. 2000) is a physical binary. The Sloan Digital Sky Survey, however, offers new hope in the search. The expected properties of dark lenses outlined in this paper should be a useful tool for critiquing any candidates identified therein.
References
- (1)
- (2) Barkana, R. 1998, ApJ, 502, 531
- (3)
- (4) Bartelmann, M. 1996, A&A, 313, 697
- (5)
- (6) Bartelmann, M., Huss, A., Colberg, J.M., Jenkins, A., & Pearce, F.R. 1998, A&A, 330, 1
- (7)
- (8) Blandford, R.D., & Kochanek, C.S. 1987, ApJ, 321, 658
- (9)
- (10) Blanton, M.R., et al. 2001, AJ, 121, 2358
- (11)
- (12) Blumenthal, G.R., Faber, S.M., Flores, R., & Primack, J.R. 1986, ApJ, 301, 27
- (13)
- (14) Browne, I.W.A., et al. 2002, MNRAS, submitted
- (15)
- (16) Bullock, J.S., Kolatt, T.S., Sigad, Y., Somerville, R.S., Kravtsov, A.V., Klypin, A.A., Primack, J.R., & Dekel, A. 2001, MNRAS, 321, 559
- (17)
- (18) Cohn, J.D., Kochanek, C.S., McLeod, B.A., & Keeton, C.R. 2001, ApJ, 554, 1216
- (19)
- (20) Cole, S., Lacey, C.G., Baugh, C.M, & Frenk, C.S. 2000, MNRAS, 319, 168
- (21)
- (22) Dalal, N., & Kochanek, C.S. 2002, ApJ, in press (astro-ph/0111456)
- (23)
- (24) Djorgovski, S., & Spinrad, H. 1984, ApJL, 282, L1
- (25)
- (26) Eke, V.R., Navarro, J.F., & Frenk, C.S. 1998, ApJ, 503, 569
- (27)
- (28) Green, P.J., et al. 2002, ApJ, in press (astro-ph/0202081)
- (29)
- (30) Hawkins, M.R.S. 1997, A&A, 328L, 25
- (31)
- (32) Hawkins, M.R.S., Clements, D., Fried, J.W., Heavens, A.F., Veron, P., Minty, E.M., & Van Der Werf, P. 1997, MNRAS, 291, 811
- (33)
- (34) Hewett, P.C., Webster, R.L.. Harding, M.E., Jedrzejewski, R.J., Foltz, C.B., Chaffee, F.H., Irwin, M.J., & Le Fevre, O. 1989, ApJL, 346, L61
- (35)
- (36) Hewett, P.C., Foltz, C.B., Harding, M.E., & Lewis, G.F. 1998, AJ, 115, 383
- (37)
- (38) Hewitt, J.N., et al. 1987, ApJ, 321, 706
- (39)
- (40) Ibata, R.A., Lewis, G.F., Irwin, M.J., Lehár, J., & Totten, E.J. 1999, AJ, 118, 1922
- (41)
- (42) Jackson, N., Helbig, P., Browne, I., Fassnacht, C.D., Koopmans, L., Marlow, D., & Wilkinson, P.N. 1998, A&A, 334L, 33
- (43)
- (44) Jimenez, R., Heavens, A.F., Hawkins, M.R.S., & Padoan, P. 1997, MNRAS, 292L, 5
- (45)
- (46) Jing, Y.P., & Suto, Y. 2000, ApJL, 529, L69
- (47)
- (48) Keeton, C.R. 2001a, ApJ, 561, 46
- (49)
- (50) Keeton, C.R., & Madau, P. 2001, ApJL, 549, L25
- (51)
- (52) Kochanek, C.S. 1995a, ApJ, 445, 559
- (53)
- (54) Kochanek, C.S. 1995b, ApJ, 453, 545
- (55)
- (56) Kochanek, C.S. 1996, ApJ, 466, 638
- (57)
- (58) Kochanek, C.S., Falco, E.E., & Muñoz 1999, ApJ, 510, 590
- (59)
- (60) Kochanek, C.S., & White, M. 2001, ApJ, 559, 531
- (61)
- (62) Koopmans, L.V.E., et al. 2000, A&A, 361, 815
- (63)
- (64) Kormann, R., Schneider, P., & Bartelmann, M. 1994, A&A, 284, 285
- (65)
- (66) Lewis, G.F., Carilli, C., Papadopoulos, P., & Ivison, R.J. 2002, MNRAS, in press (astro-ph/0112263)
- (67)
- (68) Li, L.-X., & Ostriker, J.P. 2002, ApJ, 566, 652
- (69)
- (70) Mao, S., & Schneider, P. 1998, MNRAS, 295, 587
- (71)
- (72) Metcalf, R.B., & Madau, P. 2001, ApJ, 563, 9
- (73)
- (74) Meylan, G., & Djorgovski, S. 1989, ApJL, 338, L1
- (75)
- (76) Moore, B., Ghigna, S., Governato, F., Lake, G., Quinn, T., Stadel, J., & Tozzi, P. 1999a, ApJL, 524, L19
- (77)
- (78) Moore, B., Quinn, T., Governato, F., Stadel, J., & Lake, G. 1999b, MNRAS, 310, 1147
- (79)
- (80) Morgan, N.D., et al. 2000, AJ, 119, 1083
- (81)
- (82) Mortlock, D.J., Webster, R.L., & Francis, P.J. 1999, MNRAS, 309, 836
- (83)
- (84) Muñoz, J.A., Falco, E.E., Kochanek, C.S., Lehár, J., Herald, L.K., Fletcher, A.B., & Burke, B.F. 1998, ApJL, 492, L9
- (85)
- (86) Muñoz, J.A., Kochanek, C.S., & Keeton, C.R. 2001, ApJ, 558, 657
- (87)
- (88) Myers, S.T., et al. 1999, AJ, 117, 2565
- (89)
- (90) Myers, S.T., et al. 2002, AJ, submitted
- (91)
- (92) Nagamine, K., Fukugita, M., Cen, R., & Ostriker, J.P. 2001, MNRAS, 327L, 10
- (93)
- (94) Navarro, J.F., Frenk, C.S., & White, S.D.M. 1995, MNRAS, 275, 720
- (95)
- (96) Navarro, J.F., Frenk, C.S., & White, S.D.M. 1997, ApJ, 490, 493
- (97)
- (98) Peng, C.Y., et al. 1999, ApJ, 524, 572
- (99)
- (100) Porciani, C., & Madau, P. 2000, ApJ, 532, 679
- (101)
- (102) Press, W.H., & Schechter, P. 1974, ApJ, 187, 425
- (103)
- (104) Rusin, D., & Ma, C.-P. 2001, ApJL, 549, L33
- (105)
- (106) Rusin, D., & Tegmark, M. 2001, ApJ, 553, 709
- (107)
- (108) Sarbu, N., Rusin, D., & Ma, C.-P. 2001, ApJL, 561, L147
- (109)
- (110) Tinney, C.G. 1995, MNRAS, 277, 609
- (111)
- (112) Tyson, J.A., Seitzer, P., Weymann, R.J., & Foltz, C. 1986, ApJ, 91, 1274
- (113)
- (114) Turner, E.L. 1980, ApJL, 242, L135
- (115)
- (116) Wallington, S., & Narayan, R. 1993, ApJ, 403, 517
- (117)
- (118) Weedman, D.W., Weymann, R.J., Green, R.F., & Heckman, T.M. 1982, ApJL, 255, L5
- (119)
- (120) Wyithe, J.S.B., Turner, E.L., & Spergel, D.N. 2001, ApJ, 555, 504
- (121)
| Source | Type | Reference | |||||
|---|---|---|---|---|---|---|---|
| MG0023+171 | 2 | 0.95 | Hewitt et al. 1987 | ||||
| QJ0240–343 | 2 | 1.41 | Tinney 1995 | ||||
| B0827+525 | 2 | 2.06 | Koopmans et al. 2000 | ||||
| Q1120+0195 | 2 | 1.47 | Meylan & Djorgovski 1989 | ||||
| LBQS1429–008 | 2 | 2.08 | Hewett et al. 1989 | ||||
| Q1634+267 | 2 | 1.96 | Djorgovski & Spinrad 1984 | ||||
| Q2138–431 | 2 | 1.64 | Hawkins et al. 1997 | ||||
| LBQS2153–2056 | 2 | 1.85 | Hewett et al. 1998 | ||||
| Q2345+007 | 2 | 2.15 | Weedman et al. 1982 |
Note. — Listed for each pair are the number of quasar components (), radio-brightness classification, source redshift (), angular separation (), observed flux ratio (), bound on additional components (), and reference. Many of the parameters are taken from the tables of Peng et al. (1999) or Mortlock et al. (1999). Radio flux ratios are less susceptible to microlensing and extinction, and are used where available. Values of are from the listed references, except where noted. a 5 GHz measurement (optical ratio is ); b CfA-Arizona Space Telescope Lens Survey; c 8.4 GHz measurement; d updated value from Peng et al. (1999); e Tyson et al. (1986).
| NFW profile | Moore profile | |||||
|---|---|---|---|---|---|---|
| Source | ||||||
| MG0023+171 | 0.99 (0.99) | 1.00 (0.99) | 1.00 (1.00) | 1.00 (1.00) | 1.00 (1.00) | 0.99 (0.99) |
| QJ0240–343 | 1.00 (0.63) | 1.00 (0.65) | 1.00 (1.00) | 0.85 (0.74) | 0.96 (0.72) | 1.00 (0.78) |
| B0827+525 | 1.00 (0.76) | 1.00 (0.92) | 1.00 (1.00) | 0.91 (0.85) | 0.97 (0.86) | 1.00 (0.86) |
| Q1120+0195 | 1.00 (1.00) | 1.00 (1.00) | 1.00 (1.00) | 1.00 (1.00) | 1.00 (1.00) | 1.00 (1.00) |
| LBQS1429–008 | 1.00 (1.00) | 1.00 (1.00) | 1.00 (1.00) | 1.00 (1.00) | 1.00 (1.00) | 1.00 (1.00) |
| Q1634+267 | 1.00 (0.83) | 1.00 (0.92) | 1.00 (1.00) | 0.92 (0.90) | 0.96 (0.93) | 0.99 (0.90) |
| Q2138–431 | 1.00 (0.80) | 1.00 (0.87) | 1.00 (1.00) | 0.91 (0.87) | 0.96 (0.90) | 0.99 (0.88) |
| LBQS2153–2056 | 1.00 (1.00) | 1.00 (0.99) | 1.00 (1.00) | 1.00 (1.00) | 1.00 (1.00) | 1.00 (1.00) |
| Q2345+007 | 1.00 (0.90) | 1.00 (0.91) | 1.00 (1.00) | 0.95 (0.94) | 0.98 (0.96) | 1.00 (0.93) |
Note. — Listed for each quasar pair and model are the predicted fractions of triples and, in parentheses, . These probabilities are () for all pairs in spherical () models. For the NFW profile, the fractions were calculated by deriving from the angular splitting scale , assuming a lens redshift , a source redshift (measured redshifts were ignored for simplicity), a present-day concentration parameter , and a flat cosmology. Varying these parameters within their reasonable ranges has a negligible effect on the results. All the model predictions are unbiased. Including bias has little qualitative impact on the derived fractions.
 |
 |
 |
 |
 |
 |
 |