Development of Hydrodynamic Instability in the Intergalactic Medium of the Merging Cluster of Galaxies A3667
Abstract
A3667, a spectacular merger cluster, was observed by Chandra twice. In this paper we review the main results of the analysis of these observations. In particular we show evidence for the presence in the cluster of a 300 kpc Kelvin-Helmholtz hydrodynamic instability. We discuss the development of such instability and the structure of the intracluster magnetic filed in light of a self-consistent cluster dynamical model.
keywords:
galaxies: clusters: general — galaxies: clusters: individual (A3667) — magnetic fields — shock waves — intergalactic medium — X-rays: galaxies: cluster — instabilities — MHD — turbulence1 Introduction
The central region of A3667, a nearby, hot merging cluster (Markevitch, Sarazin, & Vikhlinin 1999), was observed twice by Chandra in Sept 22, 1999 and in Sept 9, 2000. The analysis of the first observation by Vikhlinin, Markevitch & Murray (2001a,b) reveals the presence of a prominent 500 kpc-long density discontinuity (“cold front”) in the cluster atmosphere. This allowed the authors to draw a cluster dynamical model and to put important constraining on the structure of the intracluster magnetic field. A subsequent joint analysis of the two Chandra pointings of A3667 by Mazzotta, Fusco-Femiano, Vikhlinin (2002) revealed the presence of two new interesting filamentary structures in the cluster intergalactic medium. These structures are interpreted as a well-developed 300 kpc Kelvin-Helmholtz instability.
Here we review the main results of the previous work. The structure of the paper is as follow. In paragraph 2 we present the X-ray image and the temperature map of the cluster. In paragraph 3 we show the properties of the observed features by studying their surface brightness and temperature profiles. In paragraph 4 we discuss the data. We start by presenting the cluster dynamical model in paragraph 4.1. Then in paragraph 4.2 we show that, in a narrow region close to the cold front, the data require the presence a well structured magnetic field. We discuss this aspect and we show that the proposed model naturally accounts for it. We conclude by discussing the implications of the proposed model for the development of hydrodynamic instabilities.
In the following we skip the details of the data analysis and we refer to the original papers (Vikhlinin et al. 2001a, Mazzotta et al. 2002). We use km s-1 Mpc-1 and , which corresponds to the linear scale of 1.46 kpc/arcsec at the cluster redshift .
2 X-ray image and temperature map
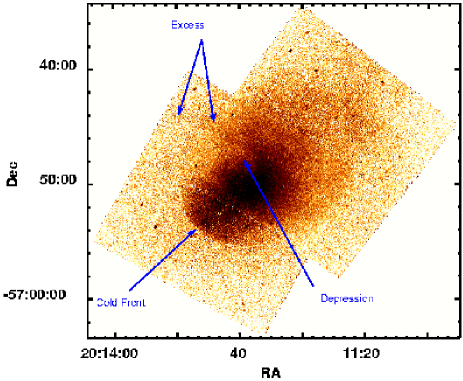
In Fig. 1 we show the background subtracted and vignetting corrected image of the central region of A3667 obtained combining the two Chandra pointings. The image is extracted in the 0.7-4 keV band to minimize the relative contribution of the cosmic background and thereby to maximize the signal-to-noise ratio. The X-ray image reveals three prominent features:
i) a sharp surface brightness edge spanning 500 kpc to the South-East;
ii) a kpc-long and kpc-wide filamentary X-ray excess extending toward the east to the chip boundary;
iii) a kpc-long and kpc-wide filamentary X-ray depression that develops toward the west inside the cluster center.
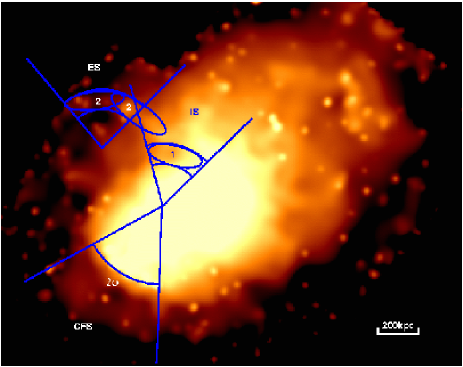
All the three features are also evident in the smoothed image reported in Fig. 2. To derive the surface brightness and temperature profiles for each feature (see § 3, below), three different sectors have been identified. Each sector originate near the curvature center of the corresponding feature and contains the feature itself.
For convenience, in the following, we refer to the sector containing the surface brightness edge as the cold front sector (CFS) and to the sectors containing the excess and the depression as the External Sector (ES) and the Internal Sector (IS), respectively. To facilitate the identification of the features in the temperature map we traced the X-ray depression and excess using two ellipsoid regions indicated by the cardinal numbers 1 and 2, respectively.
In Fig. 3 we report the temperature map with overlaid X-ray surface brightness contours. The temperature map shows a quite complex structure far from being isothermal. Moreover, we notice that:
a) the gas in the brighter side of the edge is cooler than the gas in the fainter side;
b) the temperature of the X-ray excess (region 2) is lower than in the nearby regions;
c) the temperature of the X-ray depression (region 1) is higher than in the nearby regions.
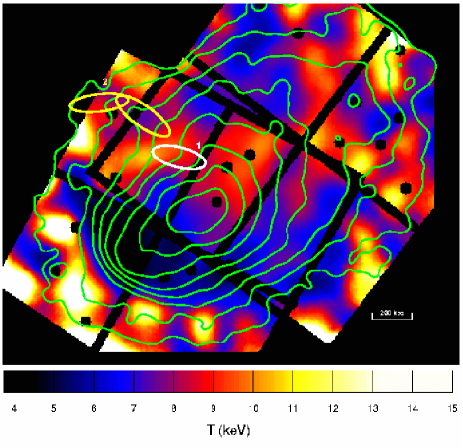
We also note that, in the overlapping region, the Chandra temperature map qualitatively agrees with the coarser ASCA temperature map shown by Markevitch et al. (1999).
3 Surface brightness and temperature profiles
In the following we study the physical properties of the features by extracting the surface brightness and the temperature profiles from the sectors defined in the previous paragraph.
3.1 Cold front
In Fig. 4a we report the surface brightness profile extracted from the CFS. The figure clearly shows that the surface brightness profile increases sharply by a factor 2 within a very small region of 40-80 kpc. This strongly indicates that the gas density profile is discontinuous. Vikhlinin et al. (2001a), modeled the observed surface brightness profile with a denser spheroidal gas cloud embedded in a more rarefied cluster-like atmosphere described by a -profile. They find, indeed, that the surface brightness profile is well fitted by this model and that the gas discontinuity at the edge is a factor .
In Fig. 4b we report the temperature profile extracted from the same region. It shows a clear temperature jump at the surface brightness edge. Indeed, as we cross the edge from the outside, the temperature changes abruptly from approximately 8 keV to 4 keV. We stress the fact that although gas density discontinuities can be produced by shock fronts, the observed temperature jump is not consistent with this hypothesis. In fact, the observed temperature jump goes in the opposite direction with respect to what expected in a shock front. Thus, the feature we are observing is produced by a new phenomenon which has been called “Cold Front” (Vikhlinin et al. 2001a).
The derived density and temperature jumps lead to a significant pressure jump. In particular one can calculate that the pressure outside the edge is approximately a factor 2 lower than the pressure of the gas just inside the edge.

3.2 X-ray filaments
For each of the two filamentary structures, we extracted both the surface brightness and the temperature profiles. The profiles are shown in the left and the right column of Fig. 5 for the ES and IS, respectively. The ES profiles show that the filamentary excess produces a significant enhancement of the surface brightness profile and corresponds to a decrement in the temperature profile. On the other hand, the IS profiles shows that the filamentary depression produces a significant decrement of the surface brightness profile corresponding to an increment in the temperature profile. This suggests that the excess is a colder, denser filamentary gas structure embedded in the more diffuse and hotter external cluster atmosphere while the depression is a hotter, rarefied filament of gas embedded in the denser and colder cluster center. We also notice that, while the temperature of the X-ray filamentary excess is consistent with the temperature of gas surrounding the filamentary depression, the temperature of the X-ray filamentary depression is consistent with the temperature of gas surrounding the filamentary excess. The observed features suggest that some dense cold gas is “striped out” into the hotter cluster atmosphere as well as some rarefied hot gas from larger radii penetrates into the cluster core.

4 Discussion
In the previous paragraph we showed evidence for the presence of a cold front and two filamentary structures in the atmosphere of A3667. These features are particularly interesting as them allow us to understand the cluster dynamic and the undergoing intracluster physical processes. In the following we address some of these topics discussing a self-consistent dynamic model that accounts for all the properties of the observed features.
4.1 Cold front and cluster dynamics
A3667 is a know merger cluster. The ROSAT image show that, at any radius, the cluster X-ray emission is elongated in the direction from North-West to South-East (see e.g. Markevitch et al. 1999). From Fig. 1 we can see that the elongation of the diffuse X-ray emission is almost perpendicular to the observed cold front. It appears natural, then, to conclude that the cold front is simply produced by the motion of one merging subclump. In this scenario the observed cold front would be the contact surface of a dense cold gas cloud that moves from Noth-West to South-East into the hotter rarefied cluster atmosphere (Vikhlinin et al. 2001a). The pressure inside the cloud would then be higher than the gas outside as it is subject to ram pressure in addition to the thermal pressure of the cluster atmosphere. Using the pressure jump at the front, Vikhlinin et al. (2001a) determined the motion speed and found the near-sonic velocity (here is the speed of sound in the hot ambient gas).
Fig. 4 shows that the surface brightness of the front is particularly sharp. This gives us two other important pieces of information:
a) the gas cloud is moving in plane close to the plane of the sky. In fact, because of projection effect, a large departure from this situation would make the front to appear smoother (Mazzotta et al 2001). This is also supported by the fact that the difference in line-of-sight velocity of the two dominant galaxies is only 120 km s-1 (Katgert et al. 1998), indeed much smaller than the estimated speed of the cloud;
b) the front width is particularly small. Vikhlinin et al. (2001a) measured the front width and found that it is kpc, indeed smaller than the Coulomb mean free path of the intra-cluster gas. This means that, at least in the direction perpendicular to the front, transport processes, and thus thermal conduction, are highly suppressed in all the narrow region containing the front (see also Ettori and Fabian 2001). Most likely such a suppression is induced by the presence of a magnetic field parallel to the front as we are going to discuss in the next paragraph.
4.2 Magnetic field structure
Magnetic fields in a highly ionized plasma act to suppress transport processes in the direction perpendicular to the magnetic field lines. In order for transport processes to be effectively suppressed on a scale comparable to the front length [as required by point b) in paragraph 4.1] we should either have that:
i) the magnetic filed lines are highly tangled (see e.g. Rechester & Rosenbhluth 1978);
ii) there is a large-scale magnetic field perpendicular to the direction in which diffusion is to occur.
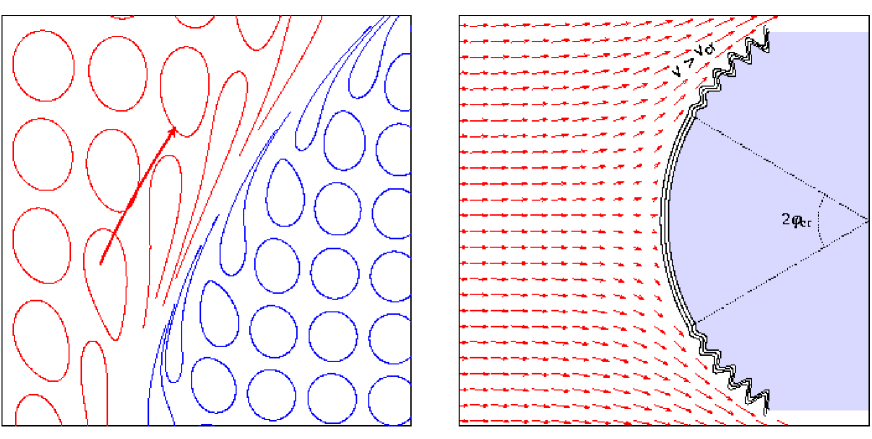
Although hypothesis i) has been invoked by many authors to justify the needs for suppression of thermal conduction in clusters, in a recent paper Narayan & Medvedev (2001) show that, if the medium is turbulent, this is not longer true. Indeed, thermal conduction in a highly tangled magnetized turbulent plasma is almost as efficient as in a non magnetized plasma. Therefore, in the case of A3667, hypothesis ii) appears to be more likely to explain the suppression of transport processes at the front. Vikhlinin et al. (2001b) suggested that, in a narrow boundary region between the two moving gas layers, the required magnetic field may naturally arise through a process schematically shown in Fig. 6. During the gas cloud motion, the surrounding gas flows around the cold cloud. The inflowing gas slows down near the stagnation point at the leading edge of the sphere but then reaccelerates to high velocities as it is squeezed to the sides by new portions of the inflowing gas (see Fig. 6b). The gas is stripped from the surface of the cloud and the magnetic field lines, which are frozen into the gas and initially tangled, stretch along the front (see Fig. 6a). When a layer with a parallel magnetic field forms, it prevents the further stripping of the cold gas and also stop the transport processes across the front.
As we will see in the next session, such a layer with a parallel magnetic field acts, also, to suppress the development of hydrodynamic instabilities
4.3 Hydrodynamic instability
One interesting issue of the proposed cluster dynamical model is that the interface between the tangentially moving gas layers must develop both Rayleigh-Taylor (R-T) and Kelvin-Helmholtz (K-H) instabilities (see Inogamov, 1999 for a review).
The R-T instability develops at the interface between the two fluids when the rarefied fluid accelerates the denser one. If, as it is reasonable to assume, the gas cloud moves together with its own dark matter halo (Vikhlinin & Markevitch 2002, in preparation) the gas cloud is stabilized against the R-T instability by gravity, so that the development of R-T instability is quite unlikely. In contrast the K-H instability is related to the shearing motion at the boundary between two fluids and is expected to develop along the lateral boundaries of the cloud111 Long-wavelength K-H perturbations are also stabilized by a gravitational field perpendicular to the interface. However, Vikhlinin (2001b) found that in the case of A3667 only kpc modes are stable. Therefore gravity is unimportant for the scales considered here.
The wavevector of the fastest growing mode, , is parallel to the flow and its growing time is given by solving the dispersion equation (see e.g. Miles 1958). Vikhlinin et al. (2001b) computed the K-H instability growth time for the flow near the cold front in A3667. As the only perturbations relevant for our discussion are the ones that grow on time scales shorter than the cluster core passage time, (here is the cluster size and is the motion speed), we derived the ratio between these two times222This equation reproduces eq.(4) from Vikhlinin et al. (2001b), corrected for an algebraic error which resulted in overestimation of by a factor of . Note that the correct equation does not affect any results presented in Vikhlinin et al., and indeed, strengthens their arguments.:
| (1) |
where is the angle between the perturbation and the leading edge of the moving cloud.
From Eq 1. we see that:
a) in absence of stabilizing factors, perturbations grown on all scales;
b) small scale perturbations grow faster than the larger scale ones;
c) for a fixed wavelength the growth time is shorter at larger angles reaching its minimum at . This is a direct consequence of the fact that the speed of the external fluid increases with being maximum at .
Using Eq. 1 and assuming Mpc, we find that, already at very small angles ( arcmin), the growth time of a kpc perturbation is much shorter than the cluster passage time. Then, because of points a) and b) above, there should develop a turbulent layer which would smear out the cold front by at least kpc at angles arcmin. As evident from Fig. 2 such a smearing is not present in the Chandra image, at least within the sector of the leading edge of the cold front (CFS in Fig. 2). The same figure shows front smearing only at angles . This behavior is consistent with the proposed magnetic field configuration, indeed. In fact, beside suppressing the transport processes, the surface tension of the amplified magnetic field acts to stabilize the development of the K-H instability. As the fluid speed is lower, the K-H instability is effectively stabilized only inside the sector. At larger angles the flow speed gets higher and the magnetic field surface tension becomes insufficient to stabilize the front. This argument allowed Vikhlinin et al. (2001b) to constraining the strength of the magnetic field finding GG.
Outside the sector, the development of the K-H instability is unaffected by the magnetic field, and therefore the perturbation growth time is given by eq. 1. In this region the evolution of the front is as follow. At first, when the interface is still a discontinuity, the front develops small scale instabilities. Their growth effectively widens the interface, which becomes a turbulent layer of finite width. At this point the perturbations on scales smaller than the evolving width of the front are damped (they becomes unobservable as individual structures) while perturbations on a larger scale start to grow (thus they may appear as distinct structures) (see e.g. Esch 1957). As this process continues, it is expected that the remaining observable wavelengths are the ones with a growth time comparable to the cloud crossing time, namely .
In this scenario the excess and the depression filamentary structures observed on the side of the moving subclump may naturally be interpreted as the result of the development of a large scale K-H instability. We notice, in fact, that the structures lie, at which, because of point c) above, is indeed a privileged point for the growth of the perturbations. Furthermore, if we assume that kpc and Mpc, the growing time for this perturbation is such that . This means that the perturbation is just now entering the strong non-linear regime, consistently with what we observe.
The discovery of this instability is particularly important to fully understand the physics of mergers. One interesting aspect, for example, is that although the cold front prevents the gasses of the merging objects to mix along the direction of motion, strong turbulent mixing processes, on scales comparable to the size of the merging subclump, may occur on the sides. We notice that this process may affect the thermal evolution of the merging subclump. It, in fact, clearly favorites the deposition of rarefied hot gas right in the center of the cluster (see Fig. 1). At the same time, it pulls out some dense cold gas from the same region. If efficient, this process may have important consequences for the development and/or evolution of a central cooling flow.
5 Conclusion
We reviewed the main results obtained from the analysis of two Chandra observations of the central region of A3667. The cluster hosts a spectacular and well defined cold front. Moreover, it shows two arc-like adjacent filamentary structures: one, extending from the colder subcluster toward the cluster outskirts, appears as a dense structure embedded in the less dense cluster atmosphere, and the other, extending inside the subcluster, appears as a rarefied structure embedded in the denser cluster core.
We suggest that the filamentary structures represent the first evidence for the development of a large scale hydrodynamic instability in the cluster atmosphere. We discussed this problematic in light of a self-consistent cluster dynamical model.
Acknowledgements.
P.M. thanks the conference organization committee for waiving his registration fee for the conference. Support for this study was provided by NASA contract NAS8-39073, grant NAG 5-9217, and by the Smithsonian Institution.References
- [1] Esch, R.E. 1957, J. Fluid Mech. 3, 289
- [2] Ettori, S. & Fabian, A. C. 2000, MNRAS, 317, L57
- [3] Inogamov, N. A. 1999, Astrophysics and Space Physics Reviews, 10, 1
- [12] Katgert, P., Mazure, A., den Hartog, R., Adami, C., Biviano, A., & Perea, J. 1998, A&AS, 129, 399
- [4] Mazzotta, P., Markevitch, M., Vikhlinin, A., Forman, W. R., David, L. P., & VanSpeybroeck, L. 2001, ApJ, 555, 205
- [11] Mazzotta, P., Fusco-Femiano, R., Vikhlinin, A. 2002, ApJ, in press (astro-ph/0201423)
- [5] Markevitch, M., Sarazin, C. L., & Vikhlinin, A. 1999, ApJ, 521, 526
- [6] Markevitch, M. et al. 2000, ApJ, 541, 542
- [7] Markevitch, M., & Vikhlinin, A. 2001, ApJ, 563, 95
- [8] Miles, J. W. 1958, J. Fluid Mech., 4, 538
- [Narayan & Medvedev(2001)] Narayan, R. & Medvedev, M. V. 2001, ApJ, 562, L129
- [Rechester & Rosenbluth(1978)] Rechester, A. B. & Rosenbluth, M. N. 1978, Physical Review Letters, 40, 38
- [9] Vikhlinin, A., Markevitch, M., Murray, S.S. 2001a, ApJ, 551, 160
- [10] Vikhlinin, A., Markevitch, M., Murray, S.S. 2001b, ApJ, 549, L47