22institutetext: INAF, Osservatorio Astronomico di Trieste, via G.B. Tiepolo 11, I-34131 Trieste, Italy
33institutetext: Smithsonian Institution, F.L. Whipple Observatory, P.O. Box97, 670 Mount Hopkins, Amado, AZ 85645
44institutetext: Universitäts-Sternwarte, Scheinerstrasse 1, D-81679 Muenchen, Germany
The Dynamical Status of the Cluster of Galaxies 1E0657-56††thanks: Based on observations collected at the European Southern Observatory (La Silla, Chile), Proposal ID: 64.0-0664
We present the results of a new spectroscopic and photometric survey of the hot X-ray cluster 1E0657-56, at . We determine the presence of a low velocity dispersion subcluster, which is offset from the main cluster position by 0.7 Mpc and km s-1. We determine the virial masses and total luminosities of the cluster and its subcluster, and solve for the two-body dynamical model. With additional constraints from the results of the analysis of the cluster X-ray emission by Markevitch et al. (mar01 (2001)), we find that the subcluster passed through the cluster centre Gyr ago. Taken at face value the mass of the subcluster is typical of a loose group. It is however difficult to establish the pre-merger mass of the colliding system. We provide tentative evidence that the subcluster is in fact the remnant core of a moderately massive cluster, stripped by the collision with 1E0657-56. The main cluster dynamics does not seem to have suffered from this collision. On the contrary, the cluster X-ray properties seem to have been significantly affected. We also discuss the effect of the subcluster collision in relation to starburst events and the cluster radio halo.
Key Words.:
Galaxies: clusters: individual: 1E0657-56 – Galaxies: clusters: general – Galaxies: distances and redshifts1 Introduction
The evolution of clusters of galaxies as seen in numerical simulations is characterized by the asymmetric accretion of mass clumps from surrounding filaments (e.g. Diaferio et al. dia01 (2001)). Nearby clusters are characterized by a variety of morphologies, indicative of different dynamical properties. Distant clusters, at redshifts , are often characterized by an elongated distribution, traced by several, apparently distinct, galaxy clumps. Such is the case of Cl 0023+0423 at (Lubin et al. lub98 (1998)), RX J1716.6+6708 at (Gioia et al. gio99 (1999)), MS 1054-03 at (van Dokkum et al. vdo00 (2000)). Other distant clusters are found to have nearby companions, possibly in a pre-merger phase (Lubin et al. lub00 (2000); Rosati et al. ros99 (1999); Haines et al. hai01 (2001); Pentericci et al. pen00 (2000)). Most of these high- clusters are X-ray selected, and are therefore expected to be very massive.
1E0657-558 is in many respects a low-redshift () analogue of these high- clusters. It is X-ray selected, it has an elongated morphology, and there is evidence for an additional subclump located to the West with respect to the main cluster region (see Sect. 3.1). Its high X-ray luminosity and temperature (Tucker et al. tuc98 (1998), hereafter T98; Liang et al. 2000a ; Markevitch et al. mark01 (2001), hereafter M01) as well as its high velocity dispersion (T98) strongly suggest it to be a very massive cluster. A detailed dynamical study of 1E0657-558 could therefore help us understand the dynamics of its more distant analogues.
1E0657-558 is also very interesting per se. After detection in X-ray by the Einstein IPC, ROSAT and ASCA observations constrained its X-ray temperature to be keV (T98) or slightly lower – keV, according to Liang et al. (2000a ). 1E0657-56 is thus one of the hottest clusters known. It displays an irregular X-ray morphology, with two major emission peaks, both clearly offset from the main overdensity of projected galaxy counts (see Fig.5 in Liang et al. 2000a and Fig.11 in this paper). Recently, M01 have reported on Chandra observations of 1E0657-56. They confirm the high temperature of this cluster ( keV), and provide evidence for a compact subcluster at lower temperature (–7 keV). According to M01, this subcluster is seen 0.1–0.2 Gyr after its collision with the main cluster core.
The radio halo of 1E0657-56 was recently detected by Liang et al. (2000a ). The most widely accepted scenario for radio halo production requires the acceleration of thermal electrons to ultra-relativistic energies, and amplification of the intra-cluster magnetic field, by an energetic cluster-cluster collision (e.g. Liang 2000b ). It is important to establish if the radio halo of 1E0657-56 is in any way related to the recent collision with the X-ray subcluster identified by M01.
In the optical, 1E0657-558 was detected by Tucker et al. (tuc95 (1995)), who also revealed a luminous giant gravitational arc, an additional evidence for a strong mass concentration. The arc was confirmed by follow-up observations at the ESO New Technology Telescope (NTT), that also provided a first tentative estimate of the cluster velocity dispersion, km s-1 (T98). Follow-up observations with FORS@VLT were obtained at the end of 1998, providing the spectrum and redshift of the giant arc 111See http://www.eso.org/outreach/press-rel/pr-1999/phot-16-99.html..
In January 2000 we obtained additional spectra of galaxies in the cluster region, with the purpose of constraining its dynamical status. To this end, in this paper we present an analysis of the phase-space distribution of cluster member galaxies. We also consider the relative frequencies and distributions of galaxies of different morphological and spectral types, which are useful indicators of a cluster’s dynamical status (e.g. Moss & Whittle mos00 (2000)). Along with the additional information from the X-ray and radio observations, our new spectroscopic observations allow us to posit a plausible scenario for the dynamical status of 1E0657-558.
The plan of this paper is the following. In Sect. 2 we describe our new photometric and spectroscopic observations. In Sect. 3 we provide our results: a) we determine the distributions of cluster members in the spatial coordinates and in velocities, and provide evidence for the existence of a subcluster; b) we also determine the masses, luminosities, and mass-to-light ratios of the main cluster and its subcluster, and solve the two-body problem for these systems; c) we then consider the relative frequencies and distributions of cluster members of different morphologies and spectral types. In Sect. 4 we provide our interpretation of these results, also taking into account the results from the X-ray and radio observations. We summarize our results in Sect. 5.
2 Data
We carried out the spectroscopic observations at the ESO NTT in La Silla, during two nights in January 2000. The weather conditions were good, with seeing slightly below . We observed with the red-arm of EMMI in Multi-Object Spectroscopy (MOS) mode. EMMI was equipped with a Tektronix TK2048 CCD of 24 m pixels, allowing for an unvignetted field-of-view of . We used grism #2, giving a wavelength coverage from 3850 Å to 9000 Å, and a dispersion of 2.8 Å/pixel.
We took spectra for 129 targets with 5 MOS masks, with exposure times between 2700 and 7200 sec per mask. We reduced the data with standard IRAF222IRAF is distributed by the National Optical Astronomy Observatories, which is operated by AURA Inc. under contract with NSF. packages. All spectra were also visually examined, to exclude possible misidentification of night-sky lines and residuals from cosmic-ray impacts with real spectral features. The signal-to-noise ratios of our spectra range from 8 to 27, with an average S/N17. We determined redshifts for 104 galaxies, using the IRAF tasks XCSAO and EMSAO. Our redshifts span the range 0.0484–0.4827 with an average error of 0.0003. We also add the redshifts of the 16 galaxies that were observed in December 1993 with the same instrumentation, but a slightly different set-up, resulting in a lower resolution (5.9 Å/pixel). These 16 galaxy redshifts were already used by T98 to compute the velocity dispersion of the cluster.
We also determined the equivalent widths (EW hereafter), or upper limits, of the absorption line H and the emission line [O ii], in order to classify post-starburst and starburst galaxies (see Sect. 3.5). We estimated the minimum measurable EW of each spectrum as the width of a line spanning 2.8 Å (our dispersion) in wavelength, with an intensity three times the rms noise in the adjacent continuum.
| ID | EW(H) | EW([O ii]) | Type | |||||||
|---|---|---|---|---|---|---|---|---|---|---|
| hh:mm:ss | km s-1 | km s-1 | Å | Å | (Early/Late) | |||||
| 01 | 06:57:56 | -55:54:24 | – | – | – | 87495 | 38 | – | – | |
| 02 | 06:57:56 | -55:55:55 | – | – | – | 88185 | 38 | – | – | |
| 03 | 06:57:57 | -55:54:37 | – | – | – | 88431 | 54 | – | – | |
| 04 | 06:58:00 | -55:53:40 | – | – | – | 86311 | 41 | 3.6 | – | – |
| 05 | 06:58:08 | -55:53:36 | – | – | – | 91966 | 52 | 5.3 | – | – |
| 06 | 06:58:08 | -55:55:34 | 22.97 | 3.02 | 3.16 | 88245 | 43 | – | E | |
| 07 | 06:58:12 | -55:54:30 | 22.36 | 2.54 | 2.97 | 89991 | 33 | 6.3 | – | E |
| 08 | 06:58:14 | -55:56:37 | 21.61 | 2.75 | 3.92 | 89383 | 48 | – | E | |
| 09 | 06:58:16 | -55:56:01 | 22.96 | 2.65 | 3.82 | 89215 | 52 | – | E | |
| 10 | 06:58:16 | -55:56:37 | 20.43 | 2.48 | 3.84 | 89172 | 50 | – | E | |
| 11 | 06:58:18 | -55:54:59 | 21.88 | 3.01 | 3.55 | 87957 | 44 | – | E | |
| 12 | 06:58:18 | -55:56:15 | 22.68 | 2.79 | 3.95 | 89865 | 53 | – | E | |
| 13 | 06:58:18 | -55:56:36 | 21.81 | 2.82 | 4.04 | 89458 | 46 | – | E | |
| 14 | 06:58:19 | -55:55:52 | 22.25 | 2.32 | 3.40 | 87846 | 34 | – | E | |
| 15 | 06:58:20 | -55:54:59 | 21.89 | 2.26 | 2.83 | 88689 | 52 | – | E | |
| 16 | 06:58:20 | -55:55:56 | 22.63 | 2.50 | 3.54 | 89798 | 44 | – | E | |
| 17 | 06:58:20 | -55:56:32 | 22.79 | 2.61 | 3.76 | 89514 | 61 | – | E | |
| 18 | 06:58:21 | -55:54:47 | 21.80 | 2.00 | 1.84 | 90735 | 34 | – | E | |
| 19 | 06:58:22 | -55:57:12 | 21.40 | 2.44 | 3.60 | 87360 | 36 | – | L | |
| 20 | 06:58:23 | -55:54:55 | 21.72 | 2.24 | 3.30 | 85411 | 29 | 4.9 | – | E |
| 21 | 06:58:24 | -55:56:29 | 22.36 | 2.40 | 3.56 | 90338 | 58 | – | E | |
| 22 | 06:58:25 | -55:56:51 | 21.79 | 2.52 | 3.70 | 88106 | 40 | 4.6 | – | L |
| 23 | 06:58:28 | -55:55:46 | 22.25 | 2.36 | 3.59 | 85601 | 51 | 8.8 | – | E |
| 24 | 06:58:29 | -55:55:57 | 22.08 | 2.19 | 3.21 | 86082 | 57 | 6.4 | – | E |
| 25 | 06:58:29 | -55:56:47 | 19.84 | 2.36 | 3.52 | 87585 | 35 | – | L | |
| 26 | 06:58:30 | -55:56:05 | 22.01 | 2.25 | 3.40 | 86349 | 38 | – | E | |
| 27 | 06:58:30 | -55:57:52 | 22.29 | 2.68 | 3.88 | 88729 | 53 | – | E | |
| 28 | 06:58:31 | -55:54:38 | 22.71 | 2.43 | 3.59 | 88691 | 50 | – | E | |
| 29 | 06:58:31 | -55:56:52 | 21.81 | 2.10 | 3.13 | 85593 | 50 | – | L | |
| 30 | 06:58:31 | -55:57:59 | 19.73 | 2.09 | 3.06 | 87239 | 46 | 4.8 | – | L |
| 31 | 06:58:32 | -55:55:48 | 22.52 | 2.35 | 3.49 | 90096 | 52 | 5.9 | – | E |
| 32 | 06:58:32 | -56:00:03 | 21.09 | 2.27 | 3.32 | 89103 | 64 | 7.0 | – | E |
| 33 | 06:58:35 | -55:57:05 | 22.19 | 2.62 | 3.80 | 92134 | 44 | – | E | |
| 34 | 06:58:35 | -55:58:44 | 22.04 | 2.32 | 3.45 | 87638 | 44 | 3.8 | – | E |
| 35 | 06:58:36 | -55:55:09 | 20.62 | 2.39 | 3.52 | 90517 | 38 | – | L | |
| 36 | 06:58:36 | -55:57:18 | 22.49 | 2.64 | 3.79 | 86925 | 38 | – | E | |
| 37 | 06:58:37 | -55:55:17 | 21.41 | 2.16 | 3.21 | 87693 | 42 | 6.3 | – | E |
| 38 | 06:58:37 | -55:56:18 | 22.44 | 3.36 | 4.59 | 88872 | 29 | – | E | |
| 39 | 06:58:37 | -55:56:21 | 22.93 | 2.41 | 3.63 | 89349 | 67 | – | E | |
| 40 | 06:58:37 | -55:56:24 | 20.17 | 1.37 | 2.53 | 86954 | 27 | 12.3 | – | E |
| 41 | 06:58:37 | -55:56:32 | 22.84 | 3.36 | 4.64 | 90698 | 39 | – | E | |
| 42 | 06:58:37 | -55:56:48 | 21.19 | 2.43 | 3.60 | 88320 | 45 | – | E | |
| 43 | 06:58:37 | -55:57:03 | 21.58 | 2.54 | 2.74 | 88706 | 23 | – | E | |
| 44 | 06:58:37 | -55:58:58 | 22.35 | 3.05 | 4.35 | 87461 | 39 | 7.8 | – | E |
| 45 | 06:58:38 | -55:56:27 | 22.16 | 3.19 | 4.41 | 89546 | 35 | 3.4 | – | E |
| 46 | 06:58:38 | -55:57:23 | 21.00 | 3.22 | 3.77 | 87403 | 28 | – | E | |
| 47 | 06:58:38 | -55:57:32 | 21.79 | 1.93 | 3.55 | 91580 | 99 | – | L | |
| 48 | 06:58:38 | -55:57:46 | 21.54 | 2.65 | 3.51 | 90765 | 104 | – | E | |
| 49 | 06:58:38 | -55:59:01 | 22.38 | 2.96 | 3.95 | 88909 | 102 | 13.6 | – | L |
| 50 | 06:58:39 | -55:57:32 | 22.01 | 2.66 | 4.43 | 89266 | 37 | – | E | |
| 51 | 06:58:40 | -55:56:13 | 22.53 | 2.54 | 3.68 | 88818 | 32 | – | E | |
| 52 | 06:58:40 | -55:57:48 | 23.47 | 2.28 | 3.35 | 86092 | 77 | – | L | |
| 53 | 06:58:40 | -55:59:20 | 22.05 | 2.27 | 3.42 | 90912 | 64 | – | E | |
| 54 | 06:58:41 | -55:57:00 | 22.22 | 2.47 | 3.64 | 88240 | 37 | – | E | |
| 55 | 06:58:41 | -55:57:35 | 23.20 | 2.55 | 3.70 | 87485 | 52 | – | E |
| ID | EW(H) | EW([O ii]) | Type | |||||||
|---|---|---|---|---|---|---|---|---|---|---|
| hh:mm:ss | km s-1 | km s-1 | Å | Å | (Early/Late) | |||||
| 56 | 06:58:41 | -55:59:04 | 23.43 | 2.49 | 3.62 | 87713 | 65 | – | E | |
| 57 | 06:58:42 | -55:59:20 | 21.17 | 1.41 | 2.41 | 87300 | 10 | 26.3 | L | |
| 58 | 06:58:42 | -56:00:28 | 23.00 | 2.64 | 3.34 | 91988 | 82 | 13.2 | 27.0 | L |
| 59 | 06:58:43 | -55:58:36 | 19.92 | 2.62 | 3.82 | 89893 | 51 | – | E | |
| 60 | 06:58:44 | -55:57:22 | 22.49 | 2.22 | 3.33 | 89614 | 87 | – | E | |
| 61 | 06:58:45 | -55:57:57 | 22.21 | 2.64 | 3.68 | 87582 | 29 | – | E | |
| 62 | 06:58:45 | -55:58:35 | 22.26 | 3.70 | 4.92 | 90378 | 39 | – | E | |
| 63 | 06:58:45 | -55:59:42 | 22.53 | 2.33 | 3.65 | 89841 | 62 | – | E | |
| 64 | 06:58:46 | -55:58:38 | 21.89 | 3.06 | 2.85 | 90785 | 63 | – | E | |
| 65 | 06:58:49 | -55:59:04 | 21.81 | 2.33 | 3.50 | 89252 | 41 | – | E | |
| 66 | 06:58:51 | -56:00:25 | 22.49 | 3.26 | 4.78 | 89400 | 32 | – | E | |
| 67 | 06:58:51 | -56:00:26 | – | – | – | 89293 | 42 | – | – | |
| 68 | 06:58:27 | -56:00:00 | 20.07 | 2.26 | 2.77 | 89928 | 231 | – | – | E |
| 69 | 06:58:31 | -55:56:04 | 21.34 | 2.15 | 3.21 | 87874 | 212 | – | – | L |
| 70 | 06:58:32 | -55:56:37 | 21.49 | 2.66 | 3.88 | 86876 | 163 | – | – | E |
| 71 | 06:58:33 | -55:56:36 | 20.93 | 2.70 | 3.87 | 88584 | 159 | – | – | E |
| 72 | 06:58:34 | -55:56:19 | 20.61 | 2.50 | 3.65 | 90184 | 176 | – | – | L |
| 73 | 06:58:35 | -55:56:57 | 20.47 | 2.82 | 4.01 | 88897 | 163 | – | – | E |
| 74 | 06:58:35 | -55:57:20 | 22.26 | 2.63 | 3.73 | 89956 | 276 | – | – | E |
| 75 | 06:58:36 | -55:56:59 | 21.69 | 2.80 | 3.78 | 89430 | 220 | – | – | E |
| 76 | 06:58:38 | -55:57:26 | 20.32 | 2.54 | 3.76 | 89016 | 201 | – | – | E |
| 77 | 06:58:40 | -55:56:04 | 21.24 | 1.93 | 2.93 | 87753 | 193 | – | – | E |
| 78 | 06:58:42 | -55:57:51 | 21.79 | 2.39 | 3.52 | 89388 | 138 | – | – | E |
We obtained exposures on a field centered on =06:58:29 and 55:57:22 (J2000) using FORS1 images through the , and Bessel filters, at the ESO VLT in December 1998. The exposure times were 600 sec in each band; the images reach the , , completeness magnitudes. We carried out the photometric analysis using the SExtractor package (Bertin & Arnouts ber96 (1996)). We also determined rough morphological types by visual inspection.
Our spectroscopic sample is 65 % (45 %) complete down to (), within an elongated region of 20 arcmin2 around the cluster main body.
In Table 1 we list the data for cluster members (membership is defined in Sect. 3.1). In Col. (1) we give an identification number, in Cols. (2) and (3) the right ascension and declination (J2000), in the next three Cols. we give the magnitudes and , colours. In Cols. (7) and (8) we list heliocentric velocities and their errors, respectively. In Cols. (9) and (10) we list the EWs of H and [O ii], respectively. Finally, in Col. (11) we provide the galaxy morphologies (’E’ stands for ’early-type’ and ’L’ for ’late-type’). Data for the last 11 galaxies were taken from T98.
3 Analysis & Results
3.1 Galaxy Distribution and Subclustering
We use the photometric sample to determine the projected spatial distribution of cluster members. To this purpose, we select galaxies in the colour-magnitude (CM) diagram, vs. (see Fig.1). The CM diagram clearly shows the red sequence of early-type galaxies in the cluster. Taking into account the relative distance modulus, evolutionary- and K-correction, we compare the vs. CM sequence of 1E0657-56 with that of Coma (Mazure et al. maz88 (1988)). We adopt Poggianti’s (pog97 (1997)) evolutionary- and K-correction for a passively evolving elliptical. We find excellent agreement between the CM sequence of 1E0657-56 and that of Coma.

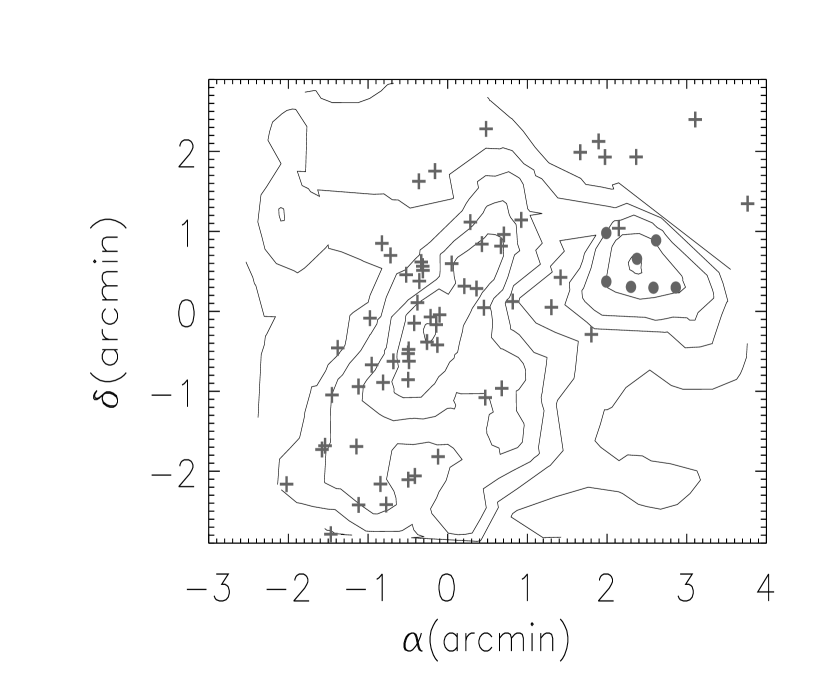
We analyze the 2-dimensional (2D) projected distribution of (likely) cluster members by considering only those galaxies within mag of the vs. CM sequence (specifically, those having magnitudes and colours within the CM band defined by ). The 2D galaxy density distribution, computed with the Adaptive Kernel Method (e.g. Pisani pis93 (1993)), is shown in Fig. 2. Two main structures are evident: the elongated main cluster body, and a roughly circular structure, 0.7 Mpc to the west, at the cluster distance. Since this additional structure is populated by galaxies in the CM sequence, it is likely to be a substructure of the cluster rather than a group in the cluster foreground or background. The analysis of the spectroscopic sample confirms that the substructure is roughly at the cluster redshift (see below).
We use the full spectroscopic sample of 120 galaxies to determine the cluster membership. The cluster membership is best determined by the analysis of the caustic diagram in the space of velocities vs. clustercentric distances (see, e.g., Kent & Gunn ken82 (1982)). Since the cluster 1E0657-56 is significantly elongated, we first circularize the coordinates. We fit an ellipticity and an axial ratio to the projected distribution of cluster members shown in Fig. 2 (we select only galaxies within the main cluster body, i.e. excluding the secondary peak to the west). We find an axial ratio of 2, and a position angle of 55∘. Then we take the density peak in the 2D distribution of member galaxies as the centre of the cluster. The caustic diagram is shown in Fig. 3. From the caustic diagram it is straightforward to choose the range 85000-92500 km s-1 for cluster membership in the velocity space. 78 galaxies of our spectroscopic sample have measured velocities within this range. Data for these 78 cluster members are given in Table 1.

The velocity distribution for the 78 cluster members is not significantly different from a Gaussian (the hypothesis of Gaussianity is rejected with 1% probability, according to a Kolmogorov-Smirnov test, or 11%, according to a -test). Using the biweight estimator (Beers et al. bee90 (1990)), we compute the cluster mean heliocentric velocity, km s-1, and its velocity dispersion (in the cluster rest-frame, see Harrison & Noonan har79 (1979)) km s-1 (errors are at the 68 % confidence level, i.e. 1 for a normal distribution). The value of the velocity dispersion is in remarkably good agreement with the preliminary estimate of T98 based on 13 galaxies, and it is also consistent (within errors) with the slightly lower estimate by Girardi & Mezzetti (gir01 (2001)).

The gaussianity of the velocity distribution is not sufficient to exclude the presence of subclustering (see, e.g., Girardi & Biviano gb02 (2002)). Detection of substructures is much more efficient when the full available phase-space information is used. To this aim, we apply the KMM algorithm (Ashman et al. ash94 (1994)) to the distribution of cluster members in 3D-space of positions and velocities. We search for the solution that separates the cluster members into two systems. The KMM algorithm makes use of the Maximum-Likelyhood Ratio test to estimate how likely the two-system solution is to be a significant improvement over the single-system solution. In our case, the two-system solution is significantly better than the single-system solution, at the 99.9% confidence level (c.l.). KMM assigns 7 galaxies to the secondary system, each with a % c.l. From these galaxies, we compute the subcluster mean velocity km s-1, and its velocity dispersion, km s-1. The mean velocity and velocity dispersion of the main system are almost unchanged when the 7 galaxies belonging to the subcluster are removed from the sample of cluster members ( km s-1 and km s-1). The subcluster is significantly offset in velocity from the main system, km s-1, in the cluster rest frame. In Fig. 4 we show the two velocity histograms of the 71 cluster members, and of the 7 subcluster members, as well as the Gaussian distribution that best fits the velocity histogram of cluster members. In Fig. 2 we overplot the galaxies with measured velocities, belonging to the main cluster (crosses) and to the subcluster (squares), onto the 2D map of projected density counts.
3.2 Virial mass estimates
From the substructure analysis, we identify 7 galaxies belonging to a system separate from the main cluster. The virial mass of the main cluster computed on the 71 remaining cluster members, is , with a 10 % uncertainty (estimated with the jackknife technique – see, e.g., Beers et al. bee84 (1984)). The virial mass is estimated within an aperture of Mpc, which is only % of the cluster virial radius computed as (Carlberg et al. 1997a ). We therefore need to correct this mass for the surface-pressure term (The & White the86 (1986)). We apply this correction following the procedure of Girardi et al. (gir98 (1998)). The corrected virial mass is . We extrapolate this mass to , , assuming a NFW (Navarro et al. nav97 (1997)) mass profile with a scale . This value for the cluster mass is in agreement (within errors) with that derived by Girardi & Mezzetti (gir01 (2001)).
Our estimate of the virial mass for the subcluster is , with an uncertainty of 27 %. Applying the surface-term correction, and extrapolating to the subcluster as we did for the main cluster, leads the virial estimate to .
How reliable are these mass determinations? We argue below (see Sect. 4) that we are observing 1E0657-56 soon after the collision with a cluster of intermediate mass (or group). The main cluster dynamics does not seem to have been substantially affected by this collision (see Sect. 4) so that the (corrected and extrapolated) virial mass estimate of the main system is probably reliable. On the other hand, the subcluster is likely to have been partly disrupted by the collision, and it is difficult to estimate its mass based on equilibrium models. In these conditions, neither the application of the virial theorem, nor the surface-pressure term correction and extrapolation to are warranted. Taking into account these systematic uncertainties, we determine a fiducial mass range for the subcluster of –.

3.3 Mass-to-light ratios
To compute the luminosity of the cluster, we consider galaxies within a 5.4 arcmin2 region which excludes the subcluster. We then follow two alternative approaches. In the first approach we consider all galaxies with magnitude , and subtract the field counts, taken from the literature (Roche et al. roc96 (1996); Shanks et al. sha84 (1984); Weir et al. wei95 (1995)). We choose the magnitude range so as to avoid major background and foreground contamination. In the second approach we consider all galaxies within mag around the cluster CM sequence (see Sect. 3.1), within the same magnitude range as above. In this case, the field contribution is statistically eliminated by the selection of galaxies in the CM diagram. As can be seen from Fig. 5, the two approaches lead to very similar magnitude distributions of (likely) cluster members.

We compute absolute magnitudes using the cluster distance-modulus and the evolutionary- and K-correction in the band for an early-type galaxy at the redshift of 1E0657-56 (Poggianti pog97 (1997)). We then fit a Schechter (sch76 (1976)) function to the absolute magnitude distributions obtained as described in the previous paragraph. The best fit parameters are , for the field-subtracted counts. We obtain the same result, within errors, for the CM band-selected galaxies (see Fig. 6). Integration of the best-fit Schechter luminosity function over the magnitude range yields a total luminosity of , % depending on the adopted method. The (virial) mass-to-light ratio within the same region is . The mass-to-light ratio of 1E0657-56 is consistent with the value , the mean mass-to-light ratio obtained for CNOC clusters (Carlberg et al. 1997b ), once their luminosities are similarly corrected for passive evolution, and transformed from Gunn to Bessel .
We estimate in a similar way the total luminosity of the subcluster. We take the observed galaxy counts in a 1.3 arcmin2 region centered on the subcluster, and subtract the field counts plus the estimated contribution from the cluster at the subcluster distance. The resulting absolute magnitude distribution has a Gaussian-like shape (see Fig. 6) and is markedly different from the magnitude distribution of cluster galaxies. The best-fit Schechter parameters of the subcluster magnitude distribution are rather poorly constrained. However, given the lack of faint galaxies, there is no need for extrapolation of the luminosity function to faint magnitudes. We can therefore estimate the total subcluster luminosity simply from the observed distribution. We thus obtain . The resulting mass-to-light ratio is – (see Sect. 3.2). The upper limit of the subcluster mass-to-light ratio is consistent with the mass-to-light ratio found for the main cluster. The lower limit is consistent with the first quartile of the distribution of mass-to-light ratios found for loose groups (Ramella et al. ram89 (1989)), after transformation from the blue to the red band. Low mass-to-light ratios are also found at the centre of rich clusters, where luminosity segregation has occurred (see, e.g., Koranyi et al. kor98 (1998)).
3.4 Two-body dynamical model


Using the virial masses of the two galaxy systems, their projected distance, and their relative velocity along the line-of-sight (see Sect. 3.1 and 3.2), we carry out the dynamical analysis of the cluster+subcluster system, with the two-body model (Gregory & Thompson gre84 (1984); Beers et al. bee91 (1991)).
In Fig. 7 we show the modeled total mass of the cluster plus subcluster vs. the angle between the plane of the sky and the line connecting the two systems. In the left panel, we show the solution for the case in which the cluster and subcluster are expanding or approaching for the first time. In this case we assume that the two systems were at zero separation 9.4 Gyr ago, which is the age of the Universe at the cluster redshift in our adopted cosmology. From this model, we conclude that the subcluster is bound to the system. The two systems could be currently approaching, or they could still have to reach maximum expansion, depending on the unknown geometry of the collision.
Based on Chandra observations, M01 have recently suggested that a collision between the subcluster and the main cluster has already occurred. From the density jump at the X-ray shock front, M01 estimate that the subcluster is currently moving away from the cluster with a velocity of 3000-4000 km s-1. From the observed line-of-sight component of the relative velocity between the cluster and the subcluster (see Sect. 3.1) we infer a projection angle of 5–15 degrees between the line connecting the two systems and the plane of the sky (i.e. the subcluster is moving nearly in the plane of the sky). M01 reach the same conclusion based on the sharpness of the X-ray brightness edge that they identify as a bow shock.
Assuming that the cluster and the subcluster have already crossed each other, we determine different solutions for the two-body model for different times of the collision event. Only by setting the collision epoch Gyr ago, does a solution exist in which the subcluster velocity is as predicted by the X-ray analysis of M01. This solution (shown in Fig. 7, right panel) implies that the subcluster is currently moving away from the main cluster, and it will eventually collide again in the future, after reaching maximum expansion at about twice the current distance from the cluster centre. For collision epochs Gyr or Gyr, the current subcluster velocity would be significantly larger, or, respectively, smaller, than predicted by the X-ray analysis of M01.
3.5 Different cluster populations
It has been suggested that cluster-cluster collisions may trigger star formation in cluster galaxies (Bekki bek99 (1999); Moss & Whittle mos00 (2000); Girardi & Biviano gb02 (2002) and references therein). Caldwell & Rose (cal97 (1997)) noticed that post-starburst galaxies are frequently found in clusters with evidence of past collision events. Bardelli et al. (bar98 (1998)) found that the bluest galaxies in the ABCG 3558/3562 supercluster are located in the region between the two colliding clusters. Here we consider the relative fractions and distributions of galaxies of different colours, spectral and/or morphological types in 1E0657-56.
Since the fraction of blue galaxies in clusters may depend on redshift (the so-called “Butcher-Oemler” effect, Butcher & Oemler but78 (1978), but84 (1984)) it is important to compare the blue galaxy fraction in 1E0657-56 with the mean blue galaxy fraction of other clusters at the same redshift. We estimate the blue galaxy fraction in 1E0657-56 in two ways: (a) using our photometric sample, according to the definition of Margoniner et al. (mar01 (2001), MCGD hereafter), and (b) using our spectroscopic sample, according to the definition of Ellingson et al. (ell01 (2001), ELYC hereafter). In Table 2 we list the resulting blue galaxy fractions in 1E0657-56, and, for comparison, the mean blue galaxy fractions found by MCGD and ELYC for clusters at . The 1E0657-56 blue galaxy fraction as derived on the photometric sample is marginally larger than the mean found by MCGD for clusters, but the difference is not significant. From the values listed in Table 2 we conclude that the blue galaxy fraction of 1E0657-56 is consistent with those of clusters.
| Cluster population | 1E0657-56 | Literature |
|---|---|---|
| Blue – photom. sample | 0.36 (MCGD) | |
| Blue – spectro. sample | 0.15 (ELYC) | |
| Elliptical-like spectra | 0.54 (ELYC) | |
| 0.47 (D99) | ||
| Balmer-absorption spectra | 0.30 (ELYC) | |
| 0.20 (D99) | ||
| Emission-line spectra | 0.16 (ELYC) | |
| 0.32 (D99) |
We then compare the fractions of different spectral-type populations in 1E0657-56 with those determined by ELYC on the CNOC clusters, and by Dressler et al. (dre99 (1999), hereafter D99) on the MORPHS clusters. ELYC consider three spectral-types: elliptical-like spectra, spectra with strong Balmer-absorption, and spectra with emission lines (emission-line galaxies, ELG, hereafter). A finer classification scheme was devised by D99, depending on the EW(H) and the EW of emission lines. For lack of statistics (we only have spectral types for 67 cluster members in total), we prefer to join together some of their classes. In particular, we combine the and classes of D99 into a single class, corresponding to ELYC’s class of spectra with strong Balmer absorption. Similarly, we combine D99’s , , and classes into a single class, which corresponds to ELYC’s class of emission-line galaxies. D99’s class corresponds to ELYC’s elliptical-like spectral class.
In Table 2 we list the fractions of the different spectral-type galaxies in 1E0657-56, and, for comparison, the mean fractions found by ELYC in the CNOC clusters, and by D99 in the MORPHS clusters. The fraction of galaxies with strong or moderate Balmer-absorption in 1E0657-56 is similar to those found by ELYC and D99. On the other hand, in 1E0657-56 there is a lower fraction of galaxies with emission-lines, and a higher fraction of galaxies with elliptical-like spectra, than the average fractions found by ELYC and D99.


We now consider the distributions of the different cluster populations. In Fig. 8 we show the spatial distributions of different populations of cluster members: galaxies classified morphologically as early-type and late-type, galaxies with EW(H) Å, and galaxies with emission lines. The early-type galaxies seem to be more centrally concentrated than the other galaxy populations. A Rank-Sum test (e.g. Hoel hoe71 (1971)) confirms this visual impression (95% c.l.). The only two emission-line galaxies are located in the cluster outskirts, similarly to what is usually seen in nearby clusters (Biviano et al. biv97 (1997)). We show in Fig. 9 the velocity distributions of the different cluster populations (after getting rid of galaxies in the subcluster), and we list their mean velocities and velocity dispersions in Table 3. The velocity dispersion of the early-type galaxies seems to be lower than that of the late-type galaxies, but the difference is not significant (according to the F-test, see, e.g., Press et al. press (1992)). The only significant difference (at the 95 % c.l. according to a Rank-Sum test) occurs between the mean velocities of the early-type galaxies and of the strong Balmer-absorption galaxies.
| Cluster population | |||
|---|---|---|---|
| km s-1 | km s-1 | ||
| early-type | 52 | ||
| late-type | 13 | ||
| Balmer-absorption | 16 |
Finally, we note that all 7 spectroscopically-confirmed members of the subcluster can be assumed to be evolved ellipticals, or S0–Sa’s, since we classify them morphologically as early-type, and spectroscopically as -type.


4 Discussion
4.1 A major collision event?
Using our new spectroscopic sample of 1E0657-56 members in a Mpc2 region, we detect a subcluster of low velocity dispersion, km s-1, km s-1 and 0.7 Mpc away from the main cluster (see Sect. 3.1). This subcluster was also recently detected in the X-ray by M01 using Chandra. M01 suggest that a bow shock is currently propagating outward from the cluster, nearly at the location of our optically detected subcluster. They determine a shock velocity of 3000-4000 km s-1. Assuming that the subcluster galaxies are also moving away with this velocity, we determine the projection angle of the cluster-subcluster system from the observed line-of-sight velocity of the subcluster relative to the main cluster. We find that the line connecting the two systems lies very close to the plane of the sky. With such an orientation angle, the two-body dynamical model for the cluster and its subcluster has two solutions (see Sect. 3.4). In both solutions, the two systems are gravitationally bound. If we further assume that the subcluster is moving away from the main cluster, we can constrain the epoch of collision to Gyr ago. The subcluster will reach maximum expansion at Mpc away from the main cluster, and then recollapse again.
The (virial) mass ratio of the subcluster and the main cluster is very low, ranging from 1:200 to 1:30 (see Sect. 3.2). The allowed range is large because of the very uncertain mass of the subcluster. The low velocity dispersion of the subcluster ( km s-1) is typical of loose groups (e.g. Ramella et al. ram89 (1989)), but also of the cores of rich clusters that have developed luminosity segregation (Biviano et al. biv92 (1992)). The nearly Gaussian shape of the subcluster magnitude distribution resembles that of cluster cores, where dynamical friction and merging of bright galaxies, together with tidal disruption of faint galaxies, tend to enrich the bright end of the magnitude distribution at the expense of the faint end. Cluster cores are dominated by early-type galaxies, the same galaxy population which characterizes the subcluster. These considerations suggest that the subcluster could be the remnant core of a moderately massive cluster disrupted by its collision of 1E0657-56. In this case, the pre-merger mass ratio could have been substantially larger.

Further evidence for this scenario is given by the comparison of the optical and X-ray properties of 1E0657-56 and its subcluster. The subcluster X-ray temperature and luminosity are too high for its velocity dispersion, as implied by the empirical relations for galaxy systems of Girardi et al. (gir96 (1996)), and Girardi & Mezzetti (gir01 (2001)) (see Fig.10). What we now identify as the subcluster in the galaxy distribution could be the remnant compact core of a more massive system that has lost most of its galaxies after the collision. Similar characteristics of compactness are also seen in the X-ray emissivity contours, resembling cooling flow regions in cluster cores (M01). The X-ray temperature and luminosity of the subcluster corresponds to a velocity dispersion of km s-1 and a pre-merger subcluster-cluster mass ratio of 1:6.
A large mass ratio merger is also suggested by the comparison of the X-ray and optical properties of the main cluster. The bulk X-ray emission of 1E0657-56 is offset from the main concentration of cluster galaxies, in the direction of the subcluster. This is clearly seen in the Chandra image reproduced in Fig.1b of M01, as well as in the ROSAT/HRI image333This image is retrieved from the ROSAT public archive at http://heasarc.gsfc.nasa.gov/docs/rosat/rhp_archive.html. shown in Fig. 11 (right panel), both over-plotted on the -band FORS image of the cluster. The X-ray cluster morphology resembles those seen in the numerical simulations of Roettiger et al. (roe93 (1993), roe96 (1996)) soon after the collision has occurred. Remarkably, in these simulations the dark matter distribution of the main cluster is much less affected by the collision than the gas distribution (Roettiger et al. roe93 (1993)). Being a nearly collisionless component, galaxies probably trace a distribution similar to that of the dark matter. The observed offset between the galaxy and gas distributions, is then an expected consequence of a merger, but only for large mass ratios between the merging systems (compare Fig.1c to Fig.2c in Roettiger et al. roe96 (1996), corresponding to the X-ray surface brightness images of a 1:4 and a 1:8 merger, respectively, both 0.5 Gyr after core passage).
According to numerical simulations, cluster-cluster collisions not only affect the X-ray surface brightness distribution, but also increase the X-ray temperature, X-ray luminosity (Ricker & Sarazin ric01 (2001)), and velocity dispersion (Pinkney et al. pin96 (1996)) of the main cluster. However, the increase in the observed velocity dispersion depends on the relative orientation between the line-of-sight and the merger plane. When this is nearly 90 degrees, as in the case of 1E0657-56 (see Sect. 3.4), the increase is only % for a 1:3 mass ratio (Pinkney et al. pin96 (1996)). On the other hand, in the same collision, the X-ray luminosity and temperature can be boosted up by factors as high as and (Ricker & Sarazin ric01 (2001)). These theoretical results are consistent with our observations. Both the X-ray temperature and X-ray luminosity of 1E0657-56 appear too high for the cluster velocity dispersion (see Fig.10). On the other hand, the line-of-sight component of the cluster velocity dispersion should not have been affected by the collision, or the cluster mass-to-light ratio we derive could not be so close to the mean value of rich clusters (see Sect. 3.3).
4.2 The radio halo
Here we consider the relation of the subcluster collision with the radio halo of 1E0657-56. We show in the left panel of Fig. 11 the 1.3 GHz radio image of the cluster, taken by Liang et al. (2000a ) with ATCA, after subtraction of discrete sources, and smoothing. Radio contours are over-plotted on the -band image of the cluster obtained with FORS@VLT. The radio halo seems to be centered onto the main cluster with an extension towards the subcluster.
Cluster radio halos are quite uncommon. They are probably generated by a population of ultra-relativistic electrons that emit synchrotron radiation in the cluster magnetic field. The electrons could be thermal in origin, belonging to the IC plasma, accelerated to high energies by energetic processes such as cluster-cluster mergings. However, the merger event we are witnessing might be too recent to explain the cluster radio halo. In fact, according to the model of Brunetti et al. (bru01 (2001)), it takes Gyr after the merger event to create a radio halo. On the other hand, the radio halo of 1E0657-56 could have been powered by other major subcluster collisions. The presence of colliding subclusters in the regions of massive clusters at is often seen in numerical simulations of hierarchical cosmologies (e.g. Tormen tor98 (1998)), and the very elongated structure of 1E0657-56 is certainly suggestive of accretion events along large scale structure filaments. The radio halo of 1E0657-56 does have an extension towards the infalling subcluster, and this feature is probably due to the displacement of the intra-cluster gas by the recent collision event.
4.3 The post-starburst population
An additional consequence of a major merger could be the triggering of a starburst activity in cluster galaxies (Bekki bek99 (1999); Moss & Whittle mos00 (2000); Girardi & Biviano gb02 (2002) and references therein), lasting Gyr. We find no evidence for a significant fraction of starburst galaxies in 1E0657-56. On the contrary, the cluster ELG fraction is rather low, compared to those of other clusters at similar redshifts (e.g. the CNOC clusters, ELYC, and the MORPHS clusters, D99), and it is similar to that of nearby high-velocity dispersion clusters (see Fig.3 in Biviano et al. biv97 (1997)).
A significant number of cluster galaxies are instead found to be in a post-starburst (PSB) phase, as indicated by their large EW(H). The fraction of PSB galaxies in 1E0657-56 (%) is similar to that of other clusters at the same redshift. The PSB galaxies do not share the same kinematics of the main 1E0657-56 galaxy population (see Sect. 3.5). This is an indication for a recent (on a dynamical timescale) acceleration of these galaxies. It is possible that both their kinematics and spectral properties have been influenced by the subcluster collision, and that we are observing the cluster just after the starburst phase has ceased. On the other hand, the PSB galaxies are not distributed along the direction of the subcluster collision. Moreover, the mean velocity of these galaxies (in the cluster rest frame) is km s-1 lower than the mean velocity of the subcluster. It is then unlikely that this galaxy population is related to the recent collision event in 1E0657-56.
Alternatively, PSB galaxies could have evolved from recently infallen late-type field galaxies. In fact, PSB galaxies share the projected distribution and kinematics of late-type galaxies (see Fig.8 and Table 3), suggestive of an out-of-equilibrium dynamical state. Significant ram-pressure stripping occurs when galaxies cross the cluster core, sometime preceded by an instantaneous burst of star formation (Fujita et al. fuj01 (2001); Vollmer et al. 2001a ). Other episodes of star formation can occur when the stripped galaxies emerging from the core re-accrete part of the stripped gas on their disks (Vollmer et al. vol00 (2000), 2001b ). Should this scenario be correct, the claimed rôle of subcluster collisions in the production of starbursts should be reconsidered. A spectroscopic survey of the outer regions of 1E0657-56 is needed in order to compare the properties of galaxies in the cluster outskirts with those of galaxies in the cluster core.
5 Summary
We provide evidence for a recent ( Gyr) collision between the very massive cluster 1E0657-56 and a low velocity dispersion subcluster. A comparison between optical and X-ray properties of the cluster suggests that a major collision has occurred. The same comparison for the subcluster suggests that it could be the remnant compact core of a moderately massive cluster.
Model timescales for the production of cluster radio halos tend to exclude this collision event as the main responsible for the cluster radio halo. On the other hand, the radio morphology of the cluster has probably been distorted by this recent collision.
1E0657-56 has a low fraction of star forming galaxies, rather unexpected in current scenarios of starburst triggering by cluster-cluster mergers. Furthermore, PSB galaxies are unlikely to be related with the collision event, given their spatial and kinematical distribution. We rather interpret them as field galaxies that have recently fallen into the cluster gravitational potential.
Acknowledgements.
We thank Dr. Haida Liang for kindly providing us with the radio image of the cluster. We acknowledge useful discussions with Marisa Girardi. We thank an anonymous referee for useful comments. This research has made use of data obtained from the High Energy Astrophysics Science Archive Research Center (HEASARC), provided by NASA’s Goddard Space Flight Center.References
- (1) Ashman, K.M., Bird, C.M. & Zepf, S.E. 1994, AJ, 108, 2348
- (2) Bahcall, N.A., Ostriker, J.P., Perlmutter, S. & Steinhardt, P.J. 1999, Science, 284, 1481
- (3) Bardelli, S., Pisani, A., Ramella, M., Zucca, E., & Zamorani, G. 1998, MNRAS, 300, 589
- (4) Beers, T.C., Flynn, K. & Gebhardt, K. 1990, AJ, 100, 32
- (5) Beers, T.C., Forman, W., Huchra, J.P., Jones, C., & Gebhardt, K. 1991, AJ, 102, 1581
- (6) Beers, T.C., Geller, M.J., Huchra, J.P., Latham, D.W., & Davis, R.J. 1984, ApJ, 283, 33
- (7) Bekki, K. 1999, ApJ, 510, L15
- (8) Bertin, E. & Arnouts, S. 1996, A&AS 117, 393
- (9) Biviano, A., Girardi, M., Giuricin, G., Mardirossian, F., & Mezzetti, M. 1992, ApJ, 396, 35
- (10) Biviano, A., Katgert, P., Mazure, A., et al. 1997, AA, 321, 84
- (11) Brunetti, G., Setti, G., Feretti, L. & Giovannini, G. 2001, MNRAS, 320, 365
- (12) Butcher, H., & Oemler, A.Jr. 1978, ApJ, 219, 18
- (13) Butcher, H., & Oemler, A.Jr. 1984, ApJ, 285, 426
- (14) Caldwell, N. & Rose, J.A. 1997, AJ, 113, 492
- (15) Carlberg, R.G., Yee, H.K.C., & Ellingson, E. 1997a, ApJ, 478, 462
- (16) Carlberg, R.G., Yee, H.K.C., Ellingson, E. et al. 1997b, ApJ, 476, L7
- (17) Diaferio, A., Kauffmann, G., Balogh, M.L., White, S.D.M., Schade, D., & Ellingson, E. 2001, MNRAS, 323, 999
- (18) Dressler, A., Smail, I., Poggianti, B.M., et al. 1999, ApJ, 122, 51 (D99)
- (19) Ellingson, E., Lin, H., Yee, H.K.C. & Carlberg, R.G. 2001, ApJ, 547, 609 (ELYC)
- (20) Freedman, W.L., Madore, B.F., Gibson, B.K. et al. 2001, ApJ, 553, 47
- (21) Fujita, Y. 2001, ApJ, 550, 612
- (22) Gioia, I. M., Henry, J. P., Mullis, C. R., & Ebeling, H. 1999, AJ, 117, 2608
- (23) Girardi, M. & Biviano, A. 2002, to be published in Cluster Mergers, eds.: L. Feretti, I. Gioia and G. Giovannini, Kluwer Academic
- (24) Girardi, M., Fadda, D., Giuricin, G., Mardirossian, F., Mezzetti, M., & Biviano, A. 1996, ApJ, 457, 61
- (25) Girardi, M., Giuricin, G., Mardirossian, F., Mezzetti, M. & Boschin, W. 1998, ApJ, 505, 74
- (26) Girardi, M. & Mezzetti, M. 2001, ApJ, 548, 79
- (27) Gregory, S.A., & Thompson, L.A. 1984, ApJ, 286, 422
- (28) Haines, C. P., Clowes, R. G., Campusano, L. E., & Adamson, A. J. 2001, MNRAS, 323, 688
- (29) Harrison, E.R. & Noonan, T.W. 1979, ApJ, 232, 18
- (30) Hoel, P.G. 1971, ”Introduction to Mathematical Statistics” (New York: J. Wiley & Sons)
- (31) Kent, S.M., & Gunn, J.E. 1982, AJ, 87, 945
- (32) Koranyi, D.M., Geller, M.J., Mohr, J.J., & Wegner, G. 1998, ApJ, 116, 2108
- (33) Liang, H. 2000, astro-ph0012166
- (34) Liang, H., Hunstead, R.W., Birkinshaw, M. & Andreani, P. 2000, ApJ, 544, 686
- (35) Liu, M.C., & Graham, J.R. 2001, ApJ, 557, L31
- (36) Lubin, L. M., Brunner, R., Metzger, M. R., Postman, M., & Oke, J. B. 2000, ApJ, 531, L5
- (37) Lubin, L. M., Postman, M., & Oke, J. B. 1998, AJ, 116, 643
- (38) Margoniner, V.E., De Carvalho, R.R., Gal, R.R. & Djorgovski, S.G. 2001, ApJ, 548, L143 (MCGD)
- (39) Markevitch, M., Gonzalez, A.H., Vikhlinin, D.A. et al. 2001, astro-ph/0110468 (M01)
- (40) Mazure, A., Proust, D. Mathez, G., & Mellier, Y., 1988, A&AS, 76, 339
- (41) Moss, C., & Whittle, M. 2000, MNRAS, 317, 667
- (42) Navarro, J.F., Frenk, C.S., & White, S.D.M. 1997, ApJ, 490, 493
- (43) Pentericci, L., Kurk, J. D., Röttgering, H. J. A., et al. 2000, AA, 361, L25
- (44) Pinkney, J., Roettiger, K., Burns, J.O., & Bird, C.M. 1996, ApJS, 104, 1
- (45) Pisani, A. 1993, MNRAS, 265, 706
- (46) Poggianti, B.M., 1997, A&AS 122, 399
- (47) Press, W.H., Teukolsky, S.A., Vetterling, W.T., & Flannery, B.P. 1992, Numerical Recipes in C, Cambridge University Press
- (48) Ramella, M., Geller, M.J., & Huchra, J.P. 1989, ApJ, 344, 57
- (49) Ricker, P.M., & Sarazin, C.L. 2001, astro-ph/0107210
- (50) Roche, N., Shanks, T., Metcalfe, N. & Fong, R. 1996, MNRAS, 280, 397
- (51) Roettiger, K., Burns, J., & Loken, C. 1993, ApJ, 407, L53
- (52) Roettiger, K., Burns, J., & Loken, C. 1996, ApJ, 473, 651
- (53) Rosati, P., Stanford, S. A., Eisenhardt, P. R., et al. 1999, AJ, 118, 76
- (54) Schechter, P., 1976, ApJ 203, 297
- (55) Shanks, T., Stevenson, P.R.F., Fong, R. & MacGillivray, H.T. 1984, MNRAS, 206, 767
- (56) The, L.S. & White, S.D.M. 1986, AJ, 92, 1248
- (57) Tormen, G. 1998, MNRAS, 297, 648
- (58) Tucker, W., Blanco, P., Rappoport, S., et al. 1998, ApJ, 496, L5 (T98)
- (59) Tucker, W., Tananbaum, H., & Remillard, R. 1995, ApJ, 444, 532
- (60) van Dokkum, P. G., Franx, M., Fabricant, D., Illingworth, G. D., & Kelson, D. D. 2000, ApJ, 541, 95
- (61) Vollmer, B., Braine, J., Balkowski, C., Cayatte, V., Duschl, W.J. 2001b, AA, 374, 824
- (62) Vollmer, B., Cayatte, V., Balkowski, C., & Duschl, W.J. 2001a, ApJ, 561, 708
- (63) Vollmer, B., Marcelin, M., Amram, P., Balkowski, C., Cayatte, V., & Garrido, O. 2000, AA, 364, 532
- (64) Weir, N., Djorgovski, S. & Fayyad, U.M. 1995, AJ, 110, 1