Proper motions of new dust in the colliding-wind binary WR 140
Abstract
The eccentric WR+O binary system WR 140 produces dust for a few months at intervals of 7.94 yrs coincident with periastron passage. We present the first resolved images of this dust shell, at binary phases and , using aperture masking techniques on the Keck-I telescope to achieve diffraction-limited resolution. Proper motions of approximately 1.1 milliarcsecond per day were detected, implying a distance 1.5 kpc from the known wind speed. The dust plume observed is not as simple as the “pinwheel” nebulae seen around other WR colliding wind binaries, indicating the orbital plane is highly inclined to our line-of-sight and/or the dust formation is very clumpy. Follow-up imaging in the mid-infrared and with adaptive optics is urgently required to track the dust motion further, necessary for unambiguously determining the orbital geometry which we only partially constrain here. With full knowledge of the orbital elements, these infrared images can be used to reconstruct the dust distribution along the colliding wind interface, providing a unique tool for probing the post-shock physical conditions of violent astrophysical flows.
1 Introduction
WR 140 is a prototypical colliding wind source consisting of a WC7 Wolf-Rayet and an O4-5 star, and has been extensively studied in the radio, infrared, optical, ultra-violet, and even X-rays (e.g., Moffat et al. 1987; Williams et al. 1990; White & Becker 1995; Setia Gunawan et al. 2001). One of its more remarkable properties is that dust forms over a period of a few months close to periastron passage on each 7.94 yr orbit (Hackwell et al. 1976; Williams et al. 1978, 1990) when the two stars are only a few AU apart. Dust formation is apparently catalyzed at the wind-wind interface in a layer of shock-compressed gas (Usov 1991). In this paper we will use the orbital elements of Williams et al. (1990), a 1985 periastron passage on JD 2446160 and period of 2900 days, for estimating the orbital phases, but we hope refinement of these parameters will be available soon based on data taken during the recent periastron passage.
Recent advances in high-resolution imaging have allowed the dust emission of other colliding wind sources to be resolved for the first time. For WR 104 and WR 98a, continuous spiral plumes of dust were observed, formed by colliding winds situated in approximately face-on orbits with periods of 1 year (Tuthill et al. 1999; Monnier et al. 1999). Dust formation around the longer-period system WR 137 was observed to be much more clumpy, but interpretation has been hampered by uncertain orbital elements (Marchenko et al. 1999). The recent periastron passage of WR 140 in 2001 February afforded a unique opportunity to study this prototype by observing the formation and expansion of the transient dust shell, in an attempt to both better understand the 3-dimensional orbital geometry of the binary and to probe exactly how and where dust forms in these colliding wind systems. This knowledge is important for understanding the origins of interstellar dust grains, the physics of strong astrophysical shocks, and the structure of line-driven winds from Wolf-Rayets.
In this Letter, we report first results of our multi-wavelength imaging program of WR 140. We captured images of this dust shell soon after periastron passage at two epochs, allowing the dust morphologies and proper motions to be studied. Our conclusions are preliminary and follow-up observations are needed in order to more precisely interpret these new data.
2 Observations
Aperture masking interferometry was performed by placing aluminum masks in front of the Keck-I infrared secondary mirror. This technique converts the primary mirror into a VLA-style interferometric array, allowing the Fourier amplitudes and closure phases for a range of baselines to be recovered with minimal “redundancy” noise (e.g., Baldwin et al. 1986; Jennison 1958). The Maximum Entropy Method (MEM) (Skilling & Bryan 1984; Narayan & Nityananda 1986) has been used to reconstruct diffraction-limited images from the interferometric data, as implemented in the VLBMEM package by Sivia (1987). In order to check the reliability of the reconstructions, the MEM results have been compared with those from the CLEAN reconstruction algorithm (Högbom 1974; Cornwell & Wilkinson 1981; Pearson & Readhead 1984). Further engineering and performance details may be found in Tuthill et al. (2000) and Monnier (1999). In addition, some short-exposure imaging was done without an aperture mask (“Speckle Interferometry”), but the data was of insufficient quality to reconstruct reliable images in most cases.
WR 140 was observed in 1999 July, 2001 June, and 2001 July at Keck-I using the Near Infrared-Camera (Matthews & Soifer 1994; Matthews et al. 1996) in speckle mode, using an integration time of 0.137 s per frame. All important observing information can be found in Table 1. This table also contains photometric information on our multi-wavelength observations, in particular the fraction of the flux in WR 140 from the dust shell for each wavelength and for each epoch. We also report the magnitude difference between WR 140 and its point-source reference star in each case. Unfortunately, there are no published near-IR magnitudes for the most of these calibrators, and so we are unable to convert our relative photometry into absolute photometry at this time. Assuming HD 192867 was constant between epochs, the 1.6 m and 2.2 m fluxes of WR 140 did not significantly change between the post-periastron epochs.
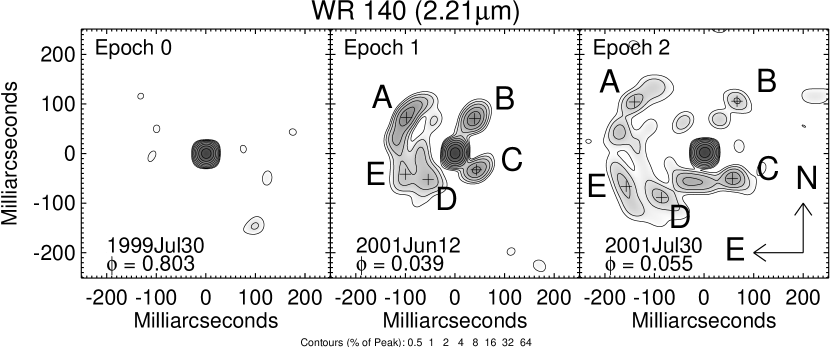
Figure 1 shows MEM reconstructions of the WR 140 dust shell at 3 epochs at 2.2 m with 20 mas resolution. The Epoch 0 image was made well before periastron when we expected there to be no circumstellar dust visible at this wavelength. The Epoch 1 image was made by coadding 4 separate images made from independently calibrated observations and has higher dynamic range than the image from Epoch 2. In addition, seeing conditions were worse in Epoch 2, resulting in degraded imaging as evidenced by the higher noise level.
The test observation of WR 140 was taken in 1999 July before the recent dust production episode, and there was no evidence for any extended structure at 1.6 m and 2.2 m as expected (see “Epoch 0” in Figure 1). The angular separation of the two components at that epoch could have been as high as 14 mas based on Williams et al. (1990), which would have been marginally resolvable with Keck. We inspected our data and found no convincing evidence for a binary but can only set an upper limit of 20 mas due to calibration uncertainties. We note that this binary should be easily resolvable with a long-baseline optical interferometer, and apastron in 2005 presents a wide enough target for 8-m class telescopes to resolve.
| Date | Aperture | FWHM | # of | Mag | % Flux | ||
|---|---|---|---|---|---|---|---|
| (U.T.) | Mask | (m) | (m) | Frames | Calibrator | (WR140-Cal) | From Dust |
| 1999 Jul 30 | None | 1.6471 | 0.0176 | 100 | HD 193631 | 0.140.03 | 10 |
| None | 2.2596 | 0.0531 | 100 | HD 193631 | -0.010.03 | 10 | |
| 2001 Jun 12 | Annulus | 1.6575 | 0.333 | 300 | HD 192867 | 1.560.03 | 437 |
| Annulus | 2.2135 | 0.427 | 300 | HD 192867 | 0.750.03 | 655 | |
| Annulus | 2.269 | 0.155 | 100 | HD 193092 | 2.430.03 | 685 | |
| Annulus | 3.0825 | 0.1007 | 100 | HD 192909 | 2.830.20 | 8115 | |
| 2001 Jul 30 | Annulus | 1.6575 | 0.333 | 100 | HD 192867 | 1.550.03 | 327 |
| Annulus | 2.2135 | 0.427 | 100 | HD 192867 | 0.720.03 | 6210 | |
| Annulus | 3.0825 | 0.1007 | 100 | HD 193092 | 1.550.03 | 925 | |
| None | 1.6471 | 0.0176 | 100 | HD 192867 | 1.680.05 | 3410 | |
| None | 2.2596 | 0.0531 | 100 | HD 192867 | 0.890.04 | 6610 | |
| None | 3.0825 | 0.1007 | 100 | HD 192867 | -0.060.03 | 7910 |
| 2001 Jun 12 | 2001 Jul 30 | Velocity | Date | |||
|---|---|---|---|---|---|---|
| Feature | R(a)(a)footnotemark: (mas) | PA(b)(b)footnotemark: (°) | R (mas) | PA (°) | (mas/day) | EjectedccErrors in table are in units of days. |
| A | 122 | 54 | 175 | 54 | 1.100.20 | 2001 Feb 2120 |
| B | 79 | 331 | 123 | 328 | 0.920.20 | 2001 Mar 1718 |
| C | 54 | 231 | 76 | 227 | 0.460.20 | 2001 Feb 1452 |
| D | 77 | 134 | 125 | 136 | 1.080.40 | 2001 Mar 2728 |
| E | 110 | 113 | 172 | 113 | 1.290.40 | 2001 Mar 3028 |
3 Discussion
Tracks of the motion of five dust features, labelled A through E on Figure 1, are compiled in Table 2. The arc of dust to the north-east of the central source (feature A) appears to be moving at an angular velocity of milli-arcseconds per day, similar to the velocity of the eastern features D and E. The western features B and C appear to have slower velocities, perhaps indicating they are moving more out of the plane of the sky. We caution that image reconstructions of weak features from interferometry data can suffer from systematic errors, including apparently clumpy features in place of smooth faint nebulosity. The apparent position angles of each marked feature remained unchanged between epochs (to within errors of a few degrees), giving confidence that we are indeed tracking physical radial motion of dust and are not strongly affected by image fidelity problems. The positions of features of D and E are most uncertain, since the local maxima in Epoch 1 are relatively weak and could be significantly influenced by noise. We have estimated the relative position uncertainty to be 10 mas for Features A-C, and 20 mas error for Features D & E, and this is reflected in the velocity error compiled in the table.
If we assume that feature A is moving at the WR wind speed (2860km/s; Williams et al. 1990) and in the plane of the sky, then we set a distance upper limit to WR 140 of 1.5 kpc, which is close to previous estimates based on the apparent luminosity of the O4-5 companion (Williams et al. 1990, 1.3 kpc for main sequence, 1.7 kpc for supergiant). The uncertainty of 20% on the dust feature velocities can be substantially reduced with continued monitoring using adaptive optics or high SNR mid-IR measurements on an 8-m class telescope.
Estimated times for ejection of dust features from the binary (assuming constant velocity and extrapolating back to the central stars) can be found in Table 2. Dates are consistent with the periastron prediction of Williams et al. (1990): 2001 February 19. This is further borne out by the fact that dust in the partial arc of Feature A is roughly equidistant from the star, as expected if formed over a short period of time as the O-star swung quickly around the WR star just at periastron. If this dust arc was formed in this manner, this would imply that the O-star was located roughly East of the WR star on the sky at periastron. However, it is surprising that Features B and C seem to have also formed close to this time, considering they are moving in very different directions from feature A.
It is tempting to interpret the eastern arc of dust in Figure 1 (comprising features A, E and D) as part of an outward spiraling clockwise plume similar to those seen around pinwheel nebulae, implying that the underlying binary has an counter-clockwise orbit. This orbital motion is difficult to reconcile with preliminary VLBA observations of the non-thermal radio emission by Beasley (2001, private communication) which indicate a clockwise orbit. Furthermore, a simple pinwheel nebula type model (as applicable for WR 104 and WR 98a) can not easily explain the additional emission to the northwest and southwest (features B and C). We must look to a more complex model to understand these observations.
Naively, we expect the dust to form in a thin cone-like layer between the colliding winds, which gets twisted into a spiral with the orbit of the underlying binary (Tuthill et al. 1999). This cone forms because the winds have unequal momenta and the geometry of the interface region asymptotically resembles a cone bending away from the star with the stronger wind (Usov 1991; Canto et al. 1996). For WR 140, the cone (full) opening angle can be estimated to be 74° by using estimated wind velocities and densities in Williams et al. (1990) and the analytical formulation of Eichler & Usov (1993). Regarding the orientation of the orbit, we have multiple reasons to think that the inclination of the orbit is large (60°): from time-variable shadowing effects in the radio (White & Becker 1995) and radial velocity measurements combined with the expected masses of the components (Williams et al. 1990).
To understand the difficulty in interpreting the near-infrared morphology under such circumstances, consider Figure 2. This figure shows a portion of the cone interface for a colliding wind binary system with the known (spectroscopic) orbital elements of WR 140 (Williams et al. 1990), an inclination angle 60°, and an observation date about 0.5 yr after periastron. Based on previous findings for WR 140, this model also assumes that dust is only formed during a “trigger”-zone of the orbit, within 0.15 years of periastron passage (before and after), and the conic surface between the two winds is only rendered for this span. This figure also displays what this model might look like on the sky if the dust was optically thin and had constant emissivity; that is, the “cone of dust” has been projected onto the plane of the sky. Arcs, filaments and complex shapes are formed in this manner due, depending on the orbital orientation, cone opening angle, and the span of the trigger-zone.
For high inclination binaries such as WR 140, arcs of emission might be tracing the limb-brightening of the dust cone with our line-of-sight, giving us a sensitive probe of the dust distribution if the orbit geometry is known from other means. With full orbital elements, hopefully derivable from the VLBA monitoring program or mid-infrared imaging, we expect to be able to invert our images of the dust in order to map out the dust density along the wind-wind interface cone. However without independent constraints on the orbital inclination, trigger zone, and other parameters, we are unable to disentangle orbital effects from uncertainties in the dust density distribution.
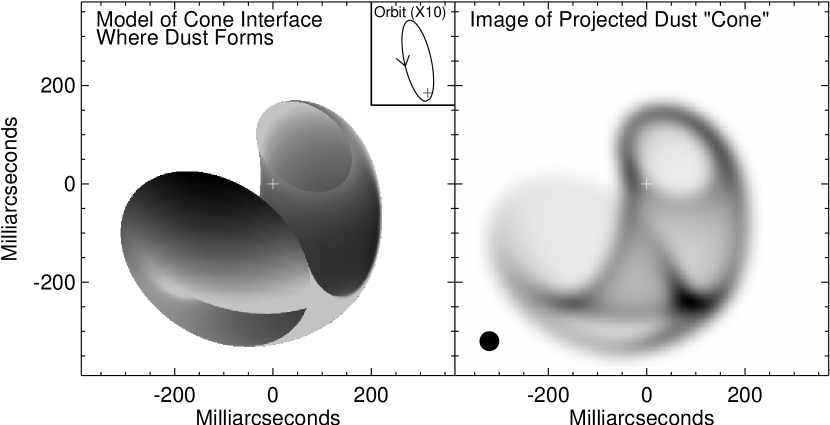
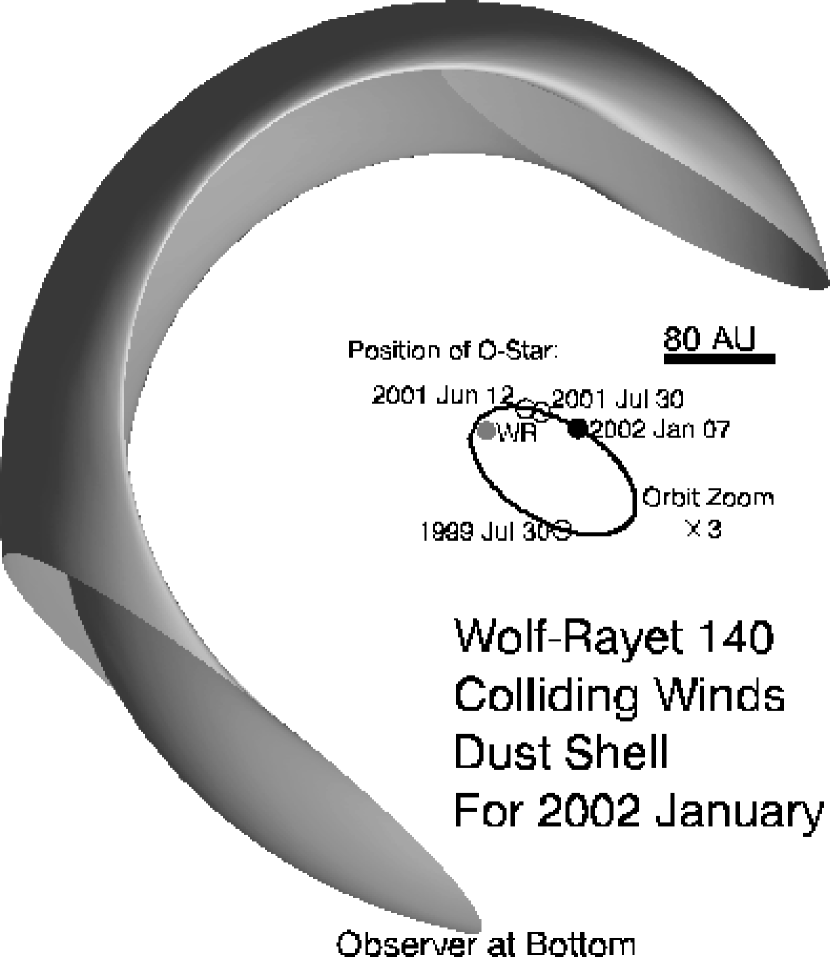
Figure 3 shows a schematic of the WR 140 binary orbit and dust shell which is qualitatively consistent with our new results and the orbital elements of Williams et al. (1990). The triggered dust shell is rendered from a top-down perspective with the observer located at the bottom on the image, viewing the dust from some currently unknown inclination angle. This basic picture has the correct orbital rotation as implied by the preliminary VLBA results, and can explain why the projected velocities of the eastern dust features are fast compared to the slower-moving western features that have significant out-of-the-plane motions.
WR 137 is another eccentric WR+O system which episodically produces dust. Marchenko et al. (1999) found evidence for production of a dust “jet” in one direction and dust clouds moving away in the opposite direction around periastron. These authors hypothesized that dust production might occur in localized clumps and not smoothly throughout the wind collision zone. The dust features in the circumstellar environment of WR 140 could be interpreted also as isolated dust clumps, and we require additional orbital information to investigate this further. Such clumps might form through cooling instabilities in the post-shock gas or could be seeded by dense clumps in the WR wind itself (e.g., Moffat & Robert 1994).
Lastly, our interpretation of the WR 140 dust shell is somewhat hindered by the fact that we are not sure if the near-infrared dust opacity is optically thick, although our observations are long enough after periastron that the dust clouds have likely significantly expanded and become optically thinner. Dust emission in the mid-infrared should surely be optically-thin and thus trace out the full volume of the emitted dust. As the dust cools rapidly moving away from the central sources (as carefully shown in Williams et al. 1990), further near-infrared imaging of the thermal emission will be difficult until the next periastron in 2009. However mid-infrared emission is observable for longer than near-infrared, and also scattered light imaging in the near-infrared might be possible using adaptive optics.
4 Conclusions
We have presented the first resolved images of the transient dust shell formed around the WR 140 colliding wind binary once every 7.94 years during periastron passage. Our multi-epoch images show clear expansion of the nebula, but resist detailed interpretation due to inadequate knowledge of the orbital geometry. We interpret the emission as indicating a highly inclined view of the dust plume and/or very clumpy and inhomogeneous dust production. We have shown that an optically-thin “cone” of dust generated in a WR 140-like system can indeed show a variety of complex features if viewed near edge-on. With full orbital elements, we may be able to use these images to map out the dust distribution on the surface of the wind-wind interface cone between the colliding winds. Although the near-infrared thermal emission quickly fades, the dust shell will be readily observable in the mid-infrared for years and should be well-resolved from the central source using 8-m class telescopes. We urge the community to take advantage of the unique opportunity to observe this rapidly evolving system for the next few years in order to extract maximal information on this important prototypical colliding wind source.
References
- Baldwin et al. (1986) Baldwin, J. E., Haniff, C. A., Mackay, C. D., & Warner, P. J. 1986, Nature, 320, 595
- Canto et al. (1996) Canto, J., Raga, A. C., & Wilkin, F. P. 1996, ApJ, 469, 729+
- Cornwell & Wilkinson (1981) Cornwell, T. J. & Wilkinson, P. N. 1981, MNRAS, 196, 1067
- Eichler & Usov (1993) Eichler, D. & Usov, V. 1993, ApJ, 402, 271
- Hackwell et al. (1976) Hackwell, J. A., Gehrz, R. D., Smith, J. R., & Strecker, D. W. 1976, ApJ, 210, 137
- Högbom (1974) Högbom, J. A. 1974, A&AS, 15, 417
- Jennison (1958) Jennison, R. C. 1958, MNRAS, 118, 276+
- Marchenko et al. (1999) Marchenko, S. V., Moffat, A. F. J., & Grosdidier, Y. 1999, ApJ, 522, 433
- Matthews et al. (1996) Matthews, K., Ghez, A. M., Weinberger, A. J., & Neugebauer, G. 1996, PASP, 108, 615+
- Matthews & Soifer (1994) Matthews, K. & Soifer, B. T. 1994, Infrared Astronomy with Arrays: the Next Generation, I. (Dordrecht: Kluwer Academic Publishers), 239
- Moffat et al. (1987) Moffat, A. F. J., Lamontagne, R., Williams, P. M., Horn, J., & Seggewiss, W. 1987, ApJ, 312, 807
- Moffat & Robert (1994) Moffat, A. F. J. & Robert, C. 1994, ApJ, 421, 310
- Monnier (1999) Monnier, J. D. 1999, PhD thesis, University of California at Berkeley
- Monnier et al. (1999) Monnier, J. D., Tuthill, P. G., & Danchi, W. C. 1999, ApJ, 525, L97
- Narayan & Nityananda (1986) Narayan, R. & Nityananda, R. 1986, ARA&A, 24, 127
- Pearson & Readhead (1984) Pearson, T. J. & Readhead, A. C. S. 1984, ARA&A, 22, 97
- Setia Gunawan et al. (2001) Setia Gunawan, D. Y. A., van der Hucht, K. A., Williams, P. M., Henrichs, H. F., Kaper, L., Stickland, D. J., & Wamsteker, W. 2001, A&A, 376, 460
- Sivia (1987) Sivia, D. 1987, PhD thesis, Cambridge University
- Skilling & Bryan (1984) Skilling, J. & Bryan, R. K. 1984, MNRAS, 211, 111+
- Tuthill et al. (1999) Tuthill, P. G., Monnier, J. D., & Danchi, W. C. 1999, Nature, 398, 487
- Tuthill et al. (2000) Tuthill, P. G., Monnier, J. D., Danchi, W. C., Wishnow, E. H., & Haniff, C. A. 2000, PASP, 112, 555
- Usov (1991) Usov, V. V. 1991, MNRAS, 252, 49
- White & Becker (1995) White, R. L. & Becker, R. H. 1995, ApJ, 451, 352+
- Williams et al. (1978) Williams, P. M., Beattie, D. H., Lee, T. J., Stewart, J. M., & Antonopoulou, E. 1978, MNRAS, 185, 467
- Williams et al. (1990) Williams, P. M., van der Hucht, K. A., Pollock, A. M. T., Florkowski, D. R., van der Woerd, H., & Wamsteker, W. M. 1990, MNRAS, 243, 662