The Optical Afterglow of the Gamma-Ray Burst GRB 011211111Based on observations collected at the OGLE 1.3m telescope, the Magellan 6.5m Walter Baade telescope, the FLWO 1.2m telescope, and the Vatican Advanced Technology Telescope.
Abstract
We present early-time optical photometry and spectroscopy of the optical afterglow of the gamma-ray burst GRB 011211 (catalog ). The spectrum of the optical afterglow contains several narrow metal lines which are consistent with the burst occurring at a redshift of . The optical afterglow decays as a power law with a slope of for the first days after the burst at which time there is evidence for a break. The slope after the break is . There is evidence for rapid variations in the -band light approximately 0.5 days after the burst. These variations suggest that there are density fluctuations near the gamma-ray burst on spatial scales of approximately 40–125 AU. The magnitude of the break in the light curve, the spectral slope, and the rate of decay in the optical, suggest that the burst expanded into an ambient medium that is homogeneous on large scales. We estimate that the local particle density is between approximately 0.1 and 10 cm-3 and that the total gamma-ray energy in the burst was – erg. This energy is smaller than, but consistent with, the “standard” value of erg. Comparing the observed color of the optical afterglow with predictions of the standard beaming model suggests that the rest-frame -band extinction in the host galaxy is mag.
1 Introduction
The gamma-ray burst (GRB) GRB 011211 (catalog ) was detected in the constellation Crater by the BeppoSAX satellite at 19:09:21 UT on 2001 Dec. 11. The burst was a shallow, long event with two peaks and a total duration of approximately 270 s making it the longest event that has been localized by BeppoSAX. The temporal profiles of the event were similar in gamma- and -rays. BeppoSAX measured a gamma-ray fluence of erg cm-2 between 40 keV and 700 keV (Frontera et al., 2002). Approximately ten hours after the burst occurred Grav et al. (2001) identified an optical source within the BeppoSAX error circle that was not present in the Digital Sky Survey 2. Bloom & Berger (2001) and Jensen et al. (2001a) reported that this source was fading and Soszyński et al. (2001) estimated that it had a power law decay with a slope of . Fruchter et al. (2001) found, and Gladders et al. (2001) confirmed, a redshift of based on several absorption lines in the spectrum of the optical afterglow (OA). Burud et al. (2001) identified a host galaxy with and found that the OA is offset southeast from the center of this object.
In this paper we present photometry and spectroscopy of the OA of GRB 011211 (catalog ) taken between and 2.7 days after the burst occurred. Our data suggests that there were rapid fluctuations in the optical flux approximately 12 hours after the burst occurred. We adopt a cosmology with a Hubble parameter of km s-1 Mpc-1, a matter density of , and a cosmological constant of . For this cosmology a redshift of corresponds to a luminosity distance of 18.18 Gpc and a distance modulus of 46.30. One arcsecond corresponds to 28.06 comoving kpc, or 8.94 proper kpc. The lookback time is 11.28 Gyr.
2 The Photometric Data
The OA for GRB 011211 (catalog ) is located at R.A. 11:15:17.98, Dec. 21:56:56.2 (J2000) (Grav et al., 2001), which corresponds to Galactic coordinates of . The reddening maps of Schlegel et al. (1998) give a Galactic reddening of mag in this direction. The corresponding Galactic extinctions are , , and . We estimate the extinction in the host galaxy in § 7.
Our photometry data was collected at three telescopes: the Optical Gravitational Lensing Experiment (OGLE) 1.3m telescope at the Las Campanas Observatory, the Magellan 6.5m Walter Baade telescope at Las Campanas, and the Fred Lawrence Whipple Observatory (FLWO) 1.2m telescope. The OGLE 1.3m telescope was equipped with the 8k 8k OGLE-III CCD, which a had a scale of per pixel, a gain setting of 1.0 e-/ADU, and a read-out noise of 5 e-. The Magellan images were taken with the LDSS-2 imaging spectrograph in its imaging mode. It had a scale of per pixel, a gain of 1.0 e-/ADU, and a read-out noise of 7 e-. The FLWO images were taken with the “4Shooter” CCD mosaic (Szentgyorgyi et al., 2002). The pixel scale was (binned ), the gain was 4.0 e-/ADU, and the read-out noise was 10 e-. A log of the observations is given in Table 1. Fig. 1 shows the field containing the OA.
| UT Date | JD2450000 | Telescope | Filter | Magnitude | Seeing () | Exposure (s) | |
|---|---|---|---|---|---|---|---|
| Dec. 12.3028 | 2255.8063 | 0.5081 | OGLE | 600 | |||
| Dec. 13.2668 | 2256.7670 | 1.4688 | OGLE | 600 | |||
| Dec. 14.4844 | 2257.9844 | 2.6862 | FLWO | 2 600 | |||
| Dec. 12.2482 | 2255.7482 | 0.4500 | OGLE | 180 | |||
| Dec. 12.2500 | 2255.7500 | 0.4518 | Baade | 60 | |||
| Dec. 12.2567 | 2255.7567 | 0.4585 | OGLE | 600 | |||
| Dec. 12.2771 | 2255.7771 | 0.4789 | OGLE | 600 | |||
| Dec. 12.2945 | 2255.7945 | 0.4963 | OGLE | 600 | |||
| Dec. 12.3226 | 2255.8226 | 0.5244 | OGLE | 600 | |||
| Dec. 12.3400 | 2255.8400 | 0.5418 | Baade | 60 | |||
| Dec. 13.2418 | 2256.7418 | 1.4436 | OGLE | 600 | |||
| Dec. 13.3432 | 2256.8432 | 1.5450 | OGLE | 600 | |||
| Dec. 13.3147 | 2256.8147 | 1.5165 | Baade | 60 | |||
| Dec. 14.5132 | 2258.0132 | 2.7150 | FLWO | 2 900 | |||
| Dec. 12.2662 | 2255.7662 | 0.4680 | OGLE | 600 | |||
| Dec. 12.2863 | 2255.7863 | 0.4881 | OGLE | 600 | |||
| Dec. 12.3145 | 2255.8145 | 0.5163 | OGLE | 600 | |||
| Dec. 12.3307 | 2255.8307 | 0.5325 | OGLE | 600 | |||
| Dec. 13.2559 | 2256.7559 | 1.4577 | OGLE | 600 | |||
| Dec. 13.3533 | 2256.8533 | 1.5551 | OGLE | 600 | |||
| Dec. 14.5153 | 2258.0153 | 2.7171 | FLWO | 2 600 |
Note. — No corrections for extinction have been applied to the photometry in this Table.
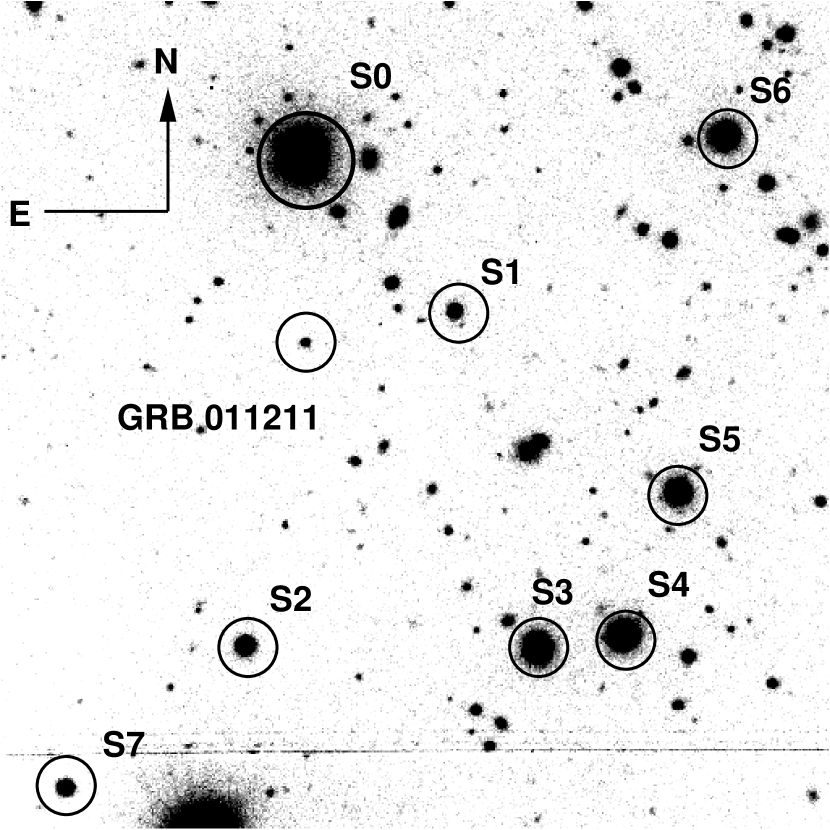
The field stars around GRB 011211 (catalog ) were calibrated on 2002 Jan. 12 (UT) using images taken with the Vatican Advanced Technology Telescope. Landolt standard fields (Landolt, 1992) were observed in filters throughout the night under photometric conditions. We derived airmass and color corrections and computed magnitudes for eight stars near GRB 011211 (catalog ). These magnitudes and colors are given in Table 2. The magnitudes for the USNO-A2 star U0675_11427359 (catalog ) (our star S2) are consistent with those of Henden (2002).
| Star | R.A.(J2000) | Dec.(J2000) | |||||
|---|---|---|---|---|---|---|---|
| S0 | 11:15:18.02 | 21:56:13.2 | |||||
| S1 | 11:15:15.52 | 21:56:49.4 | |||||
| S2 | 11:15:19.02 | 21:58:05.1 | |||||
| S3 | 11:15:14.21 | 21:58:06.4 | |||||
| S4 | 11:15:12.82 | 21:58:03.6 | |||||
| S5 | 11:15:11.88 | 21:57:31.2 | |||||
| S6 | 11:15:11.05 | 21:56:10.0 | |||||
| S7 | 11:15:21.96 | 21:58:36.6 |
Note. — These stars are identified in Fig. 1.
We used DAOPhot II (Stetson, 1987) and AllStar (Stetson & Harris, 1988) to perform point-spread function fitting photometry on the calibrated field stars, and on the OA, on each image. A zero-point offset was calculated for each filter on each night and applied to the observed magnitudes. Our calibrated photometry for the OA is presented in Table 1. The two FLWO images in each band were averaged to obtain the final images. The OA was not detected in any of our 2001 Dec. 14 FLWO images. Therefore, we estimated upper limits to the brightness of the OA on 2001 Dec. 14.5 from the limiting magnitudes of these images, which are listed in Table 1.
The OA is consistent with a point source in all of our images. We aligned and co-added all of our -band images to obtain a deep image (shown in Fig. 1) with a limiting magnitude of . There is no evidence for a host galaxy in this image.
3 The Spectral Data
A spectrum of the OA was obtained with the Magellan 6.5m Walter Baade telescope using the LDSS-2 imaging spectrograph on 2001 Dec. 13.3 UT, approximately 1.5 days after the burst. The slit width was and the total exposure time was s. The resolution is Å. The spectra were reduced in the standard manner and the wavelength calibration was done using a He–Ne arc. Several weak metal lines were identified to determine the redshift of the system. These are listed in Table 3. The mean redshift is (standard error [se]). Table 3 also lists the observed and rest-frame equivalent widths for each line.
The measured absorption line widths for GRB 011121 (catalog ) are quite similar to those observed in GRB 000301C (catalog ) (Jensen et al., 2001b) but weaker than the exceptional case of GRB 000926 (catalog ) (Castro et al., 2001; Fynbo et al., 2002). Both of these GRBs have redshifts similar to that of GRB 011211 (catalog ). We also observe an unidentified, broad feature at approximately 4600 Å. This may be an additional absorption system along the line of sight, but the signal-to-noise ratio of our spectrum is not high enough to confirm this hypothesis. A plot of the spectrum, with our line identifications, is given in Fig. 2.
| Line | (Å) | (Å) | EW (Å) | EW0 (Å) | |
|---|---|---|---|---|---|
| Si II/ | 4090.2 | 1304.4 | 2.1358 | 11.28 | 3.59 |
| O I | 1304.9 | 2.1346 | |||
| Si IV | 4296.1 | 1368.1 | 2.1390 | 5.41 | 1.72 |
| Cr II | 4415.6 | 1406.3 | 2.1399 | 2.17 | 0.69 |
| Cr II | 4467.0 | 1422.7 | 2.1398 | 2.84 | 0.90 |
| Si II | 4794.0 | 1526.7 | 2.1401 | 4.17 | 1.33 |
| C IV | 4865.3 | 1548.2 | 2.1426 | 4.08 | 1.30 |
| Al II | 5247.8 | 1670.8 | 2.1409 | 5.11 | 1.63 |
| Fe III | 6875.2 | 2189.6 | 2.1399 | 3.42 | 1.09 |

4 The Optical Light Curve
The light curves of the OA of GRB 011211 (catalog ) are shown in Fig. 3. The flux from the host galaxy (Burud et al., 2001) has not been subtracted. The pixel sizes in our images are comparable to the reported offset between the OA and the host (), so our quoted magnitudes include the flux from both the OA and the host galaxy. However, the host is faint enough that it will contribute only % of the flux when the OA has and % of the flux when the OA has . This corresponds to systematic errors of only 0.01–0.10 mag. Therefore, we believe that the flux from the host galaxy does not significantly affect our results.
We fit all of the data in Table 1 up to 1.6 days after the burst with a power law of the form
| (1) |
where is the magnitude for filter , is the photometric zero point for filter taken from Fukugita et al. (1995), is the time in days since the burst occurred, is the slope, and is a normalization constant representing the flux from the OA in filter one day after the burst. The best-fitting power law to our data has with and a root-mean-square (RMS) residual of 0.09 mag.

Our power-law fit suggests that the OA should have at days. However, we find that the OA has at this time, fainter than the predicted magnitude. This non-detection suggests that a break occurred in the light curve between 1.52 and 2.72 days after the burst. If the break occurred at more than 1.52 days then the late-time decay has a slope of , which corresponds to the decay becomeing steeper by . The FLWO -band data are consistent with this, but the FLWO -band data are consistent with there being no break in the light curve. Burud et al. (2001) found for the OA ten days after the burst. If we fit a broken power law to our -band data and their point we find a late-time slope of and a break time of days, which are consistent with the estimates of the late-time slope and break time made using only our data.
Fig. 3 shows that a single power law with a slope of is a good fit to the data up to 1.52 days after the burst. Using Eq. 1 we find colors of , , and before the break. We stress that these colors are corrected for Galactic extinction, but not for extinction in the host galaxy of GRB 011211 (catalog ). In § refSECTION:extinct we show that the extinction in the host along the line of sight to the burst is probably small compared to the Galactic extinction in that direction. Assuming a spectrum of the form we find a weighted mean dereddened spectral slope from these colors of (se). This is similar to the dereddened spectral slope found for many other GRBs.
5 The Energy in the Burst
The BeppoSAX fluence is erg cm-2 in the 40–700 keV band (Frontera et al., 2002). Applying a cosmological correction (Bloom et al., 2001) this fluence corresponds to an isotropic equivalent energy of erg between 20 keV and 2000 keV. Our correction assumes that the gamma-ray spectrum has the same form as the Band et al. (1993) spectrum with , , and keV. These are the cannonical values for a GRB’s gamma-ray spectrum but Band et al. (1993) found that they are not universal values and that individual bursts can have very different spectral shapes. We estimated the uncertainty in our correction to be % based on changing the spectral shape parameters by factors of two.
The opening angle, , of a GRB jet is related to the time of the break in the light curve (Rhoads, 1999; Sari et al., 1999). Frail et al. (2001) cast this relation as
| (2) |
where is the efficiency of converting energy in the ejecta into gamma rays and is the circumburst particle density. Frail et al. (2000) and Panaitescu & Kumar (2001) find cm-3 in the vicinity of five GRBs with a median number density of cm-3. Therefore, we adopt this as the circumburst number density. We will assume, as did Frail et al. (2001), that . Eq. 2 gives – for break times of – days. From this we estimate that GRB 011211 (catalog )’s total beamed energy in gamma rays, after correcting for the beam geometry, was – erg. This is only smaller than the “standard” total beamed energy in gamma rays of erg (Frail et al., 2001; Piran et al., 2001; Panaitescu & Kumar, 2002). This agreement suggests that our assumptions of and cm-3 are reasonable.
In order for to equal the “standard” value the opening angle of the beam needs to be . This corresponds to a break time of days, which is inconsistent with the observed brightness of the OA on 14 Dec. 2001. An opening angle of can be made consistent with our estimate of the break time by increasing the circumburst particle density to –30 cm-3. This is at the high end of the range of particle densities found by Frail et al. (2000) and Panaitescu & Kumar (2001) for several GRBs, but not inconsistent with there results. Therefore, we believe that the environment of GRB 011211 (catalog ) was similar to the environments of other GRBs.
6 The Ambient Medium Near the Burst
For a collimated outflow into an ambient medium with a number density distribution of the form (Panaitescu et al., 1998; Mészáros et al., 1998) the power-law index, , is related to the observed magnitude of the break in the light curve by . We find , which corresponds to . This is not consistent with expansion into an ambient medium that is dominated by a pre-existing stellar wind (), but might be consistent with expansion into a homogeneous medium (). If the ambient medium is, on average, uniform then the magnitude of the break in the light curve should be , which implies a late-time slope of . This is consistent with the late-time slope that we find () from our non-detection of the OA on 2001 Dec. 14. We note that it is also in good agreement with the late-time slope that we find () using the data of Burud et al. (2001). Further evidence that the ambient medium is not dominated by a pre-existing stellar wind comes from the relationships between the time and spectral evolutions of the flux in a homogeneous medium (Sari et al., 1999) and in a wind (Chevalier & Li, 1999). Using the observed pre-break slope of the light curve a homogeneous medium predicts for in the fast cooling regime, which is within of the observed value. In the slow cooling regime the predicted slope is , which is a worse agreement. A pre-existing wind predicts for the fast cooling case and , for the slow cooling case. Both are worse fits than the fast-cooling homogeneous medium model (although all four cases are within of the observed value). Therefore, we believe that a homogeneous medium with fast-cooling electrons provides better agreement to the observations than the wind model does. The electron power law distribution index for this case is , which is consistent with what is seen in other bursts.
Fig. 4 suggests that there may be rapid variations in the -band light days after the burst. To test this we subtracted the best-fitting power-law from the -band magnitudes and computed the residuals. The -band residuals have a weighted mean of with an RMS of 0.10 mag. This says that we can reject the hypothesis that the residuals are consistent with random scatter about a power-law decay at the 95% confidence level. Therefore, we believe that the small-scale variations in the -band light days after the burst may be real. We find no evidence for variability in the -band data.

Garnavich et al. (2000) have postulated that the rapid variability seen in GRB 000301C (catalog ) was due to gravitational microlensing. However the rapid -band variations seen in GRB 011211 (catalog ) are much smaller than those seen in the OA of GRB 000301C (catalog ). An alternate explanation is that there is small-scale structure in the local medium around the burst. Wang & Loeb (2000) find that linear density variations on spatial scales of – AU in the ambient medium that a GRB is expanding into can cause rapid fluctuations in the optical flux similar to those seen in Fig. 4. Their methodology predicts fluctuations of approximately 5%–10% over time periods of –1.50 hours for GRB 011211 (catalog ). The observed scatter in the -band magnitudes of several field stars is 0.06 mag and the RMS residual in the OA magnitudes is 0.10 mag. Therefore the RMS fractional variability in the band at about 0.5 days after the burst is % on time-scales of –2 hours. This is consistent with the predicted variability.
Using Table 3 of Wang & Loeb (2000), and the values for the isotropic equivalent energy of the burst and the density of the circumburst medium that we find in Sect. 5, we can estimate the size of the density fluctuations near the burst and the radius of the shock front. For erg and –10 cm-3 the observed -band fluctuations correspond to typical density variations on spatial scales of –125 AU. At 0.5 days after the burst the radius of the shock front is –40 000 AU1. (The apparent faster-than-light motion of the shock front is an illusion caused by the highly relativistic velocity of the shock front.) Therefore, the density fluctuations are small compared to the region that has been swept out by the GRB and our finding that the circumburst environment can be represented by a homogeneous medium is, on average, valid. The density fluctuations are between (for cm-3) and (for cm-3). Smaller regions will have larger density fluctuations than larger regions will. These fluctuations are similar to those seen in the interstellar medium in our Galaxy (Diamond et al., 1989; Faison & Goss, 2001).
7 Extinction in the Host
We can estimate the amount of extinction in the host galaxy along the line of sight to GRB 011211 (catalog ) by comparing the observed spectral slope after correcting for Galactic reddening () to the predicted intrinsic slope found in § 6 (). This difference corresponds to in the host galaxy, which yields an extinction is in the observer’s frame. Using the extinction law of Cardelli et al. (1989) we find in the rest-frame of the burst. This result depends somewhat on the details of the extinction law used, but it suggests that there is no significant extinction along the line of sight to GRB 011211 (catalog ) in its host galaxy.
8 Conclusions
We present early-time photometry and spectroscopy of the OA of GRB 011211 (catalog ) starting approximately 0.5 days after the burst. The spectrum contains several narrow metal lines that are consistent with a redshift of . There is an unidentified broad feature at Å that may be an absorption system along the line of sight to the GRB.
The OA is red with a spectral slope between 5505 Å and 8060 Å of after correcting for Galactic extinction, but ignoring extinction in the host. This corresponds to a color of . The magnitude of the break in the optical decay is consistent with the burst expanding into an approximately homogeneous medium. If we assume that GRBs have a the standard energy suggested by Frail et al. (2001), Piran et al. (2001), and Panaitescu & Kumar (2002) then the ambient medium near the burst has a particle density of 0.1–10 cm-3. Comparing the observed color of the OA with predictions of the standard beaming model suggests that the rest-frame -band extinction in the host galaxy is mag.
GRB 011211 (catalog ) follows the same broad pattern established by other long-duration GRBs. The OA decays as a power law with a slope of for the first days, and there is evidence for a break occurring between 1.52 and 2.72 days after the burst. The slope of the light curve after the break is . We find evidence for variations of % in the flux on time scales of 1–2 hours occurring approximately half a day after the burst. Interpreting this in the framework of Wang & Loeb (2000) suggests that there are density fluctuations with scales of approximately 40–125 AU within –0.20 pc of the GRB’s progenitor. The discovery of rapid variations in the optical light from a GRB highlights the importance of continuous, high-precision observations of GRBs at early times.
References
- Band et al. (1993) Band, D., et al. 1993, ApJ, 413, 281
- Bloom & Berger (2001) Bloom, J. S., & Berger, E. 2001, GCNC 1193
- Bloom et al. (2001) Bloom, J. S., Frail, D. A., & Sari, R. 2001, AJ, 121, 2879
- Burud et al. (2001) Burud, I., Rhoads, J., Fruchter, A., & Hjorth, J. 2001, GCNC 1213
- Cardelli et al. (1989) Cardelli, J. A., Clayton, G. C., & Mathis, J. S. 1989, ApJ, 345, 245
- Castro et al. (2001) Castro, S., Galama, T. J., Harrison, F. A., Holtzman, J. A., Bloom, J. S., Djorgovski, S. G., & Kulkarni, S. R. 2001, astro-ph/0110566
- Chevalier & Li (1999) Chevalier, R. A., & Li, Z.-Y. 1999, ApJ, 520, L29
- Diamond et al. (1989) Diamond, P. J., Goss, W. M., Romney, J. D., Booth, R. S., Kalberla, P. M. W., & Mebold, U. 1989, ApJ, 347, 302
- Faison & Goss (2001) Faison, M. D., & Goss, W. M. 2001, AJ, 121, 2706
- Frail et al. (2000) Frail, D. A., Waxman, E., & Kulkarni, S. R. 2000, ApJ, 537, 191
- Frail et al. (2001) Frail, D. A., et al. 2001, ApJ, 562, L55
- Frontera et al. (2002) Frontera, F., Amati, L., Montanari, E., Costa, E., Feroci, M., Piro, L., Heise, J., & in ’t Zand J. J. M. 2002, GCNC 1215
- Fruchter et al. (2001) Fruchter, A., Vreeswijk, P., Rhoads, J., & Burud, I. 2001, GCNC 1200
- Fukugita et al. (1995) Fukugita, M., Shimasaku, K., & Ichikawa, T. 1995, PASP, 107, 945
- Fynbo et al. (2002) Fynbo, J. U., et al. 2002, to appear in Lighthouses of the Universe, astro-ph/0110603
- Garnavich et al. (2000) Garnavich, P. M., Loeb, A., & Stanek, K. Z. 2000, ApJ, 544, L11
- Gladders et al. (2001) Gladders, M., Holland, S. T., Garnavich, P. M., Jha, S., Stanek, K. Z., Bersier, D., & Barrientos, L. F. 2001, GCNC 1209
- Grav et al. (2001) Grav, T., Hansen, M. W., Pedersen, H., Hjorth, J, Michelsen, R., Jensen, B. L., Andersen, M. I., Gorosabel, J., & Fynbo, J. U. 2001, GCNC 1191
- Henden (2001) Henden, A. 2001, GCNC 1197
- Henden (2002) Henden, A. 2002, GCNC 1303
- Jensen et al. (2001a) Jensen, B. L., et al. 2001a, GCNC 1195
- Jensen et al. (2001b) Jensen, B. L., et al. 2001b, A&A, 370, 909
- Landolt (1992) Landolt, A. U. 1992, AJ, 104, 340
- Mészáros et al. (1998) Mészáros, P., Rees, M. J., & Wijers, R. A. M. J. 1998, ApJ, 499, 301
- Piran et al. (2001) Piran, T., Kumar, P., Panaitescu, A., & Piro, L. 2001, ApJ, 560, L167
- Panaitescu et al. (1998) Panaitescu, A., Mészáros, P., & Rees, M. J. 1998, ApJ, 503, 314
- Panaitescu & Kumar (2001) Panaitescu, A., & Kumar, P. 2001, ApJ, 554, 667
- Panaitescu & Kumar (2002) Panaitescu, A., & Kumar, P. 2002, ApJ, in press, astro-ph/0109124
- Rhoads (1999) Rhoads, J. E. 1999, ApJ, 525, 737
- Sari et al. (1998) Sari, R., Piran, T., & Natarayan, R.. 1998, ApJ, 497, L17
- Sari et al. (1999) Sari, R., Piran, T., & Halpern, J. P. 1999, ApJ, 519, L17
- Schlegel et al. (1998) Schlegel, D. J., Finkbeiner, D. P., & Davis, M. 1998, ApJ, 500, 525
- Soszyński et al. (2001) Soszyński, I., Holland, S. T., Garnavich, P. M., Bersier, D., Jha, S., & Stanek, K. S. 2001, GCN 1199
- Stanek et al. (2001) Stanek, K. Z., et al. 2001, ApJ, 563, 592
- Stetson (1987) Stetson, P. B. 1987, PASP, 99, 191
- Stetson & Harris (1988) Stetson, P. B., & Harris, W. E. 1988, AJ, 96, 909
- Szentgyorgyi et al. (2002) Szentgyorgyi, A. H., et al. 2002, in preparation
- Wang & Loeb (2000) Wang, X., & Loeb, A. 2000, ApJ, 535, 788