Chandra HRC and HST observations of NGC6240: resolving the AGN and Starburst
Abstract
We present high spatial resolution X-ray Chandra HRC and HST WFPC2 H observations of the prototypical infrared luminous galaxy NGC6240. The central region of this system shows a remarkably complex morphology, with filaments and loops observed in the optical and X-rays. The total X-ray luminosity is dominated by the extended emission. Both nuclei are clearly detected in the HRC image and both appear to be extended. The energetics of the nuclei imply that the southern nucleus is the more plausible counterpart to the obscured AGN. The overall SED of the galaxy is in good agreement with a blend of starburst and AGN components which have similar bolometric luminosities, ergs s-1, with the starburst dominating the observed continuum in the near-IR (K-band), optical and soft X-ray bands.
keywords:
Galaxies: active–Galaxies: starburst–Galaxies: individual: NGC62401 Introduction
NGC6240 is a prototypical luminous infrared galaxy. Its high IR luminosity () and proximity ( Mpc, for , H km s-1 Mpc-1) have made it the subject of numerous studies at all wavelengths. Its central region exhibits an extremely complex optical morphology with two distinctive nuclei, whilst at larger radii a distorted disc-like system with extended tidal tails is observed. ROSAT HRI observations of the galaxy show that extended luminous emission can be traced out to a radius of (Komossa, Schulz & Greiner, 1998).
Starburst activity dominates the emission of NGC6240 at most wavelengths. Optical spectroscopy classifies the nuclei as LINER (Veilleux et al. 1995), whilst integral field near-IR observations show that the K band is dominated by red supergiants (Tecza et al. 2000). Mid-IR ISO data, however, reveal a weak OIV line, indicative of the presence of an active nucleus (Genzel et al. 1998). The definite presence of an AGN is seen only in X-rays, with a hard reflected component observed below 10 keV (Iwasawa & Comastri 1998, hereafter IC98) and direct transmitted emission detected above this energy (Vignati et al. 1999). The estimated unabsorbed X-ray luminosity in the 2-10 keV energy band is erg s-1, implying a bolometric AGN luminosity of a few times erg s-1. Which of the two nuclei corresponds to the active source is not known, and it is possible that both could harbor an AGN. This paper provides the first direct observation in X-rays that resolves the two nuclei and the complex extended emission.
2 Observations
Chandra observations of NGC6240 were obtained using the HRC-I detector (Murray et al. 1997) on the 16th of February 2000 with an exposure time of 8.8 ksec. The HRC-I is a microchannel plate detector optimised for imaging but has no energy resolution. Its pixel size of provides a good sampling of the telescope PSF (FWHM ).
HST observations of NGC6240 were obtained using the PC camera on the 23rd of March 1999 through both wide and narrow-band filters (PI: van der Marel). Observations obtained with the F673N filter ( Å, Å), corresponding to the redshifted H wavelength ( Å), are presented here.
3 Extended emission
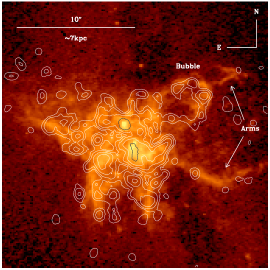
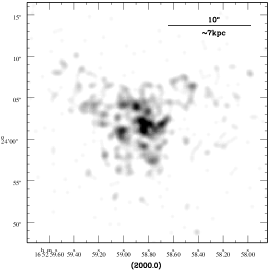
Figure 1 shows the central region of NGC6240 as observed by Chandra. No other emission associated with the galaxy was detected outside this region. A total of 509 counts were detected within a radius of 10.5″, of which about correspond to background emission, which was determined from a large area free of X-ray sources. The data have been slightly smoothed in order to increase the signal-to-noise using a Gaussian with . The emission is clearly extended and presents a filamentary and clumpy morphology with several concentrations of emission.
Figure 2 shows the HST H image with X-ray contours overlaid. The H data shows remarkable structure, with very extended filaments and loops. This complex morphology is suggestive of gas outflowing from the distorted main plane of the galaxy, which is roughly coincident with the orientation of the dark dust lane seen in our figure at a PA of (east from north - for a larger V-band image of the galaxy see Fig 1 in Colbert et al. 1994; for a discussion on the H morphology see Heckman, Armus & Miley 1990). Spectroscopic evidence for the presence of an outflowing galactic wind has been discussed by Heckman, Armus & Miley (1990) who derived an internal velocity dispersion in excess of 1000 km s-1, which is highest at the position angle coincident with the minor axis of the galaxy.
The most interesting spatial features can be seen to the west in Fig 2, where two giant ‘arms’ can be seen in H emission extending 9″ ( kpc) perpendicularly to the galactic plane with an opening angle , suggesting a limb-brightened cone-like outflow. The base of the northern arm presents a spectacular ‘bubble’ morphology with dimensions ( kpc). On the other hand, the eastern region has higher surface brightness and a less clearly defined morphology, possibly resulting from a more dense ambient medium which slows down and diverts the outflowing wind.
The X-ray contours follow remarkably well most of the structures seen in H. On the western side of the galaxy, however, most of the X-ray emission is associated with the bubble, while the southern arm shows little emission. This in part could be due to the presence of the dust lane. Most of the observed X-ray emission is diffuse although some knots with higher surface brightness are seen in the central region (see Figure 1), particularly the areas associated with the nuclei (see Section 4).
To obtain X-ray fluxes from the HRC observations we must assume a spectral shape for the emission within the standard 0.08-10 keV energy band of the instrument. From ASCA observations we know that thermal emission and a power law are required to explain the observed X-rays in the 0.5-10 keV energy range (IC98). The power law is very hard and corresponds to scattered light from the obscured AGN. The thermal emission is most probably related to the starburst activity and at least two components are needed: a warm ( keV) and obscured ( cm-2) component, probably arising from the innermost regions of the starburst, and a cool ( keV) and less absorbed ( cm-2) component, associated with the more external regions of the galactic wind (IC98). These results are in good agreement with what is observed in other well studied starburst galaxies such as M82, Arp 299 and NGC3256 (Strickland, Ponman & Stevens 1997, Heckman et al. 1999, Lira et al. 2002).
The extent and morphology of the observed X-ray emission suggests that the bulk of it is associated with an ongoing starburst. Assuming that the thermal components observed with ASCA are a good representation for the extended emission seen in Fig 1 (after removing the emission associated with the nuclei), we find an absorbed flux of ergs s-1 cm-2 in the 0.08-10 keV energy band (from an aperture in diameter). The unabsorbed flux corresponds to ergs s-1 cm-2 ( ergs s-1), depending on the spectral parameters of the warmer component. This diffuse component dominates the X-ray emission in the 0.08-10 keV energy range. The implied 0.5-2.0 keV flux corresponds to ergs s-1 cm-2, which is similar to the ergs s-1 cm-2 flux determined by IC98 in the same spectral range.
The total H flux within an aperture of 18″ in diameter, corresponds to ergs s-1 cm-2 To correct for extinction we must estimate the value of towards the starburst. NICMOS colour maps suggest a highly variable extinction, with (Scoville et al. 2000). This is in agreement with the extinction map derived by Tecza et al. (2000). Assuming an average , we derived a corrected total H flux of ergs s-1 cm-2, and a total luminosity ergs s-1.
A non-thermal radio source with flux 22.5 mJy (cm) is coincident with the bubble seen in the western region of NGC6240 (source W1 in Colbert et al. 1994). The source is more compact than the structures seen in H and X-rays () and from the crude positional information we extracted from Fig 3a in Colbert et al. (1994) it appears to be located towards the top region of the bubble. The H flux associated with the bubble is ergs s-1 cm-2. Assuming the corrected H flux is ergs s-1 cm-2. The observed X-ray flux is ergs s-1 cm-2 (from an aperture in diameter and assuming a thermal model described by the cool component as determined by the ASCA observations). The intrinsic X-ray flux is ergs s-1 cm-2, for cm-2. The H to X-ray flux ratio for the bubble in NGC6240 is therefore 1.2, in good agreement with the ratios determined for different regions of the galactic wind in NGC253, which are generally within a factor 2 of unity (Strickland et al. 2001).
4 The double nuclei
| Nucleus-Model | Observed flux | Unabsorbed flux |
|---|---|---|
| ergs s-1 cm-2 | ergs s-1 cm-2 | |
| North-thermal | ||
| South-thermal | ||
| North-power-law | ||
| South-power-law |
From the registration of the H image with the HST data obtained using the F814W filter ( I band), which is less affected by reddening and allows for a better determination of the region morphology, we have identified the galaxy nuclei as the brightest knots of emission in the H image. The northern nucleus is clearly resolved, with a FWHM ( pc). The southern nucleus is resolved into two knots of H emission apart. Obscuration of an extended source is probably responsible for the observed morphology in the southern nucleus, as supported by images obtained at longer wavelengths (Gerssen et al. 2002).
Radio maps show two bright and unresolved sources (FWHM or 70 pc) coincident to within errors with the position of the optical nuclei, and which account for about half of the radio power emitted by the central region of NGC6240 (Colbert et al. 1994). The highest resolution radio observations at cm and obtained with a beam size of imply a distance of ( 1070 pc) between the two nuclear peaks (Carral et al. 1990). This resolution is well matched by archival NICMOS observations of NGC6240 (Scoville et al. 2000), which have a FWHM for a point source of 0.1″-0.2″. Both nuclei appear resolved in these images, with FWHMs ( pc). From the F160W ( H band) and F222M ( K band) images ( and 2.22 m, respectively) we find a nuclear separation of ( 1280 pc).
The X-ray image does not have sufficient signal to noise to allow an accurate determination of the flux-centroids or the analysis of the spatial profile of the nuclei. In fact, only by registering the X-ray and H images it is possible to determine the position of the X-ray nuclei. The northern nucleus is marginally resolved, with 10 counts observed within a diameter of (the instrument PSF FWHM is ) and without showing an obvious peak of emission in the raw data. The southern nucleus is extended in the north-south direction and presents a complex morphology without a clear peak but instead showing several knots of emission. Adopting an aperture of in diameter, 46 counts are detected. Background contribution is negligible within the nuclear apertures. If the X-ray and the H images are aligned using the position of the northern nucleus (as shown in Figure 2), then the H emission from the southern nucleus seems to be slightly displaced towards the north of the X-ray emitting region, possibly due to absorption effects.
To convert the observed count rates to fluxes we must assume a spectral shape for the sources. The nuclear emission could be due to star forming activity in the innermost and most obscured part of the starburst. In this case the emission is probably best described by the spectral parameters of the warm and highly absorbed thermal component as determined from the ASCA analysis (IC98). Alternatively, the nuclei could be dominated by the AGN reflection component, which is characterised by a hard power-law with below keV and above keV and by an absorbing column of cm-2 (IC98). The observed and corrected fluxes for the nuclei under these two scenarios are presented in Table 1. Note that the value for derived by IC98 might not reflect actual physical conditions, as it depends entirely on the chosen spectral shape. The dusty enviroment in the nuclear region of NGC6240, on the other hand, suggests that some of this obscuration could be real. Also, note that this column density is affecting scattered light from the AGN, while the the active nucleus is obscured behind a gas column of at least cm-2.
The presence a Compton-thick AGN in NGC6240 has been determined from ASCA and BeppoSAX observations (IC98, Vignati et al. 1999). Assuming the spectral shape and flux observed by ASCA, about 85 counts are predicted from the power-law scattered component in our HRC observation. This number of counts suggests that the southern nucleus, with 46 detected counts, is a better candidate for the counterpart of the scattered emission. This would also be supported by HST narrow-band observations which show that the brightest optical peak in the southern nucleus has emission line ratios compatible with the presence of a high excitation region (Rafanelli et al. 1997). The discrepancy between the predicted counts and the observed numclear values couls also be due to contamination with the large ASCA PSF. The starburst could make a significant contribution to the power law component if there was an unresolved component of accreting binaries, for example. But note that the predicted HRC number of counts is very sensitive to the assumed slope of the power-law component and its change in value from the hard to the soft band.
A compact reflector in the southern nucleus could be associated with the dust in a molecular torus lying as close as a few parsecs from the central source. A large scale reflector could be associated with the electrons in the NLR, a region hundreds of parsecs across. The size of the X-ray region associated with the southern nucleus is not well defined by our observations, but a reflector as large as a few thousand parsec across is plausible. Recent Chandra observations of the prototypical Seyfert 2 galaxy NGC1068 show hard emission arising from a region kpc in size (Young et al. 2001). Young et al. pointed out that results from XMM-Newton RGS observations suggest that the gas is mainly photo-ionised, implying that its density would be too low to provide the required scattering efficiency. It is also possible, however, that some dense thermal gas is present, which may be responsible for the observed hard continuum. So the scattering scenario remains plaussible.
5 AGN vs starburst activity
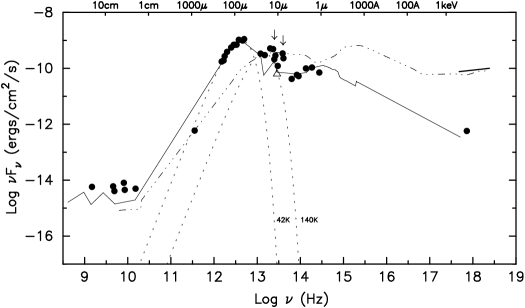
In Figure 3 we show the observed large aperture radio, IR and X-ray emission of NGC6240 in order to investigate its spectral energy distribution (SED). We compare these data with the typical spectral energy distributions of QSOs and starburst galaxies taken from Elvis et al. (1995) and Schmidt et al. (1997). The starburst distribution has been normalized to match the observed far-IR emission, while the QSO distribution has been scaled to match the inferred 2-10 keV AGN emission. The 10-200 m continuum can be represented by two modified blackbody components with emissivity with temperatures of 42 and 140 Kelvin degrees (see Klass et al. 1997 for details), corresponding to luminosities ergs s-1 and ergs s-1, respectively (for Mpc). The cold component is believed to originate from the heating of dust by OB stars in star forming regions, while the warmer component is interpreted as emission from the reprocessing of hard photons by dust associated with the molecular torus located near to the active nucleus (Klass et al. 1997).
Fig 3 shows that the starburst SED is in very good agreement with the data at most wavelengths, suggesting that the starburst component dominates most of the observed emission. The departure of the SCUBA data point at m from the model SED is not significant as Schmidt et al. simply draw a straight line to join the radio with the far-IR 100 m for the average SED of their starburst sample. The excess emission at radio wavelengths is within the large intrinsic spread found at radio frequencies for the galaxies in the Schmidt’s sample, and also possibly contains some contribution from the AGN, as already noted by (Colbert et al. 1994) (see also Iwasawa et al. 2001). For example, the unresolved radio nuclei contribute of the total 3.6 cm flux (Colbert et al. 1994).
A significant excess over the starburst SED is seen around the position of the 140 K bump, consistent with the idea that this component is related to the AGN and not to the star-forming activity. Some contribution from the nuclear starburst, however, is likely. PHA emission features are readily visible at wavelengths m (see arrows in Fig 3; also see Fig 1 in Klaas et al. 1997 for a more detailed plot of the ISO data). Also, N-band (10.5 m) imaging shows that the unresolved nuclear flux (shown as a triangle) corresponds only to 50% of the flux measured by ISO (Krabbe et al. 2001).
In agreement with our SED, detailed observations suggest that the AGN is completely absorbed in the near-IR, optical and soft X-ray bands (ie, in the m - 10 keV range; Tecza et al. 2000, Veilleux et al. 1995, IC98), resulting in an observed pure starburst SED at these wavelengths. If the absorbed AGN continuum emission is reprocessed and emerges as the observed warm 140 K bump, the component should be of the same order as the amount of energy removed by dust absorption at wavelengths shorter than m. We can test this hypothesis by integrating the QSO SED, as shown in Fig 3, for wavelengths shorter than 1 m and then comparing this value with that derived for . For Å, however, UV photons are also absorbed by photoelectric processes. It is estimated that about 2/3 of the ionizing continuum is absorbed by dust, either directly or as reemited Ly photons (Calzetti et al. 2000). We find that the amount of AGN continuum removed from the QSO SED corresponds to ergs s-1, which is 4 times larger than the luminosity of the 140 K component.
This discrepancy between and the absorbed AGN continuum may be even larger if, as suggested by the nuclear N-band 10.5 m measurements, the large ISO apertures include some significant amount of emission from the starburst, implying an overestimation of the emission from the nuclear region. On the other hand, the assumption that the average QSO SED is a good representation of the intrinsic AGN continuum distribution in NGC6240 is also highly uncertain. In fact, the nuclear N-band measurements also imply that the AGN component is about an order of magnitude underluminous at 10 m if the extrapolated 2-10 keV X-ray emission (see caption to Fig 3) is used for the normalization of the QSO SED. This was already noted by Krabbe et al. (2001), who speculated that a higher extinction could be responsible for the faint N-band flux. Finally, some of the discrepancy between and the amount of removed AGN continuum could be explained by the intrinsic properties of the AGN. Some torus models predict a strong anisotropy of the reprocessed emission, with tori viewed edge-on being much fainter than tori observed pole-on, as most of the emission is radiated from the inner face and the top and bottom surfaces of the torus (Pier & Krolik, 1992). This idea is supported by recent results from an IR study of the CfA Seyfert Sample which show clear evidence for non-isotropic emission (Perez Garcia & Rodriguez Espinosa, 2001). It is found that the ratio of the warm, torus-related component, to the total IR flux is for Seyfert 1 galaxies and for Seyfert 2 galaxies. NGC6240 has a ratio of only 0.24 (Klaas et al. 1997), in agreement with a nearly edge-on orientation of the dusty torus and a significant underestimation of the intrinsic luminosity of the 140 K bump.
If our interpretation of the IR emission is correct, the luminosity of the 42 K component should arise from the dust associated with the starburst. Tecza et al. (2000) have determined that the starburst in NGC6240 can be characterised by an age of Myr and a burst duration Myr. Using these parameters they predict a ratio of bolometric to K-band luminosity (which has a negligible contribution from the AGN) of , and infer a bolometric luminosity for the starburst of ergs s-1 (for Mpc). Since very little stellar emission is produced for wavelengths longer than m, this bolometric emission can be directly compared with the observed reddened continuum at m, and the difference should correspond to the amount of stellar energy absorbed by dust and reemited in the 42 K bump. Using the Schmidt SED in Fig 3 as the template for the reddened spectral distribution (parametirised as for m) we find that the integration under the curve gives an observed luminosity of erg s-1, assuming, as above, that 2/3 of the ionizing continuum (Å) is absorbed by dust. Therefore, erg s-1 of energy has been removed from the intrinsic starburst emission and is then reemited in the IR. Given all the uncertainties involved, this value compares well with .
This simple analysis of the SED of NGC6240 suggests that the starburst and AGN components are extremely powerful, both components having ergs s-1. Even if the bolometric luminosity of the active nucleus, inferred from the X-ray observations, has been overestimated, its luminosity is probably within a factor of a few of that of the starburst. NGC6240 contains, therefore, a clear example of an active nucleus that plays a significant role in the energetics of an infrared ultraluminous galaxy, but which eludes detection at most wavelengths.
References
- [] Calzetti D., Armus L., Bohlin R.C., Kinney A.L., Koornneef J. & Storchi-Bergmann T., 2000, ApJ 533 682
- [] Carral P, Turner J.L. & Ho P.T.P., 1990, ApJ 362 434
- [] Cecil G., Bland-Hawthorn J., Veilleux S. & Filippenko A.V., 2001, ApJ 555 338
- [] Colbert E.J.M., Wilson A.S. & Bland-Hawthorn J., 1994, ApJ 436 89
- [] Elvis M. et al., 1994, ApJSS, 95 1
- [] Genzel R. et al., 1998, ApJ, 498, 579
- [] Gerssen J. et al., in ”The central kpc of starbursts and AGN: the La Palma connection”, Eds. Knapen J.H. et al., ASP conf. series, 2002, in press
- [] Heckman T.M., Armus L. & Miley G.K., 1990, ApJSS, 74, 833
- [] Heckman T.M., Armus L., Weaver K.A. & Wang J., 1999, ApJ, 517, 130
- [] Iwasawa K. & Comastri A., 1998, MNRAS 297 1219 (IC98)
- [] Iwasawa K., Matt G., Guainazzi M. & Fabian A.C.,2001 MNRAS 326 894
- [] Klaas U., Haas M., Heinrichsen, I. & Schulz B., 1997, A&A 325 L21
- [] Komossa S., Schulz H. & Greiner J., 1998, A&A 334 110
- [] Krabbe A., Böker T. & Maiolino R., 2001, ApJ 557 626
- [] Leitherer C. et al., 1999, ApJS 123 3
- [] Lira P., Ward M., Zezas A., Alonso-Herrero A. & Ueno S., 2002, MNRAS, in press
- [] Lisenfeld U., Isaak K.G. & Hills R., 2000, MNRAS 312 433
- [] Murray S.S. et al, 1997, Proc. SPIE 3114 11
- [] Pier E.A. & Krolik J.H., 1992, ApJ 401 99
- [] Pietsch W., Vogler A., Klein U. & Zinnecker H., 2000, A&A, 360, 24
- [] Pérez García, A. & Rodríguez Espinosa J., 2001, ApJ 557 39
- [] Rafanelli P., Schulz H., Barbieri C., Komossa S., Mebold U., Baruffolo A. & Radovich M., 1997, A&A 327 901
- [] Schmitt H.R., Kinney A.L., Calzetti D. & Storchi Bergmann T., 1997, AJ, 114 592
- [] Scoville N.Z. et al., 2000, AJ 119 991
- [] Strickland D., Ponman T. & Stevens I., 1997, A&A, 320, 378
- [] Strickland D., Heckman T.M., Weaver K.A., Hoopes C.G. & Dahlem M., 2001, ApJ in press
- [] Tecza M., Genzel R., Tacconi L.J., Anders S., Tacconi-Garman L.E. & Thatte N., 2000, ApJ, 537, 178
- [] Veilleux S., Kim D.-C., Sanders D.B., Mazzarella J.M. & Soifer B.T, 1995, ApJS, 98, 171
- [] Vignati P. et al., 1999, A&A 349 L57
- [] Young A.J., Wilson A.S. & Shopbell P.L., 2001, ApJ 556 6