Chandra and ASCA Observations of the X-ray-brightest T-Tauri Stars in the Ophiuchi Cloud
Abstract
We present the Chandra ACIS and ASCA GIS results for a series of four long-term observations on DoAr 21, ROXs 21 and ROXs 31; the X-ray brightest T-Tauri stars (TTSs) in the Ophiuchi cloud. In the four observations with a net exposure of 600 ksec, we found six, three and two flares from DoAr 21, ROXs 21 and ROXs 31, respectively; hence the flare rate is fairly high. The spectra of DoAr 21 are well fitted with a single-temperature plasma model, while those of ROXs 21 and ROXs 31 need an additional soft plasma component. Since DoAr 21 is younger (105 yr) than ROXs 21 and ROXs 31 (106 yr), these results may indicate that the soft component gradually increases as T-Tauri stars age. The abundances are generally sub-solar and vary from element to element. Both high-FIP (first ionization potential) and low-FIP elements show enhancement over the mean abundances. An unusual giant flare is detected from ROXs 31. The peak luminosity and temperature are 1033 ergs s-1 and 10 keV, respectively. The temperature reaches its peak value before the flux maximum, and is nearly constant (4–5 keV) during the decay phase, indicating successive energy release during the flare. The abundances and absorption show dramatic variability from the quiescent to flare phase.
1 INTRODUCTION
Low-mass stars in the pre-main sequence (PMS) stage are classified into four types based on their infrared (IR) to sub-mm spectral energy distributions (SEDs); molecular cloud cores through protostars are represented by class 0 and I SEDs, while classical and weak-line T-Tauri stars (CTTSs and WTTSs) exhibit class II and III SEDs (Shu, Adams, & Lizano, 1987; André & Montmerle, 1994).
The Einstein satellite first revealed that T-Tauri stars (TTSs = CTTSs and WTTSs) emit intense and time variable X-rays with occasional rapid flares (Feigelson & DeCampli, 1981; Montmerle et al., 1983). These properties are consistent with a scenario of enhanced solar-type activity, attributable to magnetic dynamo processes. Successive X-ray satellites such as ROSAT, ASCA, and Chandra have detected X-ray emission from many PMS stars, even from the youngest class 0 stage (Tsuboi et al., 2001), and suggest that X-ray emission from low-mass PMS stars is caused by magnetic activity. These results, however, rely mainly on short duration observations; neither long-term nor detailed behavior of the X-ray spectrum and timing has been well studied. This paper hence addresses three topics on TTSs; (1) the duty ratio of the X-ray flare, (2) the long-term plasma structure and variability, and (3) the chemical compositions in the quiescent and flare phases.
(1) Stelzer, Neuhäuser, & Hambaryan (2000) compiled ROSAT PSPC observations of the Taurus-Auriga-Perseus region and found that the flare rate may depend on the stellar age, rotation period, and/or multiplicity; stars with younger ages, shorter rotation periods, and located in binary systems tend to show more frequent flares. Hence, the flare rate may help to reveal the physical conditions of PMS stars.
(2) Preibisch (1997) fitted the ROSAT PSPC spectra of 60 PMS stars with several thermal plasma models and found that multi-temperature components are needed for most of the spectra. Tsujimoto et al. (2001) also reported that about two-thirds of the Chandra spectra of TTSs in the Orion molecular cloud tend to be well fitted by multi-temperature plasma models as compared with single temperature plasma models for younger objects (protostars). The multi-temperature structure may also depend on the activity phase of each star; higher temperature plasma becomes dominant in a flare compared with a quiescent phase. Thus long-term monitoring of both flare and quiescent phases is crucial for the study of the origin and structure of the multi-temperature plasma.
(3) ASCA found that the mean chemical composition of X-ray-emitting plasma in young stellar objects (YSOs) is generally sub-solar and varies from star to star (Kamata et al., 1997; Ozawa, 2000). These results may be misleading, however, because the mean-abundance determination is biased toward elements with strong emission lines in the relevant energy range and largely depends on the plasma temperature. Moreover, the abundances of the stellar corona may be different from those in the photosphere, depending on the first ionization potential (FIP) of the relevant elements. For instance, in a solar corona, elements with low FIP are overabundant relative to the solar photospheric values (“the FIP effect”, Feldman 1992). In some of the stellar coronae, however, the abundances of high-FIP elements are larger than the others (the Inverse FIP = IFIP effect). The IFIP effect appears in X-ray active stars, while the FIP effect is generally seen in less active stars (Audard, Güdel, & Mewe, 2001; Brinkman et al., 2001; Güdel et al., 2001a, b, c; Huenemoerder, Canizares, & Schulz, 2001; Kastner et al., 2001). The dependence of abundance on the X-ray activity is also found within individual stars; the enhancements in abundance are seen from quiescent to flare phases, or even within a single flare phase (e.g. HR1099, Audard et al. 2001; V773 Tau, Tsuboi et al. 1998). Due to the limited statistics and samples, however, it is unclear whether or not abundance variations between quiescent and flare phases are common, and whether or not FIP/IFIP effects are present in low-mass YSOs.
To investigate the above-mentioned subjects, we selected the three X-ray brightest TTSs; DoAr 21 (ROXs 8), ROXs 21 and ROXs 31 in the Ophiuchi cloud ( Oph) located at a distance of 145 pc (de Zeeuw et al., 1999), because all three have publicly available long-term observations with Chandra and ASCA. These TTSs were first recognized as bright X-ray sources with Einstein (Montmerle et al., 1983), and were identified with optical K–M stars having weak H emission (Bouvier & Appenzeller, 1992), hence classified as WTTS (class III). Simon et al. (1995) observed the lunar occultation of these WTTSs at infrared wavelengths and found that ROXs 21 and ROXs 31 are binary systems with separation angles of 03 and 048, respectively. The rotational period of ROXs 21 is reported to be 1.39 days (Shevchenko & Herbst, 1998). Since no continuum emission is found at 1.3 mm (André & Montmerle, 1994), the circumstellar envelope of these TTSs is thought to have already disappeared, while DoAr 21 may still have an accretion disk, as suggested by the detection of near-infrared (NIR) polarized emission (Ageorges et al., 1997). Using the theoretical evolutionary tracks in the H-R diagram, the age of DoAr 21 is estimated to be 105 yr, which is younger than that of ROXs 21 and ROXs 31 (106 yr) (Nürnberger et al., 1998). Finally, DoAr 21 and ROXs 31 show variable radio emission, which is probably due to the gyro-synchrotron emission induced by the surface magnetic field (Stine et al., 1988).
Early results with the Chandra and ASCA observations (Koyama et al., 1994; Kamata et al., 1997; Tsuboi, 1999; Tsuboi et al., 2000; Skinner, 2000; Imanishi et al., 2001) revealed that these particular TTSs have luminosities of 1030 ergs s-1 and relatively low absorption ( 1022 cm-2). Thus they can provide enough counts to measure their temporal and spectral properties in great detail.
2 OBSERVATIONS AND DATA REDUCTION
The Chandra (Weisskopf, O’dell, & van Speybroeck, 1996) observation (hereafter, obs C1) of these TTSs was made with five front-illuminated X-ray CCDs, ACIS-I0, I1, I2, I3, and S2, in the 0.2–10 keV band. The level 2 data were retrieved from the Chandra X-ray Center (CXC) archive. X-ray events are selected using the ASCA grades 0, 2, 3, 4, and 6. An effective exposure time of 100 ks is obtained (Table 1). Another long exposure observation of the Oph core A, which contains DoAr 21 in the ACIS-I3, is also in the archive (obs C2), but this data suffer from the photon pile-up and therefore were not used.
Three observations (obs A1, A2, and A3) were carried out with the two Gas Imaging Spectrometers (GISs) (Ohashi et al., 1996) and the two Solid-state Imaging Spectrometers (SISs) (Burke et al., 1991) onboard ASCA (Tanaka, Inoue, & Holt, 1994), at the foci of the X-ray telescopes (XRTs) (Serlemitsos et al., 1995) sensitive to photons in 0.4–10 keV. However, the TTS sources were located outside of, or at the edge of the SIS’s field of view in the majority of the observations; therefore we do not use the SIS data. We retrieved the ASCA unscreened data from the HEASARC Online Service. Data taken at a geomagnetic cutoff rigidity lower than 4 GV, at an elevation angle less than 5∘ from the Earth, and during passage through the South Atlantic Anomaly were filtered out. Particle events were also removed using the rise-time discrimination method. The total available exposure times were 38 ks (obs A1), 93 ks (A2), and 75 ks (A3) (Table 1).
3 ANALYSIS AND RESULTS
3.1 Extraction of Source and Background Photons
The positions of NIR counterparts (Barsony et al., 1997) were used to fine-tune the Chandra coordinates. We then extracted the source photons using an ellipse with major and minor axes of 600 and 350, respectively, for DoAr 21, and from respective circles of 117 and 120 radius for ROXs 21 and ROXs31, with the regions centered at the NIR positions (Barsony et al., 1997). The relatively large source areas are due to large off-axis point spread functions (PSFs); DoAr 21 lies in ACIS-S2 20′ away from the optical axis, while ROXs 21 and ROXs 31 are at the edge of ACIS-I1 with off-axis angles of 7–10′. The large off-axis angle (and hence large PSF) for the brightest source DoAr21 mitigates photon pile-up, which in fact is a problem for the obs C2 case. The background region for DoAr 21 was taken from a source-free 19 arcmin2 region on ACIS-S2, while that for ROXs 21 and ROXs 31 was taken from a 63 arcmin2 region on the ACIS-I array. For the ASCA GIS data (obs A1–A3) the source photons were extracted from 3′ radii circles. The background regions were also taken using 3′ radii circles from nearby source-free regions.
3.2 Time Variability
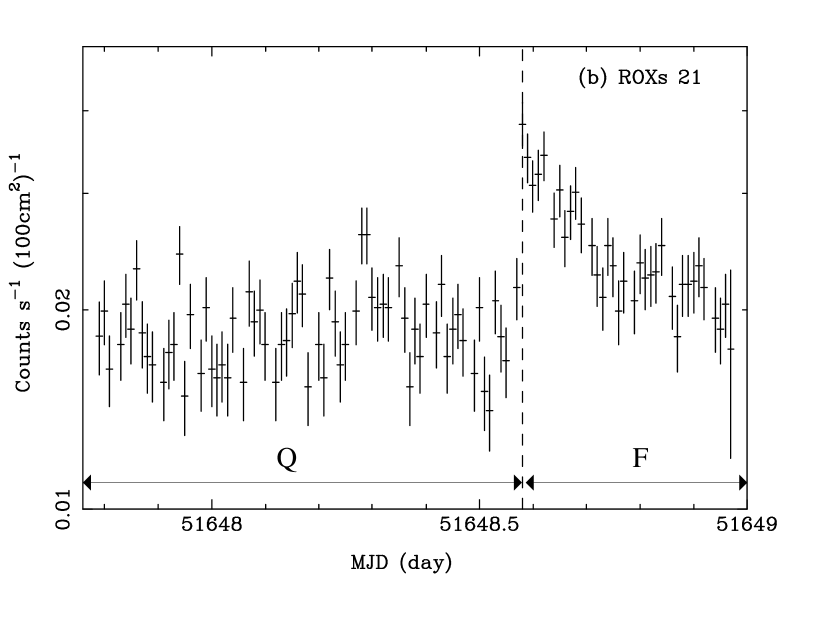
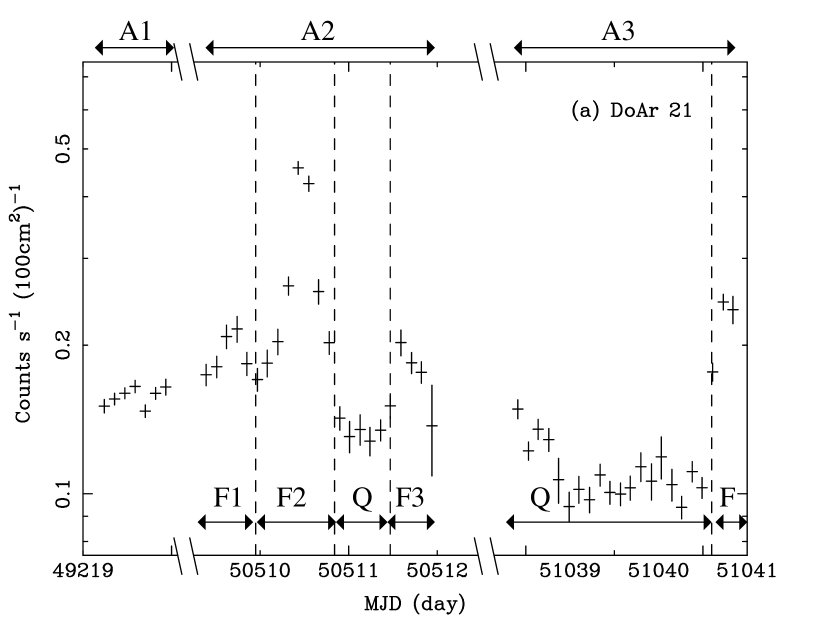
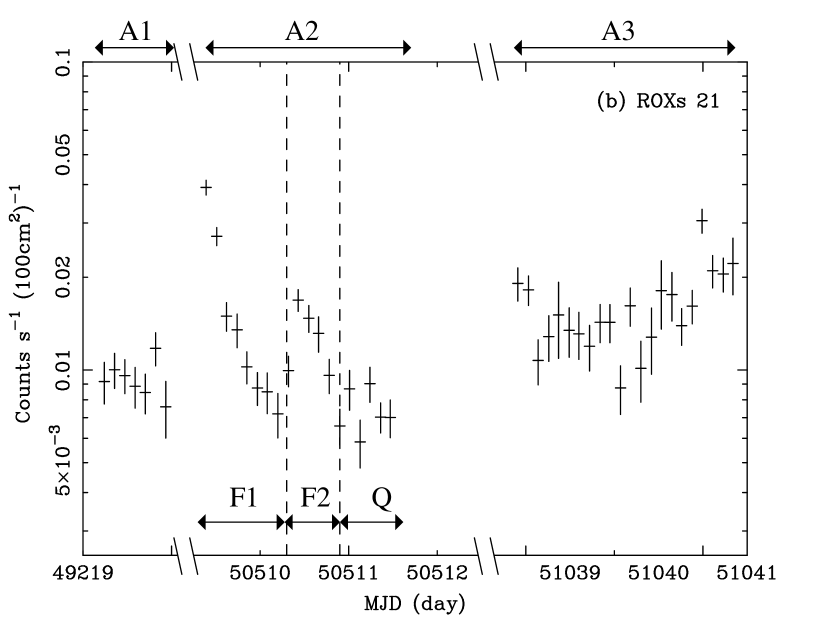
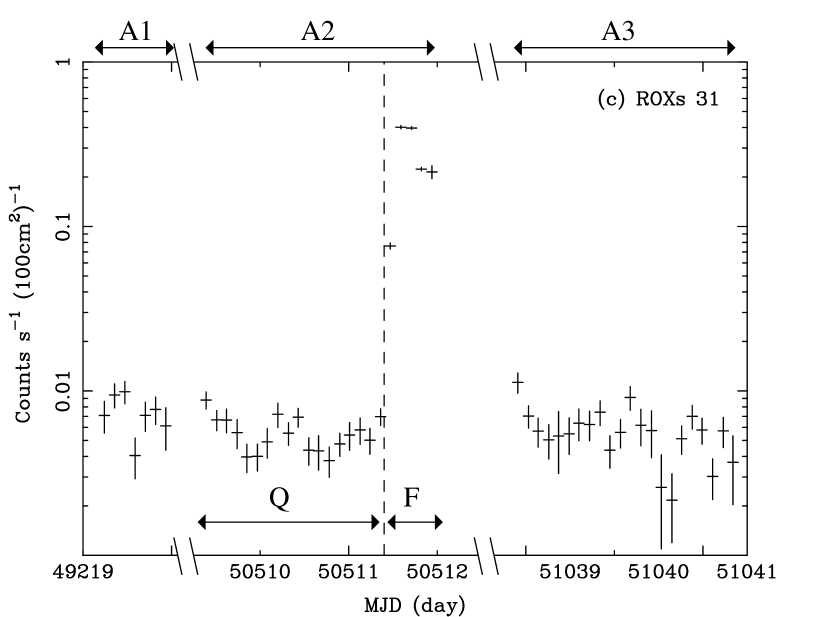
Figure 1 and 2 show the X-ray light curves (no background subtraction) of (a) DoAr 21, (b) ROXs 21, and (c) ROXs 31 obtained with the Chandra ACIS (obs C1) and the ASCA GIS (obs A1–A3), respectively. The photon counts are normalized by the effective area at 1 keV, for comparison with the different instruments and observation epochs. The time bins of each data point are 103 s and 104 s for ACIS (Figure 1) and GIS (Figure 2), respectively. The energy band of the ACIS and GIS data for DoAr 21 are taken to be 0.5–9.0 keV. However, the GIS light curves for ROXs 21 and ROXs 31 are limited in the soft energy band of 0.5–1.5 keV in order to avoid possible contamination from a nearby variable hard X-ray source, YLW 15A (Tsuboi, 1999; Tsuboi et al., 2000; Imanishi et al., 2001). To verify the energy band, we extracted the ACIS-I spectrum of YLW 15A and fit it with an absorbed thin thermal plasma model. We find a best-fitted absorption of = 4.41022 cm-2 (Imanishi et al., 2001), which reduces the X-ray emission below 1.5 keV to less than 3% of the 1.5–9 keV flux. Hence possible contamination from YLW 15 A to the GIS source circles of ROXs 21 and ROXs 31 is insignificant in the 0.5–1.5 keV band. No data is shown in the ROXs 21 light curve (Figure 2b) from MJD = 50511.55–50512.20 due to significant contamination from an exceptionally giant flare of ROXs 31 (see Figure 2c).
For a unified study, we conventionally define a flare using the following criterion: at least two consecutive time bins must have larger fluxes than the quiescent bin by -level, where the quiescent bin is the minimum time bin in each observation. Under this criterion, we detect six, three, and two flares from DoAr 21, ROXs 21 and ROXs 31, respectively. These are labelled as “F”, “F1”, “F2”, and “F3” with arrows in Figure 1 and 2, while the quiescent phases are indicated by “Q”. An extremely large flare with the maximum flux of 100 times higher than the quiescent level is detected from ROXs 31 (Figure 2c) and is separately treated in §3.4.
3.3 X-ray Spectra
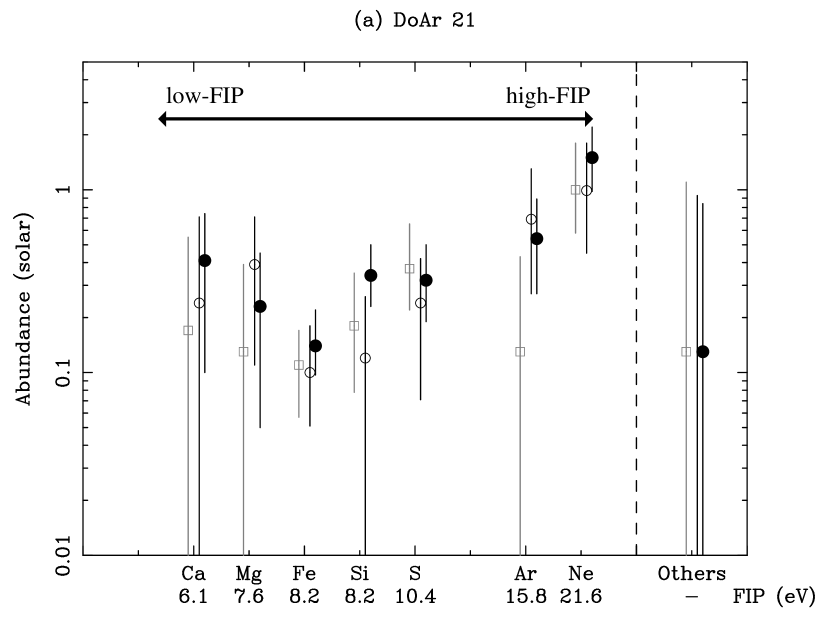
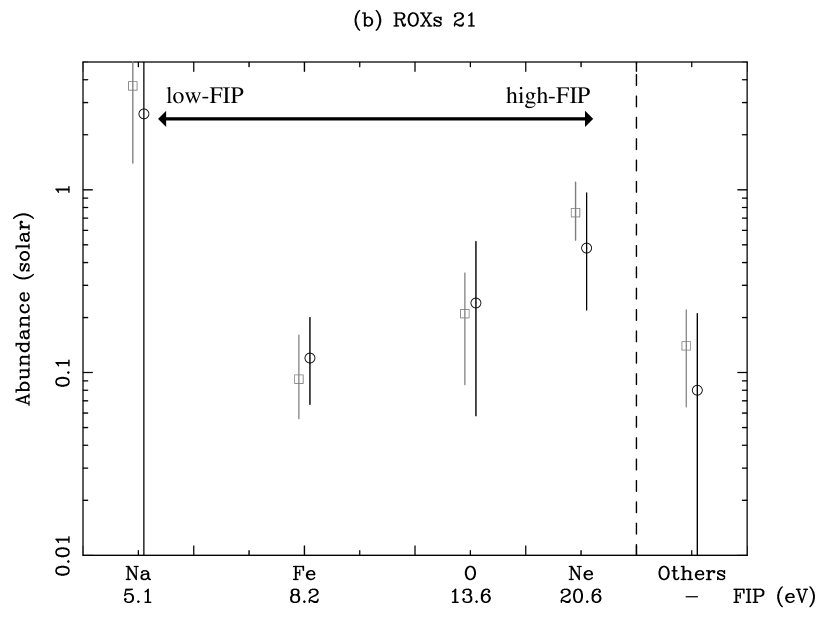
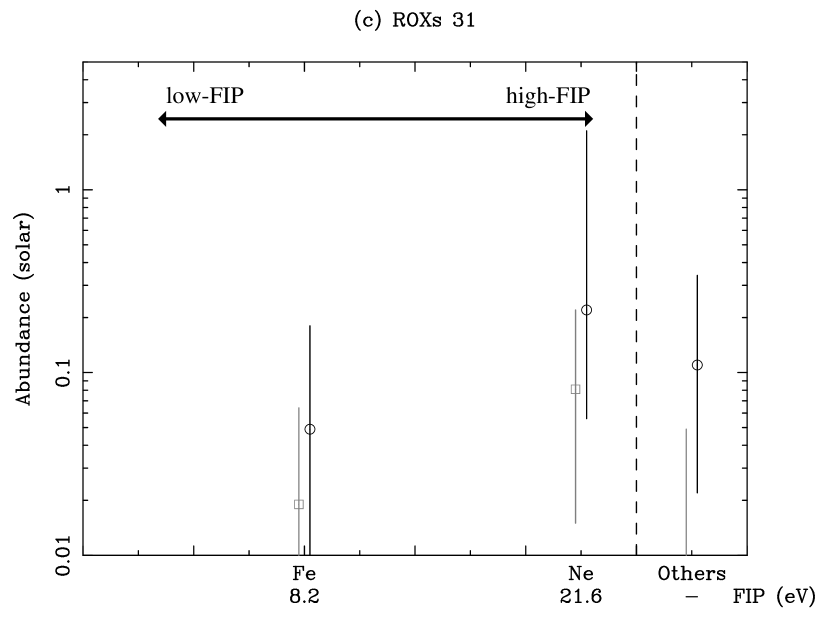
The background-subtracted ACIS spectra of each source using all the data of obs C1 are shown in Figure 3. Several emission lines from highly ionized elements such as O, Ne, Na, Mg, Si, S, Ar, Ca, and Fe are seen, hence the spectra are characteristic of a thin thermal plasma. We therefore fit the spectra with a thin thermal plasma model allowing the abundance of each element with prominent lines (indicated by arrows in Figure 3) to be free. For the study of time variation of the spectra, we separately fit the flare and quiescent spectra as shown in Figure 1. A single-temperature (1-T) thin-thermal plasma model (Mewe et al. 1985) is not acceptable for all the spectra except DoAr 21 and the flare phase of ROXs 31. We therefore fit two-temperature (2-T) plasma models for ROXs 21 and ROXs 31 and find acceptable fits. Table 2 shows the best-fit parameters. All the elemental abundances are below the solar photospheric values (Anders & Grevesse, 1989) except for Ne in DoAr 21 and Na in ROXs 21. The best-fit abundances are displayed in Figure 4 with the order of the FIP.
We investigate the Na overabundance seen in ROXs 21 in further detail, because Na is a relatively rare element compared with the major 4N nuclei and the Na Lyman- line lies near the Lyman- line of the more abundant element Ne. Figure 5a shows the best-fit result when the Na abundance is correctively varied with the “other” elements. A significant data excess is found at 1.2 keV, near the Lyman- line of Ne (1.211 keV). The intensity ratio of Lyman- to - lines of Ne should increase with increasing plasma temperature, but stay almost constant at 7 for plasma temperatures higher than 1 keV (Mewe et al. 1985). Therefore 1/7 of the Lyman- flux should be an upper-limit to the Lyman- line flux. Since the flux of the Ne Lyman- line is fairly strong, the Lyman- line flux is well constrained as seen in Fig 5a. Thus the excess flux should originate from another element; the Lyman- line of Na (1.236 keV) is the best candidate. Allowing the Na abundance to be a free parameter improved the fit as demonstrated in Figure 5b. The reduction of () from 114 (97) to 108 (96) is significant with 98 % confidence level for the -test (Bevington & Robinson, 1992).
Using the GIS spectra of DoAr 21, we investigate the long-term (yr) behavior of the spectral parameters. Since the energy resolution does not allow us to separate the emission lines from the key elements, we correctively varied the abundances. The best-fit luminosity shows long-term variability in the range erg s-1. The best-fit temperatures and abundances also vary from 2.5 to 4 keV and 0.15 to 0.5 solar, respectively; both are possibly correlated to the X-ray luminosity as are shown in Figure 6a and 6b. The value is consistent with being constant, although weak variability within a factor 2 cannot be rejected. We note that although the 1-T model in the medium resolution X-ray spectra may lead to an error in abundance by a factor 2 (Reale, Peres, & Orlando, 2001), such an effect is significantly reduced with 2-T or multi-T models. Since we used 2-T models for 2 out of the 3 sources, the artificial abundance uncertainty should be better constrained.
3.4 Giant Flare from ROXs 31
For the study of the spectral evolution during the flare, we make and fit time-sliced GIS spectra of the giant flare from ROXs 31 in obs A2 (Figure 2c). The time intervals are shown in Figure 7 (left). The spectra show strong K emission of He-like Fe at 6.7 keV, hence we let the Fe abundance vary. The flare spectra are well fitted with a 1-T model. The best-fit parameters for each time interval are shown in Figure 7 (right). As shown in the figure, this flare has an unusual time profile. The light curve increases slowly over 15 ks (see also Skinner 2000). The temperature reaches its peak value before the flux maximum, and stays nearly constant during the decay phase.
The absorption () and abundances dramatically change from quiescent to flare; in the flare is 7.11021 cm-2, 2 times smaller than that of the quiescent phase (obs C1) of 1.71022 cm-2, and the abundances increase by a factor of 3–30 from quiescent (Z = 0.01–0.1 Z⊙) to the giant flare (0.26–0.29). These parameters, however, do not change during the flare.
4 DISCUSSION
4.1 Flare Rate
We have detected six (DoAr 21), three (ROXs 21) and two (ROXs 31) flares under our flare criterion (see §3.2). The total exposure time of the four observations is 7 days, hence the flare rate is one per 1.2, 2.3, and 3.5 days for DoAr 21, ROXs 21 and ROXs 31, respectively. We also confirmed the high flare rate of DoAr 21 in obs C2, although the data suffer from photon pile-up. Two possibilities could account for the higher rate in DoAr 21: differences of the energy band (DoAr 21: 0.5–9.0 keV, versus ROXs 21 and ROXs 31: 0.5–1.5 keV in obs A1–A3) and the mean count rate (DoAr 21: 0.4 counts s-1, versus ROXs 21 and ROXs 31: 0.04–0.09 counts s-1 in obs C1). In fact, limiting the GIS data of DoAr 21 to 0.5–1.5 keV reduces the number of flares (under our criterion) to two (F2 in obs A2 and F in obs A3), similar in number to those of ROXs 21 and ROXs 31. Also, the higher count rate of DoAr 21 results in a higher sensitivity to smaller amplitude flares that can be detected under our criterion (§3.2). Indeed, both flares in Figure 1a have smaller amplitudes than those in Figure 1b and c. Conversely, at similar sensitivities, the flare rate of ROXs 21 and ROXs 31 may be comparable to that of DoAr 21, in spite of different ages (DoAr 21, 105 yr; ROXs 21 and ROXs 31, 106 yr) and different structure (ROXs 21 and ROXs 31 are binaries, while DoAr 21 may be a single star).
The typical flare rate of X-ray sources in the Taurus-Auriga-Perseus region (Stelzer et al. 2000) is 1/(4–5) days (assuming a typical decay time scale of 1 hour). Therefore we predict significantly higher flare rates than that reported previously. The higher duty ratio may be primarily due to the extended sensitivity in the hard X-ray band (1.5 keV) and their brightness, because the flare activity (flux increase) is clearer in the harder X-ray band and/or for brighter sources as we have already demonstrated for DoAr 21 in the previous paragraph and in Figure 6a.
4.2 Interpretation of the Temperature Structure
The high-quality spectra of the long Chandra ACIS exposure reveal that the 2-T models gives a better fit for overall spectra than the 1-T models for ROXs 21 and ROXs 31. This supports previous 2-T model fits for some fraction of other bright TTSs (Carkner et al., 1996; Preibisch, 1997; Costa et al., 2000; Ozawa, 2000; Tsujimoto et al., 2001). DoAr 21, on the other hand, displays a simple 1-T spectrum with 3 keV; hence it has no additional soft component. Since the age of DoAr 21 (105 yr) is younger than that of ROXs 21 and ROXs 31 (106 yr) (Nürnberger et al., 1998), coupled with the result of Tsujimoto et al. (2001) that 2-T spectra are found more often in older TTSs than in younger protostars, we speculate that the soft component, probably a relatively steady corona, is generated gradually as the system increases in age, finally reaching solar-like corona. In this scenario, the hard component would be the sum of unresolved flares.
4.3 Chemical Composition of the X-ray-emitting Plasma
The coronal abundances of the TTSs are sub-solar, consistent with the previous results. From Figure 4, we see that both high-FIP (Ne and Ar) and low-FIP (Na, Mg and Ca) elements show higher abundances than the other elements (the IFIP and FIP effects).
For the abundances in solar corona, the FIP-effect appears in elements with FIPs below 10 eV; these elements are collisionally ionized in the photosphere at 6000–7000 K temperature, and would be preferentially transferred to the upper coronal region by electric fields (Feldman, 1992). DoAr 21 and ROXs 21 are a K0 star and a binary of K4 with M2.5, respectively, and hence have photospheric temperatures of 4000–5000 K, 0.6–0.8 times that of the solar photosphere (Nürnberger et al., 1998). Therefore the FIP-effect energy-limit of 10 eV should be shifted to 6–8 eV, which is near Mg (FIP = 7.8 eV) and Ca (6.1 eV), but well above Na (5.1 keV). Hence, the abundance enhancements of Mg, Ca and Na provide independent evidence supporting the universality of the FIP-scenario proposed by Feldman (1992).
The X-ray luminosities of our TTS sample are a few ergs s-1, which is significantly higher than typical FIP sources of ergs s-1 (such as the sun, UMa, and Ori; Güdel et al. 2001c). The high luminosity may also be responsible for the IFIP effect we observed. A related issue would be the dramatic abundance increase in the giant flare of ROXs 31.
A scenario for the IFIP effect was proposed by Güdel et al. (2001c). A “downward-pointing” electric field is produced by the high-energy non-thermal electrons during X-ray active phase, and suppresses the transfer of the ionized low-FIP elements into the corona. The electrons also loose their kinetic energy at the photosphere by the collisional process and then heat up the cool elements, making the abundance increase during the flare. The radio gyro-synchrotron emission from DoAr 21 and ROXs 31 further supports this idea, because this is the direct evidence for the presence of the high-energy electrons. Since the abundance increase should be correlated with the non-thermal radio flux variations, simultaneous radio and X-ray observations would help to constrain physical models.
Another possibility is photo-ionization by coronal X-rays. This was proposed to explain a solar flare in which Ne is enhanced relative to O (Shemi, 1991; Schmelz, 1993). The IFIP effect is seen in the X-ray brightest stars with = 1029–1032 ergs s-1 (HR 1099, Brinkman et al. 2001; AB Dor, Güdel et al. 2001a; YY Gem, Güdel et al. 2001b; II Pegasi, Huenemoerder et al. 2001; and TW Hydrae, Kastner et al. 2001), in which large X-ray photo-ionization may occur. The abundances increase in the X-ray flare may also be explained by this scenario.
4.4 Interpretation of the Giant Flare of ROXs 31
The unusual giant flare from ROXs 31 shows 1-T plasma emission, in contrast to the quiescent phase. The flux of the soft component in the quiescent phase is 10–100 times lower than that of the flare flux. Hence it is highly possible that the soft component does exist during the flare but is hidden by the more luminous harder component.
The peak luminosity of 1033 ergs s-1 and temperature of 10 keV are comparable to the giant flare of another TTS binary system V773 Tau (Tsuboi et al., 1998). However, the time profile of the plasma temperature is different from that of V773 Tau; the temperature arrives at the peak value preceding the flare peak, and, in the decay phase, stays nearly constant at 4–5 keV. These imply the existence of successive energy release due to the magnetic reconnection and that the generation and heating of the plasma occur even in the decay phase, as suggested by Tsuboi et al. (1998); Schmitt & Favata (1999); Favata & Schmitt (1999). Such a phenomenon is also seen in long duration event (LDE) flares of the Sun (Isobe et al., 2001).
The abundance and absorption during the giant flare are systematically larger and smaller than those in the quiescent phase (Table 2). This could be due to evaporation of photosphere and environments by high-energy electrons, which may be produced just after magnetic reconnection. Evaporation by the flare X-rays may not be important, because the abundances and absorption do not change much during the flare. Thus, in the case of the IFIP effect in the giant flare of ROXs 31, the high-energy electron origin is more likely than X-ray irradiation scenario.
5 SUMMARY
We analyzed the Chandra and ASCA data of the three X-ray-bright TTSs, DoAr 21, ROXs 21, and ROXs 31. Based on the timing and spectral features, we derived several results as follows;
-
1.
Six flares in the 0.5–9 keV band are detected from DoAr 21 during the total duration of 7 days. Also, three and two flares are detected from ROXs 21 and ROXs 31, respectively, with Chandra in 0.5–9.0 keV and ASCA in 0.5–1.5 keV. Converting to the 0.5-9 keV band sensitivity, the flare numbers become nearly the same as DoAr 21. Thus the flare rate of these TTSs may be extremely high (about one per one day).
-
2.
The spectra of DoAr 21 are well fitted with a 1-T model, while those of ROXs 21 and ROXs 31 need additional soft components. This can be interpreted as a gradual generation of the soft component with the increasing age.
-
3.
We found relative abundance enhancements in both the low-FIP (Na, Mg and Ca) and high-FIP (Ne and Ar) elements.
-
4.
An unusual giant flare is detected from ROXs 31. The temperature remains high (4–5 keV) even during the decay phase, suggesting a successive energy release. A large abundance and absorption jump from quiescent to flare is found, which may suggest a large contribution to gas evaporation from the photosphere and environments by non-thermal electrons.
References
- Ageorges et al. (1997) Ageorges, N., Eckart, A., Monin, J. L., & Ménard, F. 1997, A&A, 326, 632
- Anders & Grevesse (1989) Anders, E., & Grevesse, N. 1989, Geochimica et Cosmochimica Acta, 53, 197
- André & Montmerle (1994) André, P., & Montmerle, T. 1994, ApJ, 420, 837
- Audard, Güdel, & Mewe (2001) Audard, M., Güdel, M., & Mewe, R. 2001, A&A, 365, L318
- Barsony et al. (1997) Barsony, M., Kenyon, S. J., Lada, E. A., & Teuben, P. J., 1997, ApJS, 112, 109
- Bevington & Robinson (1992) Bevington, P. R., & Robinson, D. K. 1992, Data Reduction and Error Analysis for the Physical Science (2d ed.; Boston: WCB/McGraw-Hill)
- Bouvier & Appenzeller (1992) Bouvier, J., & Appenzeller, I. 1992, A&AS, 92, 481
- Brinkman et al. (2001) Brinkman, A. C. et al. 2001, A&A, 365, L324
- Burke et al. (1991) Burke, B. E., Mountain, R. W., Harrison, D. C., Bautz, M. W., Doty, J. P., Ricker, G. R., Daniels, P. J. 1991, IEEE Trans. ED-38, 1069
- Carkner et al. (1996) Carkner, L., Feigelson, E. D., Koyama, K., Montmerle, T., Reid, I. N. 1996, ApJ, 464, 286
- Costa et al. (2000) Costa, V. M., Lago, M. T. V. T., Norci, L., and Neurs, E. J. A. 2000, A&A, 354, 621
- de Zeeuw et al. (1999) de Zeeuw, P. T., Hoogerwerf, R., de Bruijne, J. H. J., Brown, A. G. A., & Blaauw, A. 1999, AJ, 117, 354
- Favata & Schmitt (1999) Favata, F., & Schmitt, J. H. M. M. 1999, A&A, 350, 900
- Feldman (1992) Feldman, U. 1992, Phys. Scr, 46, 202
- Feigelson & DeCampli (1981) Feigelson, E. D., & DeCampli, W. M. 1981, ApJ, 243, L89
- Güdel et al. (2001a) Güdel, M. et al. 2001a, A&A, 365, L336
- Güdel et al. (2001b) Güdel, M., Audard, M., Magee, H., Franciosini, E., Grosso, N., Cordova, F. A., Pallavicini, R., & Mewe, R. 2001b, A&A, 365, L344
- Güdel et al. (2001c) Güdel, M. et al. 2001c, astro-ph/0109267
- Huenemoerder, Canizares, & Schulz (2001) Huenemoerder, D. P., Canizares, C. R., & Schulz, N. S. 2001, ApJ, 559, 1135
- Imanishi et al. (2001) Imanishi, K., Koyama, K., & Tsuboi, Y. 2001, ApJ, 557, 747
- Isobe et al. (2001) Isobe, H., Yokoyama, T., Shimojo, M., Morimoto, T., Kozu, H., Eto, S., Narukage, N., & Shibata, K., 2001, ApJ, in press
- Kamata et al. (1997) Kamata, Y., Koyama, K., Tsuboi, Y., & Yamauchi, S. 1997, PASJ, 49, 461
- Kastner et al. (2001) Kastner, J. H., Huenemoerder, D. P., Schulz, N. S., Canizares, C. R., & Weintraub, D. A. 2001, ApJ, accepted (astro-ph/0111049)
- Koyama et al. (1994) Koyama, K., Maeda, Y., Ozaki, M., Ueno, S., Kamata, Y., Tawara, Y., Skinner, S., & Yamauchi, S. 1994, PASJ, 46, L125
- Mewe, Gronenschild, & van den Oord (1985) Mewe, R., Gronenschild, E. H. B. M., & van den Oord, G. H. J. 1985, A&AS, 62, 197
- Montmerle et al. (1983) Montmerle, T., Koch-Miramond, L., Falgarone, E., & Grindlay, J. E. 1983, ApJ, 269, 182
- Nürnberger et al. (1998) Nürnberger, D., Brandner, W., Yorke, H. W., Zinnecker, H. 1998, A&A, 330, 549
- Ohashi et al. (1996) Ohashi, T. et al. 1996, PASJ, 48, 157
- Ozawa (2000) Ozawa, H. 2000, ph.D. thesis, University of Tokyo
- Preibisch (1997) Preibisch, T. 1997, A&A, 320, 525
- Reale, Peres, & Orlando (2001) Reale, F., Peres, G., & Orlando, S. 2001, ApJ, 557, 906
- Schmelz (1993) Schmelz, J. T. 1993, ApJ, 408, 373
- Schmitt & Favata (1999) Schmitt, J. H. M. M., & Favata, F. 1999, Nature, 401, 44
- Serlemitsos et al. (1995) Serlemitsos, P. J. et al. 1995, PASJ, 47, 105
- Shemi (1991) Shemi, A. 1991, MNRAS, 251, 221
- Shevchenko & Herbst (1998) Shevchenko, V. S., & Herbst, W. 1998, AJ, 116, 1419
- Shu, Adams, & Lizano (1987) Shu, F. H., Adams, F. C., & Lizano, S. 1987, ARA&A, 25, 23
- Simon et al. (1995) Simon, M. et al. 1995, ApJ, 443, 625
- Skinner (2000) Skinner, S. L. 2000, in IAU Symp. No.200, Birth and Evolution of Binary Stars, ed. B. Reipurth & H. Zinnecker (Boston: Kluwer Academic Publishers), 97
- Stelzer, Neuhäuser, & Hambaryan (2000) Stelzer, B., Neuhäuser, R., & Hambaryan, V. 2000, A&A, 356, 949
- Stine et al. (1988) Stine, P. C., Feigelson, E. D., André, P., & Montmerle, T. 1988, AJ, 96, 1394
- Tanaka, Inoue, & Holt (1994) Tanaka, Y., Inoue, H., & Holt, S. S. 1994, PASJ, 46, L37
- Tsuboi et al. (1998) Tsuboi, Y., Koyama, K., Murakami, H., Hayashi, M., Skinner, S., and Ueno, S. 1998, ApJ, 503, 894
- Tsuboi (1999) Tsuboi, Y. 1999, PhD thesis, Kyoto University
- Tsuboi et al. (2000) Tsuboi, Y., Imanishi, K., Koyama, K., Grosso, N., & Montmerle, T. 2000, ApJ, 532, 1089
- Tsuboi et al. (2001) Tsuboi, Y., Koyama, K., Hamaguchi, K., Tatematsu, K., Sekimoto, Y., Bally, J., & Reipurth, B. 2001, ApJ, 554, 734
- Tsujimoto et al. (2001) Tsujimoto, M., Koyama, K., Tsuboi, Y., Goto, M., & Kobayashi, N. 2001, ApJS, in press
- Weisskopf, O’dell, & van Speybroeck (1996) Weisskopf, M. C., O’dell, S. L., & van Speybroeck, L. P. 1996, Proc. SPIE, 2805, 2


| Obs.ID | Detector | Sequence ID | Date | Exposure |
|---|---|---|---|---|
| (ks) | ||||
| A1 | ASCA/GIS | 20015010 | 1993 Aug 20–20 | 37.7 |
| A2 | ASCA/GIS | 25020000 | 1997 Mar 2–4 | 93.1 |
| A3 | ASCA/GIS | 96003000 | 1998 Aug 13–15 | 74.7 |
| C1 | Chandra/ACIS | 200060 | 2000 Apr 13–14 | 100.6 |
| Source | DoAr 21 | ROXs 21 | ROXs 31 | ||||
|---|---|---|---|---|---|---|---|
| PhasebbSee Figure 1. | QccThe boundary between phases Q and F2 is not clear because of the existence of a rising part (Figure 1), however there are no significant differences in parameters when the boundary is changed. | F1 | F2ccThe boundary between phases Q and F2 is not clear because of the existence of a rising part (Figure 1), however there are no significant differences in parameters when the boundary is changed. | Q | F | Q | F |
| (keV) | 2.5(2.4–2.6) | 2.9(2.7–3.1) | 2.9(2.8–3.1) | 0.69(0.65–0.74) | 0.86(0.78–4.5) | 0.23(0.15–0.31) | 0.27(0.21–0.41) |
| (keV) | 1.8(1.6–2.1) | 2.6(2.3–3.1) | 1.5(1.2–1.7) | 2.0(1.8–2.5) | |||
| (1022 cm-2) | 1.0(0.97–1.1) | 1.0(0.96–1.1) | 1.10(1.06–1.13) | 0.13(0.079–0.16) | 0.081(0.038–0.11) | 1.7(1.1–2.1) | 1.7(1.0–2.5) |
| Abundances (solar) | |||||||
| O | ddThese are assumed to be the same as “Other” elements. | ddThese are assumed to be the same as “Other” elements. | ddThese are assumed to be the same as “Other” elements. | 0.21(0.086–0.37) | 0.24(0.058–0.52) | ddThese are assumed to be the same as “Other” elements. | ddThese are assumed to be the same as “Other” elements. |
| Ne | 1.0(0.58–1.8) | 0.99(0.45–1.8) | 1.5(0.98–2.2) | 0.75(0.53–1.1) | 0.48(0.22–0.96) | 0.081(0.015–0.22) | 0.22(0.056–2.1) |
| Na | ddThese are assumed to be the same as “Other” elements. | ddThese are assumed to be the same as “Other” elements. | ddThese are assumed to be the same as “Other” elements. | 3.7(1.4–8.2) | 2.6(7.6) | ddThese are assumed to be the same as “Other” elements. | ddThese are assumed to be the same as “Other” elements. |
| Mg | 0.13(0.39) | 0.39(0.11–0.71) | 0.23(0.050–0.45) | ddThese are assumed to be the same as “Other” elements. | ddThese are assumed to be the same as “Other” elements. | ddThese are assumed to be the same as “Other” elements. | ddThese are assumed to be the same as “Other” elements. |
| Si | 0.18(0.078–0.35) | 0.12(0.26) | 0.34(0.23–0.50) | ddThese are assumed to be the same as “Other” elements. | ddThese are assumed to be the same as “Other” elements. | ddThese are assumed to be the same as “Other” elements. | ddThese are assumed to be the same as “Other” elements. |
| S | 0.37(0.22–0.65) | 0.24(0.071–0.42) | 0.32(0.19–0.50) | ddThese are assumed to be the same as “Other” elements. | ddThese are assumed to be the same as “Other” elements. | ddThese are assumed to be the same as “Other” elements. | ddThese are assumed to be the same as “Other” elements. |
| Ar | 0.13(0.43) | 0.69(0.27–1.3) | 0.54(0.27–0.88) | ddThese are assumed to be the same as “Other” elements. | ddThese are assumed to be the same as “Other” elements. | ddThese are assumed to be the same as “Other” elements. | ddThese are assumed to be the same as “Other” elements. |
| Ca | 0.17(0.55) | 0.24(0.73) | 0.41(0.10–0.74) | ddThese are assumed to be the same as “Other” elements. | ddThese are assumed to be the same as “Other” elements. | ddThese are assumed to be the same as “Other” elements. | ddThese are assumed to be the same as “Other” elements. |
| Fe | 0.11(0.057–0.17) | 0.10(0.051–0.18) | 0.14(0.097–0.22) | 0.092(0.056–0.16) | 0.12(0.067–0.20) | 0.019(0.064) | 0.049(0.18) |
| Others | 0.13(1.1) | 0(0.93) | 0.13(0.84) | 0.14(0.065–0.22) | 0.080(0.21) | 0.0080(0.049) | 0.11(0.022–0.34) |
| (1030 ergs s-1)eeAbsorption-corrected luminosity in 0.5–9.0 keV. | 28 | 34 | 38 | 1.5 | 1.9 | 22 | 30 |
| reduced-() | 0.953(175) | 0.910(150) | 1.03(275) | 1.12(96) | 1.07(88) | 1.11(67) | 0.931(85) |