Xmm–newton GT and AO-1 observations of SHARC galaxy clusters :
RX J1120.1+4318 & RX J0256.5+0006
Abstract
We present the follow-up of two galaxy clusters from the Bright and Southern SHARC surveys observed with the Xmm–newton satellite. We studied the galaxy cluster RX J1120.1+4318 which seems to be a relaxed cluster at high redshift according to its surface brightness profile and to its temperature profile which is flat up to 950 kpc. Its mean temperature is measured at 5.3 keV. The other galaxy cluster RX J0256.5+0006 shows two components. We discuss possible scenario.
keywords:
Missions: XMM-Newton – galaxies: clusters: surveys – galaxy: clusters: individual: RX J1120.1+4318 & RX J0256.5+00061 Introduction
Catalogs of galaxy clusters throughout a large range of redshifts and cluster x–ray luminosities are an ideal basis for the test of cosmological parameters (e.g. [\astronciteHenry2000] ; [\astronciteBorgani et al.2001]). The Bright and Southern Serendipitous High redshift Rosat Cluster (SHARC) surveys provide a sample of clusters over two decades of x–ray luminosity (10L1045 erg/s) with redshifts between 0.2 and 0.8 ([\astronciteRomer et al.2000] ; [\astronciteCollins et al.1997] ; [\astronciteBurke et al.1997]).
We present here simple analysis results concerning the follow-up of these selected clusters with the Xmm–newton satellite (see [\astronciteBartlett2002] for a summary of the project). Our analysis is based on the three epic cameras, mos1&2 and pn, aboard Xmm–newton. Throughout the paper, we use a cosmology with H km/s/Mpc, and . The error bars are given with a confidence level of 90%.
2 Data Treatment
2.1 Event file cleaning
The cluster RX J1120.1+4318 was observed for 20 ks and RX J0256.5+0006 for 25 ks with Xmm–newton. We discard the data corresponding to high background periods caused by flares. To monitor this kind of background, we extract light curve in the 10–12 keV energy band for mos data and in the 12–14 keV for the pn. In these energy bands, the effective area of Xmm–newton is negligible and the emission is mainly due to particle induced background. We remove time bins in which there are more than 15 cts/100 s for mos data and 22 cts/100 s for the pn data. The remaining exposure times after the flare rejection are listed in table 1. The flare rejection method is described in detail by [\astronciteMajerowicz et al.2002].
| Observations | mos1 | mos2 | pn |
|---|---|---|---|
| RX J1120.1+4318 | 17.6 | 17.9 | 14.2 |
| RX J0256.5+0006 | 10.6 | 10.3 | 7.1 |
2.2 Vignetting correction
To correct for the vignetting effect — i.e. the variation of the sensitivity of Xmm–newton with off-axis angle and with energy — we use the method which is described in detail by [\astronciteArnaud et al.2001]. This method consists in calculating the ratio of on-axis effective area to effective area at the event position on the detector.
2.3 Background subtraction method
The background subtraction is necessary for extended sources like clusters of galaxies. After removing flares, the background components are the high energy particle induced background, non-vignetted by the telescopes, and the cosmic x–ray background (hereafter cxb) which is vignetted and depends on sky position of the observation.
To remove these two components, we use a blank sky event file which was produced for each epic camera111They can be retrieved from the Vilspa ftp site : ftp://xmm.vilspa.esa.es/pub/ccf/constituents/extras/background. We first subtract the blank field from the source. This step allows to subtract the high energy particle induced background. The second step consists in the correction for the cxb. This is done by using data in the region outside the cluster emission. We do the first step for this region and the expected residuals are the difference of emission between the local cxb and the cxb in the blank field. We finally subtract these residuals to the product of the first step.
This technique to remove all background components is described with more details in [\astronciteMajerowicz & Neumann2001] and [\astroncitePratt, Arnaud & Aghanim2001].
3 RX J1120.1+4318 : a high z relaxed cluster
3.1 Spatial analysis
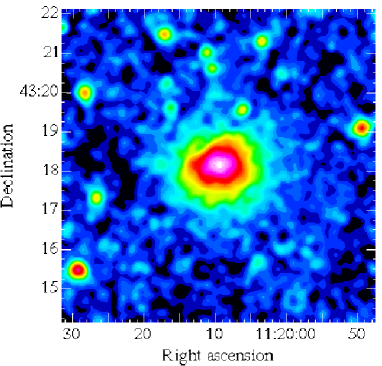
RX J1120.1+4318 is a distant galaxy cluster at a redshift of 0.6. At this redshift one arc-minute corresponds in our cosmology to 470 kpc. In the figure 1 where all epic cameras were combined, we see that this cluster is most likely in a dynamical relaxed state since its shape of the x–ray emission is fairly regular and spherical.
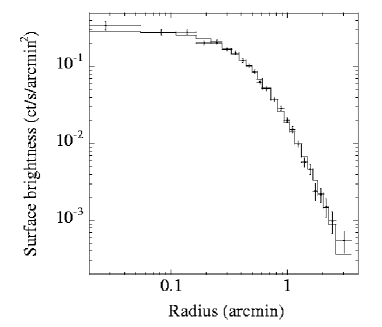
The surface brightness profile of this cluster (see [\astronciteMajerowicz et al.2002] for more explanations about the code) in the energy band between 0.3 and 3 keV is shown in figure 2. This profile is background subtracted and we exclude all point sources in the field of view. We also regroup the data so that we have a signal-to-noise ratio of at least 3 in each bin. The cluster is firmly detected up to 3’ which corresponds to roughly 1.5 Mpc.
We fit this profile with a -model where the surface brightness is defined by :
| (1) |
is the so-called core radius. We obtain and arc-minute or kpc.
3.2 Spectral analysis

Xmm–newton observations allow for the first time to determine the temperature profile of a cluster at redshift z=0.6. To derive it, we extract spectra in three concentric annuli and we fit these extracted spectra with an absorbed single temperature plasma model fixing the hydrogen column density to its galactic value.
The measured mean temperature is 5.30.5 keV with a mean abundance of 0.480.19. The temperature profile is flat up to 950 kpc from the cluster center and does not seem to show a decrease in the center. Furthermore, no excess is observed in the surface brightness profile (see figure 2). We can thus conclude that this cluster cannot host a strong cooling flow in its center.
4 RX J0256.5+0006 : a merging cluster ?
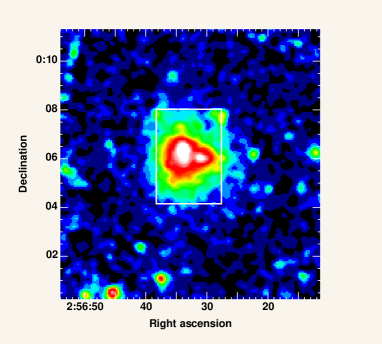
RX J0256.5+0006 is a medium distant cluster at a redshift of 0.36. Figure 4 shows cluster image. This cluster appears bimodal. It is of interest to know whether this cluster is in fact in a merger state or whether the bimodal structure is due to chance alignment of two physically unrelated clusters.
Numerical simulations show ([\astronciteTakizawa1999] ; [\astronciteRoettiger, Loken & Burns1997] ; [\astronciteSchindler & Müller1993]) that cluster mergers create major shock fronts which heat the intracluster medium between the colliding components. To see possible spatial temperature variations in the cluster, we create a hardness ratio map (see figure 5). We do not see strong hardness ratio variations between the two components. However this might be due to lack of statistics. But it might also be linked to the possible merger geometry. In case of merging close to the line of sight, the resulting shock waves are widely distributed in the plane-of-sight and not visible for us as concentration between the two components.
Moreover figure 5 shows a hot region which appears in region 1 but the statistics is not sufficient to provide a precise spectroscopic analysis of its temperature.
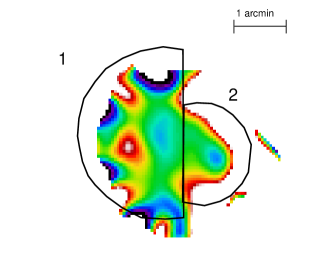
We extract one spectrum per region defined in figure 5 to estimate their mean temperature, and we find : T keV and T keV.
To know how far are the two components, we let the redshift as a free parameter for the spectrum fits and we find z and z. The two components can thus be at the same redshift and physically related, or unconnected to each other. In that case it seems that the smallest component is behind the biggest one.
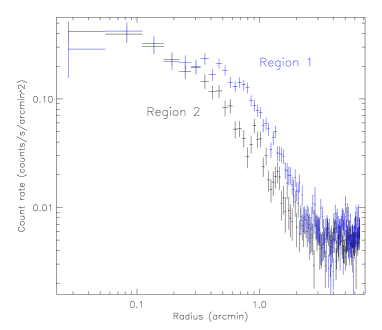
With figure 6, we extract surface brightness profiles for the biggest component in the region where it is not affected by the emission of the second cluster. From the contours, we can already see the compression of the isophots in region 2. It is clear that the gas distribution is not azimuthally symmetric. This indicates that this component is not in a relaxed state but in a merger state.
In conclusion, we cannot yet definitely conclude on the exact dynamical state of RX J0256.5+0006, although there are several indications that it is not relaxed. This work is still in progress. In particular, some optical observations will be added and could help us by building galaxy spatial distribution and determining galaxy spectroscopic redshifts.
References
- [\astronciteArnaud et al.2001] Arnaud M., Neumann D.M., Aghanim N., Gastaud R., Majerowicz S., Hughes J.P, 2001, A&A, 365, L80
- [\astronciteBartlett2002] Bartlett J., this issue
- [\astronciteBorgani et al.2001] Borgani S., Rosati P., Tozzi P., Stanford S.A., Eisenhardt P.E., Lidman C., Holden B., Della Ceca R., Norman C., Squires G., 2001, astro-ph/0106428
- [\astronciteBurke et al.1997] Burke D.J., Collins C.A., Sharples R.M., Romer A.K., Holden B.P., Nichol R.C., 1997, ApJ, 488, L83
- [\astronciteCollins et al.1997] Collins C.A., Burke D.J., Romer A.K., Sharples R.M., Nichol R.C., 1997, ApJ, 479, L117
- [\astronciteHenry2000] Henry J.P., 2000, ApJ, 534, 565
- [\astronciteMajerowicz & Neumann2001] Majerowicz S. & Neumann D.M., 2001, Galaxy clusters and the High Redshift Universe, eds. D.M. Neumann, F. Durret and J. Trân Thanh Van
- [\astronciteMajerowicz et al.2002] Majerowicz S., Neumann D.M. et al., 2002, in preparation
- [\astroncitePratt, Arnaud & Aghanim2001] Pratt G., Arnaud M. & Aghanim N., 2001, Galaxy clusters and the High Redshift Universe, eds. D.M. Neumann, F. Durret and J. Trân Thanh Van
- [\astronciteRoettiger, Loken & Burns1997] Roettiger K., Loken C. & Burns J.O., 1997, ApJ, 109, 307
- [\astronciteRomer et al.2000] Romer A.K., Nichol R.C., Holden B.P., Ulmer M.P., Pildis R.A., Merrelli A.J., Adami C., Burke D.J., Collins C.A., Metevier A.J., Kron R.G., Commons K., 2000, ApJ, 126, 209
- [\astronciteSchindler & Müller1993] Schindler S. & Müller E., 1993, A&A, 272, 137
- [\astronciteTakizawa1999] Takizawa M., 1999, ApJ, 520, 514