Discovery and analysis of p-mode and g-mode oscillations in the A-type primary of the eccentric binary HD 209295††thanks: Dedicated to the memory of A. W. J. Cousins, discoverer of the variability of Doradus
Abstract
We have discovered both intermediate-order gravity mode and low-order pressure mode pulsation in the same star, HD 209295. It is therefore both a Doradus and a Scuti star, which makes it the first pulsating star to be a member of two classes.
The analysis of our 128 h of multi-site spectroscopic observations carried out over two seasons reveals that the star is a single-lined spectroscopic binary with an orbital period of 3.10575 0.00010 d and an eccentricity of 0.352 0.011. Only weak pulsational signals are found in both the radial velocity and line-profile variations, but we have succeeded in showing that the two highest-amplitude Doradus pulsation modes are consistent with and .
These two modes dominated our 280 h of BVIc multi-site photometry, also obtained over two seasons. We detected altogether ten frequencies in the light variations, one in the Scuti regime and nine in the Doradus domain. Five of the Doradus frequencies are exact integer multiples of the orbital frequency. This observation leads us to suspect they are tidally excited. Attempts to identify modes from the multicolour photometry failed.
We performed model calculations and a stability analysis of the pulsations. The frequency range in which Scuti modes are excited agree well with observations. However, our models do not show excitation of Doradus pulsations, although the damping is smaller in the observed range. We also investigated tidal excitation of Doradus modes. Some of the observed harmonics of the orbital period were found to be unstable. The observed orbital harmonics which are stable in the models can be understood as linear combinations of the unstable modes.
We could not detect the secondary component of the system in infrared photometry, suggesting that it may not be a main-sequence star. Archival data of this star shows that it has a strong ultraviolet excess, the origin of which is not known. The orbit of the primary is consistent with a secondary mass of , which is indicative of a neutron star, although a white dwarf companion is not ruled out.
keywords:
stars: variables: Sct – stars: oscillations – stars: individual: HD 209295 – stars: binaries: close – stars: binaries: spectroscopic – stars: neutron1 Introduction
Four different classes of multi-mode pulsating variables are found near the intersection of the classical instability strip and the main sequence. However, asteroseismology (probing the stellar interior through such pulsations) of these stars has proven to be more difficult than expected. Nonetheless, the example of helioseismology and its enormous reward in terms of the physical understanding of the Sun’s interior (e.g. see Gough 2000) has been a great motivation for continuing efforts in probing the structure of these stars by means of their pulsational properties.
Many attempts to detect solar-type oscillations in stars have resulted in inconclusive results, although success has been claimed in some instances (e.g. Kjeldsen et al. 1995). Because of their extremely low amplitude, it is only recently (e.g. Bedding et al. 2002) that we are beginning to see detections which may be considered significant. Successful asteroseismology based on the analysis of solar-type oscillations now appears immanent.
The rapidly oscillating Ap stars (see Kurtz & Martinez 2000 for a recent comprehensive review) are high-radial order p-mode pulsators. Their pulsation spectra resemble that of the Sun. In these stars, only a few independent modes are observed. Moreover, the presence of a strong magnetic field is expected to modify the frequencies and eigenfunctions of the modes. Successful modelling of these pulsations does not seem possible at this time. Nevertheless, some progress is currently being made (e.g. Cunha & Gough 2000).
The third group of pulsators in this region of the HR Diagram are the Scuti stars, which are low-radial order p- and probably mixed-mode pulsators (see Breger & Montgomery 2000). For some of these stars, tens of pulsations modes have been detected and their frequencies determined with high precision (see e.g. Handler et al. 2000). Although mean densities, and even asteroseismological distances (Handler et al. 1997) have been estimated, the problem of mode identification and shortcomings in the stellar models are major difficulties (see e.g. Pamyatnykh et al. 1998 for a discussion).
The Doradus stars are high-overtone gravity (g) mode pulsators (Kaye et al. 1999a). In these stars only a few modes are excited to observable amplitude amongst a dense forest of possible modes. As a result, accurate starting values of the basic stellar parameters are required to enable observed and calculated frequencies to be matched.
In principle, it is possible for Scuti and Doradus pulsations to co-exist in a star as they occupy overlapping regions in the HR diagram. This offers new opportunities for successful asteroseismology, as noted by Handler (1999a). In such stars it may be possible to use the Scuti pulsations to place strong constraints on the stellar parameters, easing the mode identification problem of the Dor pulsations. In this way it may be possible to obtain information about the deep interior which is unobtainable for pure Sct stars.
Consequently, Handler & Shobbrook (2002) searched for Scuti pulsations in all known candidate Doradus stars located within the Scuti instability strip and accessible from intermediate southern geographical latitudes. About one third of all non-Am and non-Ap stars in the lower instability strip are indeed Scuti stars (Breger 1975). Because Am and Ap stars are rare (if not absent) amongst the Doradus stars (Handler 1999a), detection of some “hybrid” stars may be expected if Scuti and Doradus pulsations are not mutually exclusive. In this paper we report the discovery and analysis of such a star, HD 209295 = Sangam Mani.
This is a V=7.3 mag Southern () star of spectral type A9/F0 V (Houk & Cowley 1975). It was discovered as variable by the Hipparcos mission (ESA 1997). Handler (1999a) performed a frequency analysis of these data and detected four periods; we show the results in Fig. 1 and Table 1. We are aware that a search for multiple periods in Hipparcos photometry is difficult and can lead to spurious results (Eyer & Grenon 1998). However, the case of HD 209295 is so simple and convincing that an error in the analysis is considered improbable. The multi-periodicity leaves no doubt that HD 209295 is a bona fide Doradus star.
| ID | Frequency | Amplitude | S/N |
|---|---|---|---|
| (cycles/day) | (mmag) | ||
| 1.12957 0.00002 | 37 2 | 12 | |
| 2.30222 0.00003 | 31 2 | 10 | |
| 2.57579 0.00005 | 16 2 | 5 | |
| = | 1.1726 0.0001 | 12 2 | 4 |

HD 209295 is considerably hotter than all other Dor stars. Handler (1999a) suggested that the published Strömgren of this star (Twarog 1980) is too blue compared to . Handler (1999b) obtained new Strömgren photometry and confirmed the discrepancy (cf. Table 2). Grenier et al. (1999) made two measurements of the radial velocity of the star using an echelle spectrograph and the cross-correlation technique. They did not comment on binarity or any other peculiarity.
| V | Reference | ||||
|---|---|---|---|---|---|
| 7.32 | 0.149 | 0.182 | 0.819 | 2.781 | Twarog (1980) |
| 7.29 | 0.139 | 0.185 | 0.840 | 2.821 | Handler (1999b) |
Using the mean of the Strömgren indices from Table 2 (which indicate zero reddening), the effective temperature and gravity of HD 209295 can be estimated. Kurucz’s (1991) calibration yields K, .
The Hipparcos parallax of HD 209295 is mas. Using , , the parallax gives . With as determined above, and, by means of evolutionary tracks calculated using the Warsaw-New Jersey code (see e.g. Pamyatnykh et al. 1998), a mass of 1.84 is determined. We can then also calculate a semi-independent second value for , namely , consistent with the previous value. HD 209295 is therefore the hottest Doradus star known to date; it lies in the middle of the Scuti instability strip on the main sequence (Fig. 2).

Because of its location in the colour-magnitude diagram, HD 209295 is a good candidate Scuti star. Indeed, multi-periodic Scuti pulsations were found by Handler & Shobbrook (2002), thus placing HD 209295 as a member of two classes of pulsating star. Spectroscopic and photometric follow-up observations were organized immediately after this discovery, and a multi-site campaign was conducted in August 2000. We report the results of these campaigns.
2 Observations
2.1 Optical Photometry
As comparison stars, we used HD 207802 (B9/B9.5V, ) and HD 209829 (F3V, ) in our photoelectric photometry. Measurements were obtained at the 1.0-m, 0.75-m and 0.5-m telescopes of the Sutherland station of the South African Astronomical Observatory (SAAO), the 0.6-m telescope at Siding Spring Observatory (SSO) in Australia (Shobbrook 2000), and the 0.6-m Zeiss telescope at the Osservatório do Pico dos Dias (LNA, Brazil). Observations were conducted from October 1999 to October 2000. Most measurements were obtained in August and September 2000 in a co-ordinated multi-site effort. A journal of the observations is given in Table 3.
| Telescope | Run start | Run length | Observer |
| HJD - 2450000 | (h) | ||
| SAAO 0.75-m | 1464.335 | 3.31 | GH |
| SAAO 0.75-m | 1465.249 | 6.34 | GH |
| SSO 0.6-m | 1467.033 | 2.78 | RRS |
| SSO 0.6-m | 1468.916 | 6.05 | RRS |
| SSO 0.6-m | 1491.937 | 2.35 | RRS |
| SSO 0.6-m | 1498.918 | 2.35 | RRS |
| SAAO 0.5-m | 1502.282 | 1.85 | GH |
| SAAO 0.5-m | 1503.268 | 2.62 | GH |
| SAAO 0.5-m | 1505.267 | 2.57 | GH |
| SAAO 0.5-m | 1507.310 | 1.08 | GH |
| SAAO 0.5-m | 1509.295 | 1.63 | GH |
| SSO 0.6-m | 1510.924 | 1.85 | RRS |
| SAAO 0.5-m | 1511.264 | 2.40 | GH |
| SSO 0.6-m | 1512.933 | 2.18 | RRS |
| SSO 0.6-m | 1513.926 | 0.94 | RRS |
| SSO 0.6-m | 1516.930 | 2.04 | RRS |
| SSO 0.6-m | 1517.921 | 1.20 | RRS |
| SAAO 0.5-m | 1518.266 | 0.86 | LE |
| SAAO 0.5-m | 1519.283 | 0.48 | LE |
| SSO 0.6-m | 1524.930 | 1.63 | RRS |
| SSO 0.6-m | 1754.110 | 3.41 | RRS |
| SSO 0.6-m | 1754.962 | 5.45 | RRS |
| SAAO 0.75-m | 1758.343 | 3.46 | ERC |
| SSO 0.6-m | 1759.947 | 8.11 | RRS |
| SAAO 0.75-m | 1761.343 | 7.87 | ERC |
| SAAO 0.75-m | 1762.364 | 7.25 | ERC |
| SSO 0.6-m | 1762.944 | 7.75 | RRS |
| SAAO 0.75-m | 1763.337 | 8.11 | ERC |
| SAAO 0.75-m | 1764.278 | 6.53 | ERC |
| SSO 0.6-m | 1767.227 | 2.28 | RRS |
| SAAO 0.75-m | 1768.241 | 10.25 | GH |
| SAAO 0.75-m | 1769.239 | 10.27 | GH |
| LNA 0.6-m | 1769.819 | 0.24 | AB |
| SAAO 0.75-m | 1770.234 | 10.37 | GH |
| LNA 0.6-m | 1770.514 | 6.84 | AB |
| SAAO 0.75-m | 1771.237 | 10.27 | GH |
| LNA 0.6-m | 1771.498 | 3.19 | AB |
| SAAO 0.75-m | 1772.238 | 10.27 | GH |
| SAAO 0.75-m | 1773.226 | 10.49 | GH |
| SAAO 0.75-m | 1775.223 | 4.99 | GH |
| LNA 0.6-m | 1775.575 | 5.59 | AB |
| LNA 0.6-m | 1776.651 | 3.91 | AB |
| LNA 0.6-m | 1777.486 | 7.56 | AB |
| SSO 0.6-m | 1777.904 | 6.14 | RRS |
| SAAO 0.75-m | 1778.493 | 3.67 | GH |
| SAAO 1.0-m∗ | 1785.256 | 9.94 | GH |
| SSO 0.6-m | 1785.918 | 8.45 | RRS |
| SSO 0.6-m | 1786.991 | 0.67 | RRS |
| SSO 0.6-m | 1787.898 | 9.58 | RRS |
| SAAO 0.5-m | 1789.242 | 8.74 | GH |
| SSO 0.6-m | 1789.935 | 8.52 | RRS |
| SAAO 0.5-m | 1791.337 | 1.27 | GH |
| SAAO 0.5-m | 1792.253 | 8.42 | GH |
| SAAO 0.5-m | 1850.284 | 1.51 | DJJ |
| SAAO 0.5-m | 1852.277 | 1.78 | DJJ |
| SAAO 0.5-m | 1853.332 | 0.41 | DJJ |
| SAAO 0.5-m | 1857.270 | 2.45 | DJJ |
| SAAO 0.5-m | 1858.276 | 1.82 | DJJ |
| SAAO 0.5-m | 1859.274 | 1.92 | DJJ |
| SAAO 0.5-m | 1862.278 | 2.04 | DJJ |
| Total | 280.35 |
We used the Johnson B and V filters as well as the Cousins Ic filter (the latter only in the year 2000) with a total integration time of 1 minute in each filter as a compromise between good time resolution and maximum colour information. Apertures of 30 – 45 arcseconds on the sky were used. Sky measurements were taken at suitable intervals depending on the brightness and proximity of the Moon.
The observing sequence was chosen to result in both good coverage for the short-period Scuti pulsations and best long-term stability. We adopted the sequence C1-V-C2-V-C1… (C1 and C2 are the comparison stars and the V is the variable), which resulted in one variable star measurement every 6 minutes. Supplementary observations of UBV(RI)c standard stars were also acquired.
Data reduction was performed in the standard way, i.e. corrections for coincidence losses, sky background and extinction were followed by calculating differential magnitudes between the comparison stars. The latter were examined for variability. It seems that one of the two stars is slightly variable on a time scale of about 1.1 or 10 days with a amplitude of 2 mmag. We investigated whether this could be due to differential colour extinction and found no support for such an interpretation. As our programme star exhibits long-term variability with much higher amplitude, we cannot determine unambiguously which of the two stars is the potential variable, but we suspect HD 209829.
In any case, we proceeded by constructing a differential target star light curve relative to the measurements of both comparison stars. We standardized these magnitude differences by using the transformation equation slopes calculated from the standard star observations mentioned above. We note that the photometric zero-points of the different telescope/instrument combinations agreed to better than 2 mmag for each filter or colour used during the multi-site campaign, but we experienced some difficulties with homogenizing the data from the discovery season. Finally, the time base of our observations was converted to Heliocentric Julian Date (HJD). Most of the light curves obtained during the central part of the multi-site campaign are shown in Fig. 3.

2.2 Infrared Photometry
In addition to the optical data, L. A. Crause obtained infrared JHKL measurements on the night of September 1, 2000 using the 0.75-m telescope of the SAAO with the MkII infrared photometer (an upgraded version of the instrument described by Glass 1973). The data were reduced to the SAAO system by using standard stars defined by Carter (1990). As the infrared observations were obtained simultaneously with optical photometry, standard BVIcJHKL magnitudes could be calculated (Table 4). The star was approaching a local minimum in its light curve when these measurements were taken.
| Filter | Magnitude |
|---|---|
| B | 7.623 0.005 |
| V | 7.370 0.005 |
| Ic | 7.070 0.005 |
| J | 6.872 0.009 |
| H | 6.727 0.007 |
| K | 6.746 0.008 |
| L | 6.721 0.081 |
These optical and infrared colours are consistent with the spectral type of the star as inferred from standard relations (Drilling & Landolt 2000, Tokunaga 2000), but agree less well with the effective temperature determined from uvby photometry. However, this may be due to the high amplitude of the light variations. The total colour amplitude implies temperature variations of K between light extrema, sufficiently large to explain the apparent discrepancy.
2.3 Spectroscopic observations
Spectroscopic observations of HD 209295 were obtained with three different telescopes. We used the 1.9-m telescope at SAAO, the 1.9-m telescope at Mt. Stromlo (MS) in Australia, and the 1.2-m Euler telescope at the European Southern Observatory (ESO) in Chile. A summary of these measurements can be found in Table 5.
The bulk of the data originated from SAAO using the GIRAFFE echelle fibre-fed spectrograph attached to the Cassegrain focus of the 1.9-m telescope. The GIRAFFE spectrograph has a resolving power of about 32 000. The TEK CCD chip gives a resolution of 0.06 – 0.09 Å per pixel. A Th-Ar arc lamp was used for wavelength calibration with arc spectra taken at regular intervals to calibrate possible drifts. The wavelength range was 4400 – 6680 Å spread over 45 orders. Exposure times were normally 10 min for a S/N ratio of about 30 – 60. A total of 422 spectra of HD 209295 was obtained during three observing runs.
The spectroscopic observations at MS were obtained with the coude echelle spectrograph on the Mount Stromlo 1.9-m telescope. Spectra with a resolution of Å at H were recorded on a 20484096 pixel TEK CCD. The wavelength range obtained with this set-up was 4500 – 6900 Å spread over 42 orders. Exposure times were between 17.5–20 min for a S/N ratio of about 25–60. A Th-Ar arc lamp was used for wavelength calibration. Due to poor weather a total of only 15 spectra of HD 209295 was obtained.
The spectroscopic observations in Chile were performed with the Swiss 1.2-m Ritchey-Chretien Euler telescope at ESO, La Silla. Euler is equipped with a high-resolution echelle spectrograph, CORALIE, and a 2k 2k CCD camera with 15m pixels. The resolving power amounts to 50 000 and the total wavelength range is 3900Å – 6800Å in 68 orders, without any gaps in the coverage. The CORALIE spectra are extracted on-line following a standard echelle reduction procedure. In the case of our measurements, wavelength calibration utilized the most recently obtained ThAr spectrum. Each order of the stellar spectrum was then divided by the blaze function. For a full description of the reduction scheme we refer to Baranne et al. (1996). The integration times were adapted to the atmospheric conditions (seeing, presence of clouds) and ranged from about 15 to 18 minutes. The typical S/N ratio was 30. In total, 38 spectra were obtained during one week.
| Site | Run start | Length | Observer | ||
| HJD - 2450000 | (h) | (s) | |||
| SAAO | 1501.250 | 3.02 | 600 | 16 | LAB |
| SAAO | 1502.268 | 2.39 | 600 | 13 | LAB |
| SAAO | 1503.262 | 2.39 | 600 | 13 | LAB |
| SAAO | 1504.249 | 2.99 | 600 | 16 | LAB |
| MS | 1505.029 | 0.33 | 1200 | 1 | DJJ |
| SAAO | 1505.255 | 2.42 | 600 | 13 | LAB |
| SAAO | 1506.250 | 0.35 | 600 | 2 | LAB |
| SAAO | 1507.297 | 1.29 | 600 | 7 | LAB |
| SAAO | 1508.249 | 2.81 | 600 | 15 | LAB |
| SAAO | 1509.251 | 2.54 | 600 | 12 | LAB |
| MS | 1509.960 | 0.68 | 1200 | 3 | DJJ |
| MS | 1510.924 | 2.22 | 1050 | 6 | DJJ |
| SAAO | 1511.256 | 2.42 | 600 | 13 | LAB |
| MS | 1511.942 | 1.62 | 1050 | 5 | DJJ |
| SAAO | 1512.254 | 2.44 | 600 | 13 | LAB |
| ESO | 1762.741 | 2.70 | 975 | 8 | TM |
| ESO | 1763.700 | 3.69 | 1100 | 10 | TM |
| SAAO | 1765.347 | 0.17 | 600 | 1 | CK |
| ESO | 1765.744 | 3.69 | 1100 | 8 | TM |
| ESO | 1766.703 | 2.92 | 1100 | 7 | TM |
| SAAO | 1768.347 | 8.08 | 1095 | 21 | CK |
| ESO | 1768.802 | 1.91 | 1100 | 5 | TM |
| SAAO | 1769.336 | 8.21 | 1016 | 24 | CK |
| SAAO | 1770.325 | 6.95 | 1000 | 21 | CK |
| SAAO | 1771.345 | 8.12 | 975 | 24 | CK |
| SAAO | 1772.345 | 7.70 | 1200 | 20 | CK |
| SAAO | 1773.354 | 7.70 | 1000 | 23 | CK |
| SAAO | 1774.406 | 1.34 | 1400 | 3 | CK |
| SAAO | 1776.328 | 0.90 | 1500 | 2 | CK |
| SAAO | 1777.388 | 1.23 | 1600 | 3 | CK |
| SAAO | 1778.348 | 5.55 | 1557 | 7 | CK |
| SAAO | 1849.267 | 2.42 | 600 | 12 | LAB |
| SAAO | 1850.271 | 2.56 | 600 | 14 | LAB |
| SAAO | 1851.274 | 2.50 | 600 | 10 | LAB |
| SAAO | 1852.262 | 2.81 | 600 | 15 | LAB |
| SAAO | 1853.258 | 2.68 | 600 | 14 | LAB |
| SAAO | 1855.354 | 0.55 | 700 | 2 | LAB |
| SAAO | 1856.258 | 2.44 | 600 | 13 | LAB |
| SAAO | 1857.265 | 2.47 | 600 | 13 | LAB |
| SAAO | 1858.264 | 2.25 | 600 | 12 | LAB |
| SAAO | 1859.263 | 2.21 | 600 | 12 | LAB |
| SAAO | 1860.265 | 2.23 | 600 | 12 | LAB |
| SAAO | 1862.262 | 2.30 | 600 | 12 | LAB |
| Total | 128.19 | 476 |
In contrast to the photometric observations, the spectroscopic measurements were not reduced centrally. For the SAAO data, we used the local reduction software (see http://www.saao.ac.za/facilities/) for corrections for for bias and flat field, order extraction and wavelength calibration. The same reduction steps for the MS data were performed in IRAF.
3 Analysis
3.1 The photometry
Our frequency analysis was performed with the programme PERIOD 98 (Sperl 1998). This package applies single-frequency power spectrum analysis and simultaneous multi-frequency sine-wave fitting, but also has some advanced options which will be described later as necessary. We calculated the spectral window and amplitude spectra of our data as well as the amplitude spectra of residual light curves after the previously identified periodicities had been removed using a multi-periodic fitting algorithm. Similar analysis were performed for all the three filters used. We adopted the mean frequencies for our final solution.
Our analysis was concentrated on multi-site data from the year 2000. Due to the different telescopes and detectors used, the 1999 data analysis is complicated by zero-point calibration problems. Also, the data runs were rather short in 1999 and the possibility exists that the star may have had a different amplitude at this time. We used the 1999 data only when the zero-point problems were relatively minor.
3.1.1 The Doradus pulsations
In Fig. 4 we show amplitude spectra of the B filter data with consecutive prewhitening by the low frequencies. For the 2000 data we calculated the window function as the Fourier transform of a single sinusoid with frequency 1.129 cycles/day and amplitude of 50 mmag. Due to the multi-site coverage, aliasing is not a problem. We detected six significant frequencies in the light variations. The first four frequencies were already shown in Table 1.

The significance of a detection was estimated using the S/N criterion of Breger et al. (1993). The residuals after prewhitening this frequency solution suggest that more periodicities are present. The highest peaks in the residual spectra are located at the same frequencies in each of the B, V, and Ic data sets, and the “noise level” decreases from B to Ic. This suggests that most of the “noise” in the blue may well be due to additional periodicities. The derived frequencies and amplitudes are listed in Table 6.
3.1.2 The Scuti pulsations
The zero point uncertainties in the data set from 1999 have little effect in the frequency range in which the Scuti pulsations are present. Consequently, we can incorporate these observations into the frequency analysis. We therefore prewhitened the data by the six-frequency solution discussed above from the 2000 data. For the 1999 data we prewhitened by the first five of these frequencies which were found in common with the analysis of the 2000 data. This prewhitening is important because low-frequency variations can artificially increase the noise level in the high-frequency domain through spectral leakage. The amplitude spectrum of the combined B filter data and subsequent prewhitening are shown in Fig. 5.

Although several peaks in the amplitude spectra in Fig. 5 are prominent, only one signal is a significant detection. This is surprising, as typical multi-periodic beating is seen in the light curves of Fig. 3, e.g. HJD 2451770.35 vs. HJD 2451770.55. We therefore checked whether these signals could be non-coherent by analysing several subsets of data. No evidence for short-lived Scuti type variations or variations with changing amplitude was found. In fact, several of the more conspicuous signals were present in all data subsets (e.g. in different subsets of the multi-site data or in individual filters). Thus we suspect that several such periodicities may be real. A multi-frequency solution with and the three next strongest variations in the Scuti regime fits the short-term variations reasonably. The corresponding peaks are marked with arrows in the lowest panel of Fig. 5. The frequency range of possibly excited Scuti pulsations can be constrained to 10 – 32 cycles/day. We list the results of our frequency analysis of the photometric data in Table 6.
| Measurements from the year 2000 | Measurements from the year 1999 | ||||||
| ID | Frequency | Amplitude | Amplitude | Amplitude | Amplitude | Amplitude | |
| (d-1) | (mmag) | (mmag) | (mmag) | (mmag) | (mmag) | ||
| 0.4 | 0.3 | 0.2 | 0.6 | 0.5 | |||
| Doradus frequencies | |||||||
| 1.1296 | 35.9 | 49.6 | 38.5 | 23.0 | 35.9 | 26.9 | |
| 2.3024 | 28.3 | 39.1 | 28.3 | 15.5 | 24.5 | 17.3 | |
| 2.5758 | 11.6 | 16.0 | 11.4 | 6.2 | 21.7 | 15.8 | |
| 1.1739 | 9.0 | 12.4 | 7.9 | 4.6 | 5.4 | 4.9 | |
| 1.7671 | 7.0 | 9.7 | 7.4 | 4.1 | 11.0 | 8.5 | |
| 2.2572 | 5.4 | 7.4 | 5.3 | 3.1 | n/a | n/a | |
| Scuti frequency | |||||||
| 25.9577 | 5.3 | 1.8 | 1.4 | 0.8 | 1.5 | 1.3 | |
We need to make two remarks here. Firstly, the results for the data from 1999 are only listed for completeness in Table 6. We suspect that the amplitudes of the Dor pulsations in this data set are artificially decreased not only because of zero-point problems, but also due to poor data sampling. Secondly, we stress that these are only preliminary results. We will revisit the frequency analysis in Section 3.4.
3.2 Spectroscopic analyses
The first step in the analysis is to rectify the spectra, i.e. to place the continuum. This was done by using an unbroadened synthetic spectrum with T K, as a template, using the SPECTRUM code (Gray & Corbally 1994). A running median of each echelle order was divided by the corresponding section of the synthetic spectrum and taken to represent the response function of the instrument. A polynomial of degree 5 was fitted to the response function and used to correct the observed spectrum. The result is the rectified spectrum of the star used for cross-correlation.
3.2.1 Radial velocities
For each order, the observed rectified spectrum was correlated with the corresponding section of the synthetic spectrum after removing the unit continuum. The resulting correlation function is, in effect, the mean line profile with the continuum removed. The “radial velocity” for each order is obtained by fitting a quadratic to the correlation function and finding the position of the maximum. The mean radial velocity from all the orders is also obtained. A standard error of typically 1 – 3 km s-1 was found for the SAAO spectra.
A few of the spectroscopic observations listed in Table 5 turned out to be of a quality too poor for further use. Four spectra were discarded, and 472 were retained. Some slight deviations ( km/s) in the seasonal radial velocity zero-points in the SAAO spectra were rectified by means of telluric lines.
An immediate finding from our time-resolved spectroscopy is that the radial velocities of HD 209295 are strongly variable. The total radial velocity amplitude is in excess of 100 km/s, which cannot be due to the pulsations of the star. HD 209295 must be a member of a binary system.
We therefore attempted to determine the orbital period. Visual inspection of the radial velocity curve suggests 3 days, and Fourier analysis (upper panel of Fig. 6) indeed implies an orbital frequency near 0.32 cycles/day, but our data set is affected by aliasing. Prewhitening trial frequencies suggested that the shape of the orbital radial velocity curve is not sinusoidal.
This is a situation in which use of the residualgram method (Martinez & Koen 1994) is indicated, which is based on a least-squares fit of a sine wave with harmonics. The residual sum of squares at each trial frequency is evaluated; can be chosen freely. In that way, alias ambiguities can be circumvented by taking advantage of the information in the Fourier harmonics. Preliminary trials with Fourier analysis suggested that is a good choice for a residualgram as shown in the lower panel of Fig. 6.

The residualgram method eliminated the aliasing problem for the determination of the orbital frequency. We use its result for a refinement of the orbital frequency by using Period 98 (Sperl 1998). This leads to an improved orbital frequency of cycles/day ( = 3.10575 d).
To determine the orbital solution from our radial velocities, we firstly used the SAAO data only, which are the most extensive (almost 90% of all spectra) and are homogeneous. We weighted the individual measurements based on their standard errors. Measurements with standard errors smaller than 2 km/s were given a weight of 1; the weights decreased down to 0.2 for a few measurements with standard errors between 8–9 km/s. We determined an initial orbital solution from these data with an updated version (Strassmeier, private communication) of the differential-correction method (Barker, Evans & Laing 1967).
Using the initial parameters from these methods, we examined the relative zero-points of the three blocks of SAAO measurements; no third body in the system was detected. We then fitted all the campaign data with these orbital parameters and examined the zero-points of the measurements from the other sites. The ESO radial velocities needed to be shifted by km/s. We then calculated our final solution from all the data, with the mean radial velocity fixed. This orbital solution is shown in Table 7 and Fig. 7.
| Parameter | Unit | Value |
|---|---|---|
| (days) | 3.10575 0.00010 | |
| (km/s) | -23.7 0.4 | |
| (km/s) | 54.2 0.7 | |
| 0.352 0.011 | ||
| (degrees) | 31.1 2.0 | |
| HJD | 2451771.864 0.014 | |
| 3.11 0.04 | ||
| 0.042 0.002 |

We note that an extrapolation of our orbital solution to the measurements of Grenier et al. (1999) quoted in the introduction results in a good fit. The two measurements by these authors were taken at similar orbital phases, which explains the comparably small radial velocity difference.
Having solved for the orbital parameters, we can now discuss two issues: the nature of the companion and the possibility of mass transfer in the system. In the upper panel of Fig. 8., we show the dependence of the secondary mass on orbital inclination for various values of the primary mass. From this, we see that . The lower panel of Fig. 8 shows that HD 209295 may come close to filling its Roche Lobe (calculated with the approximation by Eggleton 1983) at periastron if the companion has a small mass. However, we will show in Sect. 4.1 that the companion is probably too massive for the primary to fill its Roche Lobe.
Assuming that the companion of HD 209295 is a main-sequence star, its absolute magnitude ; otherwise its spectral lines would be detected. A spectral type of G0 and later is therefore suggested with a mass (Drilling & Landolt 2000). Our photometry also shows no eclipses (within a conservative limit of 4 mmag), allowing us to infer the constraint . A main-sequence companion of should be detected by means of its infrared excess. We will examine this in Sect. 3.5.

After removal of the orbital variation, the residual radial velocities can be searched for pulsational signals. The amplitude spectrum of these residuals can be found in Fig. 9. Although there are signals in the same frequency range as in the photometry, none gives a reliable detection according to the signal-to-noise criterion of Breger et al. (1993). Consequently, we need to continue the examination of the spectroscopic evidence of the pulsations of HD 209295 by looking at the line-profile variations.

3.2.2 Projected rotational velocity
The correlation profiles for each season can be co-added (after correcting with our orbital solution) to form what is essentially a mean line profile. The projected rotational velocity, , can be determined by fitting a model profile of a rotating star. The model is spherical with a linear limb darkening coefficient and the visible hemisphere is divided into a large number of surface elements. The intrinsic line profile for each element summed over the hemisphere, weighted according to limb darkening, is computed. The projected rotational velocity and mean radial velocity are adjusted until a best fit is obtained to the observed profile. We obtain km s-1 for the SAAO measurements from 1999 and the second set from 2000, and km s-1 for the first data set of the year 2000. Because of the uncertainty in the wings of the correlation profile, the fit was performed using the part of the profile within 90 km s-1 of the line centre.
3.2.3 The high-order profile variations
In a recent paper on the Sct star 38 Eri, Balona (2000) was able to show that pulsation modes of high spherical degree are easy to resolve in stars with moderate to high rotational velocities. Bearing in mind the result from the previous paragraph, HD 209295 falls within this category. We will only use the SAAO spectra for the following analysis, as these are the most homogeneous and best sampled.
Line profile variations due to modes of high degree are seen as moving sub-features in the correlation profiles of the spectra used to determine the radial velocities. As a particular sub-feature crosses the centre of the profile, it determines the radial velocity. A short while later another traveling sub-feature will appear and the radial velocity will suddenly change. These discontinuous jumps are partly responsible for the rather high errors of the radial velocities.
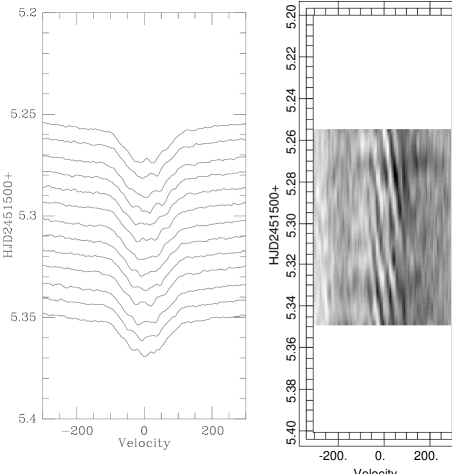
From the spacing of the traveling sub-features, we estimate that the spherical degree is . To enhance the profile variations, we removed the orbital motion and constructed the mean correlation profile from the SAAO data. Each correlation profile was divided by the mean profile to construct “difference” profiles at the given times. The moving features are most clearly seen when these difference profiles are arranged in a time sequence and converted to a grey-scale image. An example is shown in Fig. 10.
While it is clear from Fig. 10 that periodic high-order line profile variations are present, it is not possible to determine the frequencies from the radial velocities alone, as shown before. Clearly, the radial velocity is a poor indicator for modes of high degree.
A common method to determine periodicities in line profile variations is to calculate the periodogram along wavelength bins throughout the line profile, or across the correlation profile. Most of the signal in this analysis is located at frequencies very close to the orbital period and its aliases, suggesting that the removal of the orbital variation did not work satisfactorily. However, we found the signatures of two previously detected modes in the line profiles, although they cannot be detected without prior knowledge. These are the photometric Doradus modes and .
This finding gives us the possibility to attempt a mode identification with the method proposed by Telting & Schrijvers (1997). This technique utilises the phase change of a mode as it progresses through the line profile, and provides some simple mode identification diagnostics depending on the total phase change of the mode frequency and its first harmonic (e.g. ). We calculated these phase changes for the two modes which we think are present and we show their behaviour through the correlation profile in Fig. 11. The mode identification implied by this analysis is summarized in Table 8.

| ID | ||||
|---|---|---|---|---|
| ( rad) | ( rad) | |||
| 0.85 | 1 | 1 | ||
| 1.06 | 1 | 1 |
We note that Telting & Schrijvers (1997) have given error estimates for the mode identifications with this method with for and for . The identifications are plausible: and have high photometric amplitude.
3.3 Combining the spectroscopic and photometric information
Comparing the frequencies of the Doradus pulsations in Table 6 to the orbital frequency we see that the photometric mode corresponds exactly to 8, and is, within the errors, consistent with 7. As noted in Sect. 1.1, the relation is also present within the mode frequencies.
Consequently, we revisited the frequency analysis of the photometric data. We again restricted ourselves to the data from 2000. This time, however, we used Period 98’s capability to fix signal frequencies to certain values, in our case integer multiples of the orbital frequency, and to perform nonlinear least squares fits with frequencies thus fixed.
We started by using the six Doradus frequencies in Table 6, and proceeded by the usual prewhitening procedure. The corresponding amplitude spectra can be found in Fig. 12; they are generated by combining the B filter residuals with the V filter residuals multiplied by a factor of 1.29.

The highest-amplitude peak in the upper panel of Fig. 12 does, indeed, correspond to 3. In addition 5 (second panel of Fig. 12) and 9 (third panel of Fig. 12) are also found. This latter frequency corresponds to exactly . We therefore fixed this frequency combination to its exact value before proceeding. After prewhitening these frequencies, some peaks, including one at 4, are still visible in each filter, but not at a level considered significant.
The third panel from the bottom of Fig. 12, shows the residual amplitude spectra in a wider frequency range after prewhitening by the Scuti mode, . Again, there is evidence of additional Doradus and weak Scuti periodicities. The referee suggested to filter out the slow variability to examine the claimed Scuti variability further. This is done in the second panel from the bottom of Fig. 12; albeit somewhat affected by the filtering, the additional Scuti variations remain with similar amplitudes. They are therefore not artifacts from spectral leakage of the low frequencies. In the lowest panel of Fig. 12 we show the amplitude spectrum of the comparison star data. Although the number of observations of each comparison star is half that of the program star, the noise level in this periodogram is lower still, again suggestive of further periodicities below the detection level.
In Table 9 we show the final multi-frequency solution for the 2000 data set. The corresponding results for 1999 are of little value, as the data sampling is too poor to attempt such a fit. Error estimates are formal values following Montgomery & O’Donoghue (1999). While they should be quite realistic for the Sct modes, they probably underestimate the errors for the Dor modes by a factor of 3–4.
| ID | Combination | Frequency | Ampl. | phase | Ampl. | phase | Ampl. | phase | |
|---|---|---|---|---|---|---|---|---|---|
| (d-1) | (mmag) | () | (mmag) | () | (mmag) | () | |||
| 0.3 | 0.2 | 0.2 | |||||||
| Doradus frequencies | |||||||||
| 1.12934 0.00005 | 63.7 | 50.3 | -39.4 0.3 | 38.9 | -40.3 0.3 | 23.5 | -42.6 0.4 | ||
| 2.30217 0.00006 | 49.9 | 39.4 | -115.4 0.4 | 28.7 | -116.4 0.4 | 15.4 | -117.0 0.6 | ||
| 8 | 2.57593 0.00011 | 23.2 | 18.3 | 66.5 0.8 | 13.2 | 67.2 0.9 | 7.3 | 64.3 1.3 | |
| 1.17283 0.00004 | 14.4 | 11.4 | -80.4 1.3 | 7.6 | -73.3 1.5 | 4.0 | -68.5 2.4 | ||
| 9 | 1.76859 0.00005 | 13.6 | 10.8 | 96.5 1.3 | 8.2 | 95.4 1.4 | 4.8 | 86.2 2.0 | |
| 7 | 2.25394 0.00011 | 10.6 | 8.4 | 2.0 1.7 | 6.6 | -1.0 1.8 | 3.5 | 2.0 2.8 | |
| 3 | 0.96597 0.00011 | 8.9 | 7.0 | -39.2 2.0 | 6.2 | -35.9 1.9 | 4.9 | -33.3 1.9 | |
| 5 | 1.60996 0.00011 | 5.8 | 4.6 | -162.1 3.1 | 3.9 | -158.6 3.0 | 1.9 | -173.9 5.2 | |
| 9 | 2.89792 0.00011 | 5.7 | 4.5 | 47.0 3.2 | 3.5 | 48.9 3.3 | 2.2 | 53.5 4.3 | |
| Scuti frequency | |||||||||
| 25.9577 0.0015 | 5.2 | 1.8 | 158.9 8.3 | 1.4 | 162.8 8.3 | 0.8 | 179.1 12.2 | ||
| 0.32199 0.00011 | |||||||||
The rms residual errors per single data point for this solution are 7.0 mmag in the B filter, 5.7 mmag in the V filter and 4.5 mmag in the I filter. These values again suggest undetected periodicities, since the rms scatter of a single comparison star measurement is 5.1 mmag in B, 4.0 mmag in V and 4.2 mmag in I.
Another estimate of the orbital period can be made from the frequency analysis. We find , consistent with the determination in Sect. 3.2.1. We have examined the residual light curve for possible ellipsoidal variations, but found none exceeding 2 mmag. Finally, one might suspect that , but a fit assuming this relation gives a significantly poorer solution than the one listed in Table 9.
3.4 Attempts at mode identification from colour photometry
The main reason for observing HD 209295 in more than one filter was to attempt a mode identification. This method relies on comparing theoretical amplitude ratios and phase differences of the variations in different wavebands with the observed values. The high amplitude of the light variations of HD 209295 make the star very well suited for this method. Because of the very low amplitude of the Scuti pulsations, only the Doradus modes are considered. However, our calculations indicate that the amplitude ratios and phase differences for the Scuti mode are consistent with pulsation.
We first attempted to apply the method developed by Koen et al. (1999) to the Doradus modes. This technique uses the observed amplitude ratios and phase differences in all filters simultaneously. Unfortunately, no meaningful results were obtained. We then constructed two-colour diagnostic diagrams showing amplitude ratio as a function of phase difference (Watson 1988). In such diagrams, the theoretically determined areas of interest are specified and compared with the observations. We used the Warsaw-New Jersey stellar evolution and W.A. Dziembowski’s NADROT pulsation code for models of 1.8 and 1.9 with effective temperatures between 7250 and 7800 K. These models span the possible range of parameters for HD 209295. We then computed theoretical amplitude ratios and phase shifts for the eigenmodes of those models following Balona & Evers (1999) and examined their location in the corresponding diagrams. We noticed that (except for a few combinations of and ) the results clustered in well-defined regions depending on . Hence, we defined those regions as our regions of interest and compared them to the observations. An example is shown in Fig. 13.

Before evaluating the potential for mode identifications from Fig. 13, two comments need to be made. Firstly, we only show the results for the B and Ic filter pair, as the diagrams are similar in appearance for the other two possible filter combinations, but the observational errors are larger.
Secondly, the locations of the areas of interest depend quite strongly on the pulsation constant . This is a well-known result (e.g. discussed by Garrido 2000), and is the reason why we have separated the results into three subsets which depend on . We chose a suitable subdivision based on the observed Dor frequencies.
The implications from Fig. 13 can be summarized as follows. For modes with d, the mode identification method gives meaningless results. For the modes with d there is some agreement, but this might be coincidence. In any case, the amplitude ratios of the photometric modes are consistent with or 2, but not with .
3.5 The infrared colours and the companion of HD 209295
In Section 3.2.1 we have shown that the binary companion of HD 209295 must have a mass of at least 0.6 . If it were a main-sequence star, this would correspond to a spectral type of K5. The most luminous possible main-sequence companion to HD 209295 is a G0 star. A star more luminous than this would be detected in the spectrum. We decided to search for a companion in the infrared. For this purpose we show the system’s optical and infrared colours in Table 4. We note that interstellar reddening is insignificant because of the proximity of the star ( pc) and its high galactic latitude (); there is also no evidence for reddening in the observed Strömgren colours (Table 2).
We adopted standard relations for absolute magnitude as well as optical and infrared colours of main-sequence stars from the tables of Tokunaga (2000) and Drilling & Landolt (2000). Given the observed magnitude and colour of the system, we added the fluxes of hypothetical G0, K0 and K5 main-sequence companions. For the primary’s flux we used a suitable interpolation between A7 and F0 to reproduce the observed and . The infrared colours of those models were then compared to observations. The result, displayed in Fig. 14, shows the relative infrared excess of the observations and of some of the binary models compared to the expected infrared magnitudes.

Whereas the infrared and magnitudes seem to indicate the presence of a companion, the magnitude argues against this idea; the magnitude is too uncertain to be useful. The infrared excess we calculated also depends on the uncertainties of the standard relations and the accuracy of our measurements. We conclude that we cannot pinpoint the nature of the companion of HD 209295 from the infrared data alone.
4 Further discussion of the observations
4.1 The secondary component and evolutionary history of the HD 209295 system
We were unable to detect the secondary component of the HD 209295 system in the infrared. However, we can still obtain further constraints on its nature. The first constraint is the absence of ellipsoidal variability.
Morris (1985) derived theoretical expressions for system parameters of ellipsoidal variables from the observed light curves. Using his Eq. 6, a limb darkening coefficient of 0.59 from Claret (2000), a gravity darkening exponent of 0.84 (Claret 1999), and a conservative upper limit of 5 mmag on the peak-to-peak amplitude of possible ellipsoidal variations of HD 209295, we can determine the minimum orbital inclination of the system as a function of secondary mass. The result is shown in Fig. 15.

Combining this information with the dependence of secondary mass on inclination from the mass function of the binary (upper panel of Fig. 8), we can derive a refined lower limit of the secondary mass. The result is . This lower limit on the secondary mass has two implications. Firstly, it means that the primary is quite well within the Roche limit. Secondly, the secondary mass is very close to the upper limit derived in Sect. 3.2.1 assuming a main-sequence secondary. In addition, the orbit of the system is also quite eccentric, which is surprising as one would have expected circularization to have taken place.
Claret, Giménez & Cunha (1995) and Claret & Cunha (1997) compared theoretical orbital circularization and synchronization times for main-sequence binaries with observations. From their results and using the surface gravity of HD 209295 as an age indicator, we conclude that the orbital eccentricity of HD 209295 is inconsistent with normal main-sequence binary evolution. For a star similar in age to HD 209295 (log yr as inferred from comparison with pulsational and evolutionary models), one would expect . There is reason to believe, therefore, that the secondary star may be a degenerate object. A white dwarf may have a mass in excess of 1.04 . However, in such a scenario orbital circularization would again have taken place. This is also expected because such a system must have undergone a previous mass transfer phase.
We investigated the ultraviolet fluxes of the object as measured by the TD-1 satellite (Thompson et al. 1978) and compared it to the optical fluxes. For this purpose, we converted the measured magnitudes of HD 209295 to fluxes using the formulae of Gray (1998). We omitted the band because it is dominated by the line. A Kurucz model atmosphere with K (cf. Sect. 1.1) and log =4.3 gave the best match. We then compared the predicted UV fluxes from this fit with the TD-1 measurements (Fig. 16). There is quite a strong UV excess in the TD-1 measurements at 1965 and 2365Å compared to the model atmosphere, but little flux at 1565Å. The shape of this excess resembles an energy distribution of an object of 15000 K. This is a suggestion that a white dwarf companion could be responsible.

Consequently, we attempted to fit some white dwarf star model atmospheres (Koester, private communication) for log =8 and 10000 K 16000 K to this excess. The flux was normalized to the value predicted for a star at the distance of HD 209295. While we could reproduce the approximate shape of the UV excess, the resulting white dwarf luminosity is far too small. A white dwarf star would only be able to generate 0.1 – 0.2 % of the observed UV excess. Hotter white dwarf models would be able to explain a larger fraction of the excess, but they would be inconsistent with the low TD-1 flux at 1565Å.
It is hard to imagine an astronomical object or a physical process which could be made responsible for this UV excess and still be consistent with other observations. A less massive white dwarf is inconsistent with our mass constraints. A subdwarf would be seen in the optical and is inconsistent with the primary being a Pop. I star. A late-type active companion would be detected in X-rays. We need to leave the reason for the UV excess unanswered; it may be possible that the TD-1 measurements are in error. Unfortunately, the star was not observed by IUE (NASA-ESA 1999).
We also need to consider that the secondary may be a neutron star. In this case, the high orbital eccentricity would be a result of the supernova outburst, and the orbit would not be expected to circularize during the main sequence life span of the present primary (see Zahn 1977, whose work also suggests that the primary’s rotation should not be synchronized with the orbital motion of the compact secondary).
Comparing the orbital eccentricity and separation of the HD 209295 system with the X-ray binary population simulations of Terman, Taam & Savage (1996) shows that the observed orbital parameters can be comfortably explained in this scenario. The undetected companion of HD 209295 could therefore be a neutron star, and the system will evolve into an intermediate-mass X-ray binary after the present primary has left the main sequence. The neutron star hypothesis is testable. The previous evolutionary phases should have left their marks in the chemical composition of HD 209295. However, the Strömgren metallicity index and our spectra appear normal.
If the unknown companion of HD 209295 were a neutron star, one would also expect that it would be detectable in X-rays. However, the star has not been detected by ROSAT (Voges et al. 1999, 2000) or Einstein (Moran et al. 1996). Finally, the neutron star should have suffered an impulse from the supernova explosion, which might modify the space motion of the binary system. We therefore calculated the galactic velocities of HD 209295 from its velocity from Table 7, its Hipparcos parallax (see Sect. 1.1) and proper motion ( mas, mas as measured by the Hipparcos satellite (ESA 1997)). We find km/s, km/s and km/s (already corrected for the solar motion) which is not unusual for an early-F main-sequence star (cf. Gilmore & Zeilik 2000). The neutron star interpretation for the secondary in the HD 209295 system therefore also has its weaknesses; we cannot at present identify this star’s nature with certainty.
4.2 Evidence for forced oscillations
In Sect. 3.4 we reported the discovery that many of the photometric frequencies are exact integer multiples of the orbital frequency. This raises the suspicion that they might not be free oscillation modes of the star, but are rather triggered by tidal interactions. Tidally induced nonradial oscillations have been searched for observationally, but the results have not been very convincing, with the possible exception of the slowly pulsating B star HD 177863 (De Cat 2001, Willems & Aerts 2001). As there are quite a number of frequencies which are exact integer multiples of the orbital frequency, there is reason to believe that HD 209295 is the best case for forced oscillations. Further support for this interpretation needs to be sought. Some general information about tidal excitation is therefore useful.
This effect has been studied by several authors theoretically, most often in connection with neutron star/main sequence binaries. For instance, Kumar, Ao & Quatert (1995) showed that stellar p, f and low-order g-modes are not easily excitable through tidal effects, but that intermediate-order g-modes may be excited. These are, of course, exactly the modes in which Doradus stars (and SPB stars) pulsate.
Furthermore, tidally excited modes will have a shape adjusted to the gravitational potential of the exciting star. The tidal deformation can be decomposed into a linear superposition of the star’s g- and p-mode oscillations (Press & Teukolsky 1977). Their dominating components are the , modes (e.g. see Kosovichev & Severnyj 1983). Unfortunately, we did not succeed in providing mode identifications for one or more of the variations suspected to be forced oscillations. However, if we are really dealing with forced oscillations, they should be approximately in phase at periastron where the tidal force is at maximum.
We have already listed pulsational phases of the different modes at a periastron passage in Table 9. The phase values are similar and seem to show some alignment of the supected tides. This is also the case for assuming it is a , mode, as there is a 180° phase ambiguity. The variations are, however, not perfectly in phase, possibly due to nonadiabatic effects.
4.3 The photometric and radial velocity amplitudes
It is somewhat puzzling that there is little correspondence in amplitude between the photometric and radial velocity data. The two highest-amplitude Doradus modes in the photometry are undetected in the radial velocities. While the range in frequency of Scuti instability is in approximate agreement in the photometry and radial velocities, there is no clear match in frequencies between the two data sets.
Breger, Hutchins & Kuhi (1976) determined the ratios of velocity to light amplitudes in several Scuti stars and found values between of 50 – 125 km s-1 mag-1. Using this value for the Scuti pulsations in HD 209295, we would expect the photometrically detected modes to have radial velocity amplitudes smaller than 0.2 km/s, and hence they would not be detected. However, we detected radial velocity variations with amplitudes of around 2 km/s in the Scuti range, which should then generate photometric amplitudes of at least 15 mmag, but there is no trace of them. The only plausible explanation is that the short-period variations in the spectroscopy are not due to pulsation.
We can get limits to the radial velocity amplitude of the two independent Doradus modes of HD 209295 by fitting the radial velocities with the photometric periods. This results in an upper limit of 1 km/s for the amplitude of both modes. We then obtain 2 km s-1 mag-1 for and 2 km s-1 mag-1 for .
In Table 10 we show all available amplitude determinations from photometric and radial velocity measurements of Doradus stars from the literature. We only considered data sets in which simultaneous radial velocity and photometry was obtained to avoid being sensitive to amplitude variations. Only those cases where individual mode periods could be resolved are listed.
| Star | 2 | 2 | Ref. | ||
| (km/s) | (mmag) | (km s-1 mag-1) | |||
| Dor | 0.6 0.2 | 23 1 | 26 9 | 3 | 1 |
| 2.6 0.2 | 27 1 | 96 8 | 1 | ||
| 1.2 0.2 | 13 1 | 92 8 | 1 | ||
| 9 Aur | 1.7 1.2 | 35 1 | 48 34 | 3 | 2, 3 |
| 3.0 0.8 | 20 1 | 148 39 | 3 | 2, 3 | |
| 3.1 1.1 | 18 1 | 172 61 | ? | 2, 3 | |
| HR 8330 | 5.2 0.1 | 15 1 | 350 20 | 2 | 4, 5 |
| HD 68192 | 2.2 0.2 | 21.7 0.2 | 101 10 | ? | 6 |
| HD 209295 | 38.9 0.2 | 1 | 7 | ||
| 28.7 0.2 | 1 | 7 |
References: 1: Balona et al. (1996), 2: Zerbi et al. (1997), 3: Aerts & Krisciunas (1996), 4: Kaye et al. (1999b), 5: Aerts & Kaye (2001), 6: Kaye et al. (1999c), 7: this paper
It appears that there is an order of magnitude spread in the 2 values for the different stars, but also for different modes of the same star. The limits we obtained for HD 209295 are at the lower end of the range to be found in Table 1. However, the lowest 2 values were obtained for modes of , not for as suggested for the two independent modes of HD 209295.
Aerts & Krisciunas (1996) offered an explanation for such diverse behaviour: the photometric variations are mostly due to temperature variations, which hardly affect the radial velocities. In addition Aerts & Krisciunas (1996) suggest that, due to stellar rotation, toroidal corrections become important. These may be the cause for the large scatter in 2 in Table 10. High-resolution, high signal-to-noise spectra of the more rapidly rotating Dor stars with simultaneous photometry are necessary to test this hypothesis.
5 Theory
We have carried out a stability analysis of the pulsations to check whether the inferred evolutionary state of HD 209295 is consistent with its pulsational behaviour, and whether tidally induced oscillations are reasonable.
5.1 Stability analysis
We used the Warsaw-New Jersey stellar evolution and the NADROT pulsation codes to generate a series of models for HD 209295. We then investigated the pulsation modes for stability. The results for the model which best matches the parameters of HD 209295 (, log = 3.88, log = 1.10, log =4.03) are shown in Fig. 17.

The observed frequency domain of the Scuti pulsations of HD 209295 is very well reproduced. The unstable frequency range does not depend on , which is also consistent with the observations. Doradus modes are not driven in our models, as this currently requires a special treatment of convection (Guzik et al. 2000). In our computations we used the standard mixing-length convection theory and we ignored the Lagrangian perturbation of the convective energy flux when computing oscillations. Our attempts to reproduce the results by Guzik et al. (2000) concerning pulsational instability were unsuccessful, and we plan to study this matter in the future.
It is interesting to note that there are frequency regions in which damping is not as strong, and that they depend on . We performed these computations up to , and found that the trend is maintained. The and frequency regions coincide with the ones actually observed.
5.2 Tidal excitation
We investigated the possibility of tidally excited oscillations in HD 209295 by determining the amplitude of tidally induced radial-velocity variations using the expressions derived by Willems & Aerts (2001). We calculated both the free and the forced oscillations of a stellar model in the linear, adiabatic approximation. Since the amplitude may become quite large in the adiabatic approximation, we restricted ourselves to calculating the radial-velocity variations at orbital periods for which the relative differences between the forcing frequencies of the dynamic tides and the eigenfrequencies of the free oscillation modes are not too small (for details see Willems & Aerts 2001).
The resulting amplitudes of the tidally induced radial-velocity variations seen by an observer are displayed in Fig. 18 as a function of the orbital period. The companion mass is assumed to be which corresponds to an orbital inclination of 31.2 and to a rotational frequency between d-1 and d-1.

A high peak in the amplitudes is seen to occur near the observed orbital period of HD 209295. The peak results from the resonant excitation of the modes and by the dynamic tides associated with the forcing frequencies and , respectively. Both tides are of spherical degree and azimuthal order . This result is quite encouraging, as a signal at was detected in the photometry, and one at was suspected. On the other hand, not all of the detected orbital harmonics are excited in the model, but they can be reconciled with linear combinations of these two signals.
We need to make several remarks here. Firstly, the above “solution” is probably not unique. In addition, the calculations have been performed using an adiabatic code, so they show the presence of the resonances, but not the real amplitudes. Secondly, attempts with lower companion masses (and thus lower rotational frequencies) were not very successful. This is interesting, as it may help to constrain the nature of the orbital companion of HD 209295.
We conclude that resonant excitation is possible, but for precise results there are still too many degrees of freedom. The prospect of developing tides as a probing tool is a promise for future studies.
6 Conclusions and outlook
By means of 128 h of time-resolved high-resolution spectroscopic and 280 h of time-series photometric observations we have shown that HD 209295 is not only the first pulsating star to be a member of two classes (a Doradus as well as a Scuti star), but we have also discovered good evidence for the presence of tidally excited pulsation modes. The binary companion is probably a neutron star or a white dwarf.
These findings make HD 209295 a rather interesting astrophysical laboratory. We were able to confront photometric and spectroscopic mode identification methods. Whereas the method by Telting & Schrijvers (1997) yielded reasonable assignments for the two independent modes dominating the photometry (both are ), analysing the photometric colour amplitude ratios and phase differences did not yield any meaningful results. The necessity of using as many mode identification methods as possible to secure reliable results is stressed.
We showed that the presence of tidally induced modes can be explained by theoretical models, but not all the observations can be understood. It would be important to calculate more realistic models of tidal interaction.
We do not fully understand the wealth of information provided by the variations in HD 209295. Large coordinated efforts will be required for further progress as our data are already fairly extensive. Another multi-site photometric and spectroscopic campaign on an even larger scale would be desirable. This should be carried over a long time base in order to resolve the Dor pulsations, and a large data set is needed to detect more Scuti modes. Large telescopes are required for the spectroscopy to obtain high time resolution and a high signal to noise ratio. This is necessary for identifying further modes and for detailed line-profile analysis. Photometric observations in more filters than previously obtained are necessary, perhaps extending the wavelength range into the near infrared. UV and infrared spectroscopy would be useful in a search for the companion star, and an abundance analysis may reveal an unusual chemical composition caused by the possible previous evolution of the system through mass transfer, common envelope and/or supernova stages.
ACKNOWLEDGEMENTS
We are indebted to Lisa Crause for obtaining and reducing the infrared photometry of HD 209295 at our request and for commenting on a draft version of this paper. DJJ and BW thank the British Particle Physics and Astronomy Research Council (PPARC) for post-doctoral research fellowships. DJJ would also like to acknowledge the continued positive influences of Mrs J Pryer, for much love and support during this work, and the Royal Society for a European research grant. ERC thanks S. Potter, D. Romero and E. Colmenero for their support. AAP would like to thank L. A. Balona and the staff of the SAAO (Cape Town) for their hospitality during his visit to the institute. BW is grateful to Antonio Claret for providing a 1.8 stellar model. GH thanks Darragh O’Donoghue for giving him one night of his observing time for this project and Detlev Koester for providing white dwarf model atmospheres. GH also wishes to express his gratitude to several colleagues for helpful comments: Brian Warner, Marten van Kerkwijk, Matt Burleigh and Stephen Potter. Ennio Poretti and Kevin Krisciunas are thanked for commenting on a draft version of this paper.
References
- [] Aerts, C., Kaye, A. B., 2001, ApJ 553, 814
- [] Aerts, C., Krisciunas, K., 1996, MNRAS 278, 877
- [] Balona, L. A., 2000, MNRAS 318, 289
- [] Balona, L. A., Evers, E. A., 1999, MNRAS 302, 349
- [] Balona, L. A., et al., 1996, MNRAS 281, 1315
- [] Baranne, A., et al., 1996, A&AS 119, 373
- [] Barker, E.S., Evans, D.S., Laing, J.D., 1967, Roy. Obs. Bull. No. 130
- [] Bedding, T. R., et al., 2002, in Radial and Nonradial Oscillations as Probes of Stellar Physics, ed. C. Aerts et al., ASP Conf. Ser., in press
- [] Breger, M., 1975, in IAU Symposium No. 67, Variable Stars and Stellar Evolution, eds. V. Sherwood & L. Plaut (Dordrecht: Reidel), p. 231
- [] Breger, M., Montgomery, M. H., 2000, Delta Scuti and Related Stars, ASP Conference Series, Vol. 210
- [] Breger, M., Hutchins, J., Kuhi, L. V., 1976, ApJ 210, 163
- [] Breger, M., et al., 1993, A&A 271, 482
- [] Carter, B. S., 1990, MNRAS 242, 1
- [] Claret, A., 1999, A&AS 131, 395
- [] Claret, A., 2000, A&A 363, 1081
- [] Claret, A., Giménez, A., Cunha, N. C. S., 1995, A&A 299, 724
- [] Claret, A., Cunha, N. C. S., 1997, A&A 318, 187
- [] Crawford, D. L., 1979, AJ 84, 1858
- [] Cunha, M. S., Gough, D. O., 2000, MNRAS 319, 1020
- [] De Cat, P., 2001, PhD thesis, Katholieke Universiteit Leuven
- [] Drilling, J. S., Landolt, A. U., 2000, in Allen’s Astrophysical Quantities, 4th edition, ed. A. N. Cox, Springer Verlag, p. 392
- [] Eggleton, P., 1983, ApJ 268, 368
- [] ESA, 1997, The Hipparcos and Tycho catalogues, ESA SP-1200
- [] Eyer, L., Grenon, M., 1998, in New Eyes to See Inside the Sun and Stars, eds. F. L. Deubner et al., p. 291
- [] Feast, M. W., Carter, B. S., Roberts, G., Marang, F. Catchpole, R. M., 1997, MNRAS 285, 317
- [] Garrido, R., 2000, in Delta Scuti and Related Stars, eds. M. Breger and M. Montgomery, ASP Conf. Ser. 210, p. 67
- [] Gilmore, G. F., Zeilik, M., 2000, in Allen’s Astrophysical Quantities, 4th edition, ed. A. N. Cox, Springer Verlag, p. 493
- [] Glass, I. S., 1973, MNRAS 164, 155
- [] Gough, D. O., 2000, in Recent Insights into the Physics of the Sun and Heliosphere, Proc. IAU Symp. 203, p. 1
- [] Gray, R.O., 1998, AJ 116, 482
- [] Gray, R.O., Corbally, C.J., 1994, AJ 107, 742
- [] Grenier, S., Burnage, R., Faraggiana, M., Gerbaldi, M., Delmas, F., Gómez, A. E., Sabas, V., Sharif, L., 1999, A&AS 135, 503
- [] Guzik, J. A., Kaye, A. B., Bradley, P. A., Cox, A. N., Neuforge, C., 2000, ApJ 542, L57
- [] Handler, G., 1999a, MNRAS 309, L19
- [] Handler, G., 1999b, IBVS 4817
- [] Handler, G., Shobbrook, R. R., 2002, MNRAS, submitted
- [] Handler, G., et al., 1997, MNRAS 286, 303
- [] Handler, G., et al., 2000, MNRAS 318, 511
- [] Houk, N., Cowley, A. P., 1975, Michigan Spectral Catalogue, Vol. 1
- [] Kaye, A. B., Handler, G., Krisciunas, K., Poretti, E., Zerbi, F. M., 1999a, PASP 111, 840
- [] Kaye, A. B., Henry, G. W., Fekel, F. C., Hall, D. S., 1999b, MNRAS 308, 1081
- [] Kaye, A. B., et al., 1999c, AJ 118, 2997
- [] Kjeldsen, H., Bedding, T. R., Viskum, M., Frandsen, S., 1995, AJ 109, 1313
- [] Koen, C., Van Rooyen, R., Van Wyk, F., Marang, F., 1999, MNRAS, 309, 1051
- [] Kosovichev, A. G., Severnyj, A. B., 1983, Pis’ma v Astronomicheskii Zhurnal 9, 424
- [] Kumar, P., Ao, C. O., Quataert, E. J., 1995, ApJ 449, 294
- [] Kurtz, D. W., Martinez, P., 2000, Baltic Astronomy 9, 253
- [] Kurucz, R. L., 1991, Van Vleck Obs. Contr. 11, 27
- [] Martinez, P., Koen, C., 1994, MNRAS 267, 1039
- [] Montgomery, M. H., O’Donoghue, D., 1999, Delta Scuti Star Newsletter 13, 28 (University of Vienna)
- [] Moran, E. C., Helfand, D. J., Becker, R. H., White, R. L., 1996, ApJ 461, 127
- [] Morris, S. L., 1985, ApJ 295, 143
- [] NASA-ESA, 1999, Merged Log of IUE observations, available online from http://vizier.u-strasbg.fr/cgi-bin/VizieR, catalogue No. VI/99
- [] Pamyatnykh, A. A., Dziembowski, W. A., Handler, G., Pikall, H., 1998, A&A 333, 141
- [] Press, W. H., Teukolsky, S. A., 1977, ApJ 213, 183
- [] Rodriguez, E., Breger, M., 2001, A&A 366, 178
- [] Rodriguez, E., López-González, M. J., López de Coca, P., 2000, A&AS 144, 369
- [] Shobbrook, R. R., 2000, JAD 6, 4E
- [] Sperl, M., 1998, Master’s Thesis, University of Vienna
- [] Telting, J. H., Schrijvers, C., 1997, A&A 317, 723
- [] Terman, J. L., Taam, R. E., Savage, C. O., 1996, MNRAS 281, 552
- [] Thompson, G. I., Nandy, K., Jamar, C., Monfils, A., Houziaux, L., Carnochan, D.J., Wilson, R., 1978, Catalogue of stellar ultraviolet fluxes (TD1), The Science Research Council, United Kingdom
- [] Tokunaga, A. T., 2000, in Allen’s Astrophysical Quantities, 4th edition, ed. A. N. Cox, Springer Verlag, p. 151
- [] Twarog, B. A., 1980, ApJS 44, 1
- [] Voges, W., et al., 1999, A&A 349, 389
- [] Voges, W., et al., 2000, IAUC 7432
- [] Watson, R. D., 1988, Ap&SS 140, 255
- [] Willems, B., Aerts, C., 2001, A&A, submitted
- [] Zahn, J.-P., 1977, A&A 57, 383
- [] Zerbi, F. M., et al., 1997, MNRAS 290, 401