Energy dependence of a Low Frequency QPO in GRS 1915+105
We analyze a set of three RXTE Target of Opportunity observations of
the Galactic microquasar GRS +, observed on April 2000, during a
multi-wavelength campaign.
During the three observations, a strong, variable low frequency ( Hz)
quasi periodic oscillation (hereafter QPO), often referred to as the
ubiquitous QPO, is detected together with its first harmonic.
We study the spectral properties of both features, and show that :
1) their frequency variations are better correlated with the soft X-ray flux
( keV), favoring thus the location of the QPO in the accretion disk;
2) the QPO affects more the hard X-rays,
usually taken as the signature of an inverse compton scattering of the soft
photons in a corona;
3) the fundamental and its harmonic do not behave in the same manner:
the fundamental sees its power increase with the energy up to 40 keV,
whereas the harmonic increases up to keV.
The results presented here could find an explanation in the context of the
Accretion-Ejection Instability, which could appear as a rotating spiral
or hot point located in the disk, between its innermost edge and the
corotation radius.
The presence of the harmonic could then be a signature of the
non-linear behavior of the instability.
The high-energy ( keV) decrease of the fundamental would favor
an interpretation where most or all of the quasi-periodic modulation
at high energies comes, not from the comptonized corona as usually
assumed, but from a hot point in the optically thick disk.
Key Words.:
Quasi Periodic Oscillations - Microquasar - X-Ray observation - Stars : individual GRS 1915+105(rodrigue@discovery.saclay.cea.fr)
1 Introduction
X-ray binaries exhibit strong
X-ray emission, from the soft ( ) to the hard X-rays (up to a
few hundred keV), sometimes up to the MeV domain. The emission processes are
thought to occur in the close
vicinity of a stellar-mass compact object (either a Neutron Star or a Black
Hole), the soft part of the spectrum being usually taken as the thermal
emission of an
accretion disk, whereas the hard part is thought to be the manifestation of an
inverse compton
scattering of the soft photons, with relativistic electrons present in a
hot coronal medium.
The sources may be distinguished by several characteristics, such
as the companion mass, whenever this latter is known, the shape of their
spectra, or by the presence of strong collimated ejecta.
In the latter case, the similarity with AGN led to the definition of
microquasars (Mirabel et al. , 1992), some of them
known to be sources with superluminal jets (Mirabel & Rodríguez, 1999).
GRS + has first been discovered as a Soft X-ray Transient by WATCH on board
GRANAT
(Castro-Tirado et al. , 1992), and then identified as the first Galactic source
to have ejections with apparent superluminal motion (Mirabel & Rodríguez, 1994).
The distance to the source has been estimated to 12.5 kpc, its inclination
, and the velocity of the jet 0.92c (Mirabel & Rodríguez, 1994).
Since then, the source has been observed with many X-ray satellites, and
its spectrum is typical of that of Black Hole Candidates (BHC), such as
GRO J–. Only recently, however, the spectral type of the companion has been
identified as a K–M III star (Greiner et al. , 2001), classifying the source
as a low mass X-ray binary. The mass of the primary has been estimated to
(Greiner, Cuby & McCaughrean, 2001), confirming the
black hole nature of the compact object.
With the launch of the Rossi X-ray Timing Experiment (RXTE), and the excellent
timing capacities of both its pointed instruments, the Proportional Counter Array (PCA) and the High Energy X-ray Timing
Experiment (HEXTE), many X-ray Binaries and GRS + in particular, have been
discovered to exhibit Quasi Periodic Oscillations (QPOs), in several
ranges of frequency (a few mHz up to hundred, and kilohertz in the case of
neutron star primary). Though no physical explanation has yet been widely
accepted, the QPOs are thought to occur in the close vicinity of the
compact object.
Furthermore, it has been pointed out by Psaltis et al. (1999), that the QPOs
could represent the same type of variability in both neutron stars and black
hole systems, constraining the theoretical models, and giving important
clues to the physics of these phenomena.
In particular the study of QPOs should give important informations on the
accretion flow, and thus on the physics of the disk.
The detection of several types of QPOs can be attributed to
different mechanisms, depending in particular on the source spectral state.
We will only focus here on the strong QPO, present during
the low/hard spectral state of GRS +, often called “ubiquitous”, since
it is nearly always
present in that state and often observed in other Black Hole Binaries
(e.g. XTE J–, or GRO J–).
In that case, several authors have pointed out correlations between
the frequency of the oscillations and some of the spectral
parameters, such as the flux (Swank et al. , 1997; Markwardt et al. , 1999), the
temperature of the disk (Muno et al. , 1999), and
the disk color radius (Rodriguez et al. , 2002).
All these correlations constrained the location of the QPO in or close to
the disk, and the systematic study of the QPO parameters should lead
to a better understanding of the accretion and ejection mechanisms, thought
to occur in this region.
Recently a new mechanism has been proposed by Tagger & Pellat (1999), to
extract energy and angular momentum from the inner regions of the disk
(permitting, thus the accretion) and transport them toward the corotation
radius of the spiral wave formed in the disk, where they can be emitted
directly toward the corona
(Tagger & Pellat, 1999; Varnière & Tagger, 2001).
It has been shown by Rodriguez et al. (2001), and Varnière et al. (2002)
, that this model could explain
the different frequency vs. radius correlations observed in GRO J– compared to
GRS + or (as had been found by Sobczak et al. , 1999) XTE J–.
This model could also explain the correlations found by Mirabel et al. (1998),
Eikenberry et al. (1998), Ueda et al. (2002, our observations being part of this
latter work)
during the min cycle (Tagger, 1999 for a possible scenario), between
X-ray light curves and the infrared and radio emissions, considered as the
synchrotron signatures of an expanding ejected blob of material, relating then
the energy needed to accelerate those blobs,
to the one extracted from the accretion.
| Date | MJD | Obs Id | Interval | Time start (UT) | Time stop (UT) | PCUs “On” |
|---|---|---|---|---|---|---|
| 04 17 2000 | ||||||
| 04 22 2000 | ||||||
| 04 23 2000 | ||||||
We present here observations of the source taken as a RXTE Target of Opportunity, in April 2000. In section 2 we present the data reduction and analysis methods used; in section 3, we examine the first of the three observations, which is the most variable one, and focus then on the dynamical properties of the source, observed in different energy ranges. In section 4 we study the data of the following observations, where the source is much more steady, and thus, more adapted to extract the QPO parameters with high accuracy; we will interpret our observations in the last part of this paper.
2 Data reduction and analysis
The source has been observed on April , and , 2000
as a target of opportunity.
We have reduced and analyzed the processed data
using the FTOOLS package (update 5.04).
Observations IDs, exact time intervals, and dates
are shown in table 1.
We first extracted, for the three observations, lightcurves covering the entire
PCA energy range, from binned data with s = ms resolution,
and event data with s = s, which were rebinned
during the extraction process to ms.
In all cases, lightcurves were extracted from all the PCUs that were
simultaneously turned “on” over a single interval (i.e. 5 on Apr. ,
and first interval, four during the two following intervals
that day, and three on Apr. ). We combined all PCUs and all layers
to get the most possible incoming flux. The exact PCA configuration over
each interval is given in table 1.
“Good Time Intervals” (GTIs) were defined when the
elevation angle was above , the offset pointing less than
, and we also excluded the data taken while crossing the SAA.
Background lightcurves were generated using the PCABACKEST tool, from
standard2 data, and subtracted from the raw lightcurves.
We then generated power spectra and dynamical power spectra (hereafter DPS)
using POWSPEC 1.0, calculating each FFT over s time intervals (2048
bins in each intervals), and averaging then the result over 4 intervals.
The resultant DPS has a resultant time bin s, comparable to the time
resolution of the standard 2 lightcurves.
To follow the evolution of the QPOs parameters with the energy, we
extracted, in the same standard way, lightcurves in five PCA energy channels:
absolute channel (in Matrix epoch4 corresponding to keV),
channel ( keV), channel ( keV),
channel ( keV), channel ( keV).
We then produced DPS and power spectra, as explained above, in each energy
range.

3 First Observation : on April
We extracted from both instruments standard lightcurves with 16 s
time resolution, using the standard PCA and HEXTE reduction steps, for this
observation; they are plotted on figure 1.
The source is in a state as defined by Belloni et al. (2000).
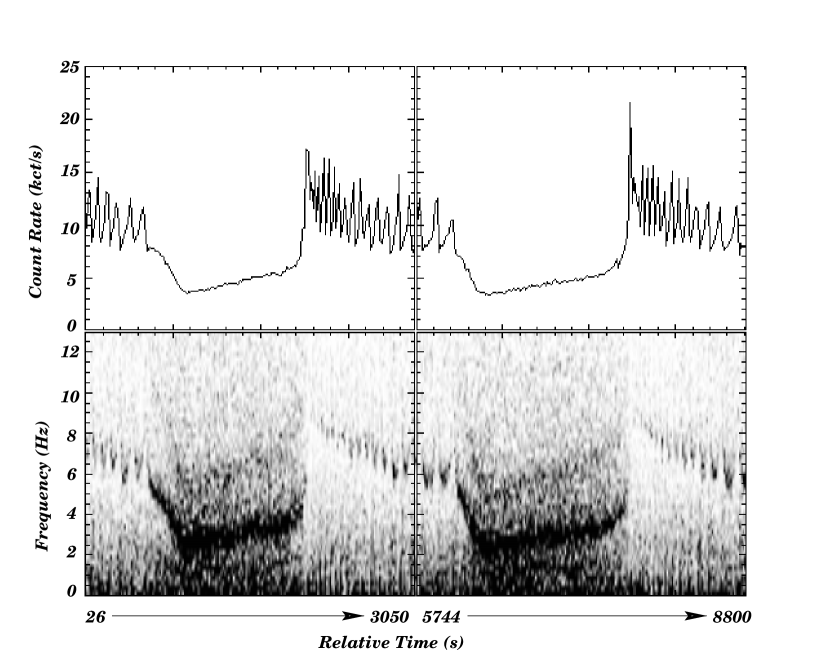
PCA dynamical power spectra, covering the entire PCA energy range (
), are shown
on figure 2 together
with the PCA lightcurves.
The source presents large flux variations on short
time scales ( s), together with a single QPO whose frequency has a
similar behavior (figure 2). Then around time s
(first interval), and s (second), a
large s dip occurs (figure 1). During that time,
the QPO frequency varies from Hz to Hz, and a strong
second QPO appears with a frequency twice that of the fundamental,
following
the same frequency variations (figure 2).
Then around relative time 2032 s (first interval), and 7716 s (second interval)
, a sudden and large soft X-ray spike, reaching
(respectively ) the dip minimum flux, for
the first (respectively second) interval, occurs and the source returns to a
state similar to the one before the dip. Here the harmonic disappears, while
the fundamental returns to a larger frequency and behaves as before the dip.
In addition we show in fig. 3, DPS in the five energy ranges defined in section 2, together with the corresponding lightcurves. One can immediately see that above 20 keV the harmonic is absent or very faint, and that above 40 keV (probably due to the high noise) the QPO disappears.
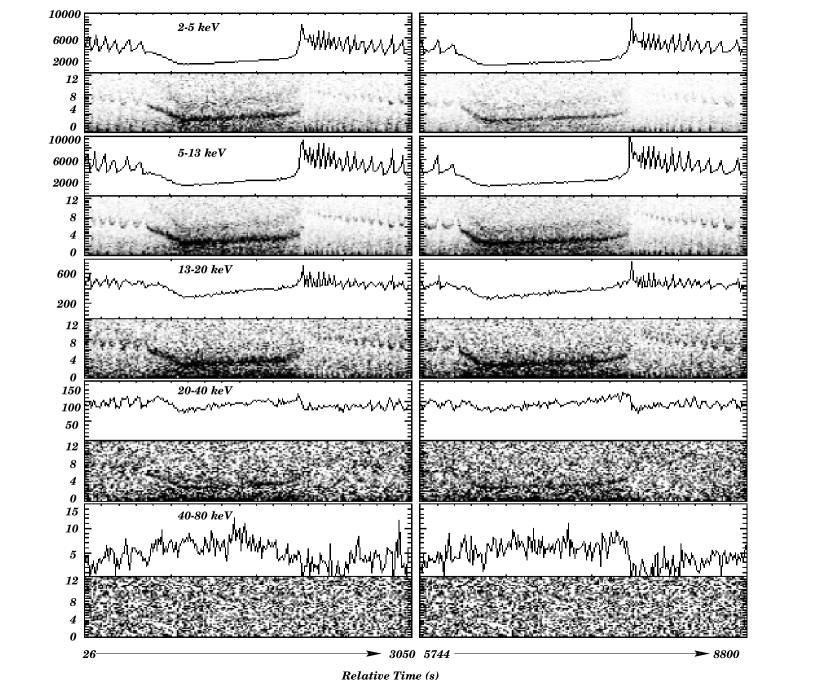
We also see on figure 3 the evolution of the flux
variations with the energy; the large dip seems to be smoothed with the energy.
We extracted from the soft lightcurves the relative time and the value of the
flux of the peak occuring just before the dip (relative time s, for
the first interval, and , for the second one); we then re-did the same
procedure for the minimum of the dip (relative time s for the first
interval, and s for the second one), and we thus could estimate
the relative amplitude of the variation of the flux, at the time where, also,
the fundamental QPO sees its frequency varying from 9 to 2.25 Hz.
We did this in each energy range, at the same times
(allowing a maximum of two bins ( s) of difference between each
range). Results are shown in table 2.
| Energy Range (keV) | Variation Rate Interval # () | Variation Rate Interval # () |
|---|---|---|
| – | ||
| – | ||
| – | ||
| – |
Note that the soft spike corresponds in the higher energy range (above 20 keV) to a sudden decrease of the flux, indicating the cooling, or the disappearance of a part of the corona (multi-wavelength results can be found in Ueda et al. , 2002 ).
4 Second and Third Observation : April and
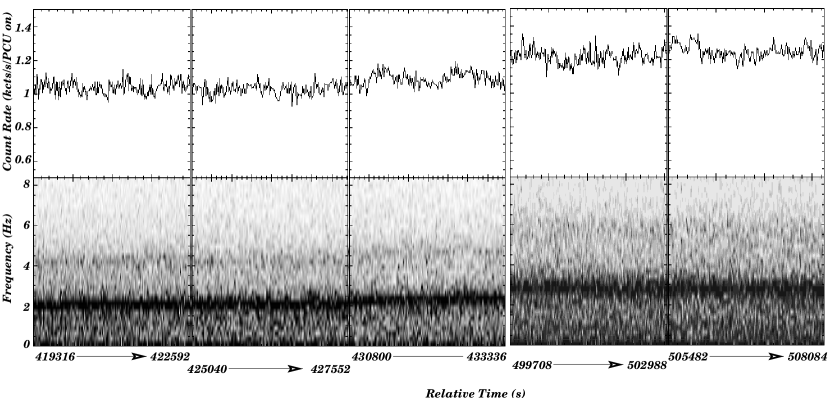
As the lightcurves and dynamical power spectra did not present variations as strong as on the previous date, we did not focus here on the dynamical evolution of the QPO, but we just tried to correlate the QPO parameters with the energy range. Figure 4 shows the lightcurves with the dynamical power spectra from all the GTIs of both observations. The source is in a state of Belloni et al. , 2000, characterized by a steady flux.
Power spectra covering the entire PCA range,shown on figure 5, are fitted with a model consisting of two broad lorentzians (continuum) , plus sharper ones, modeling the QPO features. When the presence of the QPOs was not obvious, we estimated the parameters by freezing the lorentzian centroid frequency to the value found in the other energy ranges, and allowing both the width and the power to vary. In the case of the keV range, since the statistics from single interval was poor, we choosed to merged the observations were the QPO frequency was found to be close, i.e. intervals and from April 22, and intervals and from April 23; interval from April 22 was fitted alone. Results from the fits for all the energy ranges defined in section 2 are shown in table 3.

No variations similar to those of April 17 are present here; the flux remains
fairly constant around a mean value 1050 cts/s/PCU-on, for the April 22 two
first intervals, rising slowly to cts/s/PCU-on, for the April 22
third interval, and reaching cts/s/PCU-on, on April 23.
As expected, in the same time intervals the fundamental QPO sees its frequency
slowly increase with time from
Hz (on Apr. 22) to Hz (on Apr. 23) (figure
4, and table 3). The harmonic is still
present during the five intervals, with a frequency varying from Hz
(on Apr. 22), to Hz on April 23 first interval.
We plotted in figure 7 the evolution of the QPO power
vs. energy range for the five GTIs.
The upper points represent the behavior of the
fundamental QPO, and the lower that of the harmonic; we can see that
the power of the fundamental increases up to keV, and them seems to
decrease, whereas that of the harmonic seems to peak between the
and keV ranges.

Figure 6 represents the evolution of the QPOs width vs. their frequencies. Both distributions of points can be well fitted by lines of slopes for the fundamental, and for the harmonic. The zero abscissa values are found to be for the fundamental, and for the harmonic (although their physical meaning is not clear) . It is clearly visible on the plot that both QPOs are tightly correlated, the width of the harmonic being twice that of the fundamental (resulting thus in a Q value () similar for both).
5 Results and Interpretation

The April 17 observation confirms and expands the conclusion of
Markwardt et al. (1999) and Muno et al. (1999), that the QPO frequency is
better correlated with the soft flux, but seems stronger in the higher
energy bands (which is confirmed by the following dates).
In addition a precise study of the lightcurve of the same date shows
that the min dips are smoothed with the energy, and that the
sudden increase of the soft flux (the spike) is anti correlated with
the hard flux; indeed the spike, in both interval, corresponds to a
major decrease of the flux in the keV, and keV bands,
usually considered to be emitted by the corona.
The soft spike marks here the transition from the low hard state (C
state of Belloni et al. , 2000), to a soft high state (A-B states). Within the
interpretation in terms of disk states, this transition and the rapid
variations following (interpreted as rapid transitions through A B C states
(Belloni et al. , 2000)) can be seen as a succession of rapid replenishments
and disappearances of the innermost parts of the disk (Belloni et al. , 1997).
The behaviour of the corona may appear difficult to understand,
since the abrupt cutoff of the hard X-rays could either be the
manifestation of a sudden cooling of the relativistic electrons by the
re-emergence of a high soft flux, or the disappearance of the corona
(by advection or ejection).
Thanks to a large number of multi-wavelength observations, the radio and
infra red behaviors of GRS + have now been widely studied for years.
In particular, former studies such as the one presented in Mirabel et al. , 1998,
or Eikenberry et al. ,
1998 had linked the soft X-ray spike (transition from low hard to soft high
state) with radio and infra red flares. Dhawan et al. (2000)
have shown that indeed superluminal ejections took place during abrupt change
in the X-ray state of the source. More recently, Klein-Wolt et al. (2001)
have found a strong correlation between radio events (radio oscillations,
compact jets, large radio flares), and state C properties (duration,
transition to other states). It is, however, to be noted that Klein-Wolt et al. , did not find any simultaneous radio - alpha state observations.
Furthermore, “The Largest Multi-wavelength Campaign” on GRS + presented in
Ueda et al. (2002), shows that the state transitions on Apr. are
followed by radio flares consistent with an ejection of material starting at
the state transition. This leads us to suggest that the abrupt cutoff
of the hard X-rays is more probably related to the disappearance of a part of
the corona, blown away under the form of a synchrotron emitting blob of
material detected in the infra red, and radio domains
(fig. 1 and 2 in Ueda et al. , 2002).
On the other hand, the behavior of the QPO and its harmonic at high
energies poses severe constraints on theoretical models. The
decrease of the QPO power above keV may indicate that not all the
corona is affected. The decrease of the harmonic above keV
also raises very challenging questions.
These could find an explanation in the context of the
Accretion-Ejection Instability (Tagger and Pellat, 1999), which has
been shown to form a rotating spiral structure in the disk, similar to
galactic ones but driven by magnetic stresses rather than by
self-gravity. The spiral arms should be expected to heat as well as
compress the gas in the disk, and thus to appear as a rotating spiral
or hot spot. The harmonic would then be a signature of the
non-linear behavior of the spiral, just as the gas form shocks (and
thus strong harmonics of the underlying 2-armed spiral) along galactic
spiral arms. The high-energy cutoff of the fundamental could, then, favor
an interpretation where most or all of the quasi-periodic modulation
at high energies comes, not from the comptonized corona as usually
assumed, but from a hot point in the optically thick disk. This would
be consistent with the previous result (Rodriguez et al. , 2001; Rodriguez
et al. , 2002) that
the anomalously small color radius of the disk, often observed in some
Black-Hole Binaries, could actually be interpreted by the black-body
emission of a small area hot point in the disk.
We could in principle have an estimate of its physical size,
by adding a blackbody model in the spectral fits (such as the BBODYRAD model of XSPEC), one of the parameters being the normalized area
of the emitting region, (since the black body luminosity is proportionnal to
the area). But the limited sensitivity and spectral resolution of the present
data do not allow any realistic fit. We expect that future instruments will
provide better constraints on this problem .
It would be very tempting to consider the width of the QPO as a measure
of the size (due for example to the differential rotation acting between
the inner and outer edges of the spot). But the fact that we are dealing with a
QPO probably rules out this explanation, since it has to result from a
quasi-stationary feature in the disk. This is precisely the case for the AEI,
where a standing spiral wave results in a quasi-stationary feature rotating
at a single frequency. In this context the width of the QPO would correspond
to the coherence time of this pattern, fixed either by non-linear effects or
by variations in the background disk equilibrium, e.g. the inner disk
radius or other disk parameters (temperature, magnetization, etc.)..
The spot physical properties (e.g. its temperature) may also depend on a number
of external parameters, hard to deduce from the observations, such as
the ratio (the ratio between thermal and magnetic pressure),
which drives the instability (see for example Varnière et al. , 2002, for a
discussion on the effects of this parameter), or even the efficiency of the
instability. Indeed, in a non linear regime for example, the amount of
energy deposited in the disk (under the form of shocks) would be much greater,
and would locally warm it up much more than in the linear case.
Further observational and theoretical work should, however, allow to test this
hypothesis: by producing, from numerical simulations of the
instability (such as Caunt and Tagger, 2001), synthetic light curves
of the QPO, and by fitting the observed energy dependence of the
modulated light curve by a high-temperature, hotter black body over a
small area of the disk rather than the usual power-law of the coronal
emission.
Acknowledgements.
The authors would like to thank S. Corbel, M. Muno, P. Varnière, T.Foglizzo, and the anonymous referee for usefull discussions and comments which allowed to improve the quality of the paper.IFM acknowledges partial support from Fundacíon Antorchas.
We also thank the Athena help at GSFC for appreciable help on the RXTE data reduction processes.
This research has made use of data obtain through the High Energy Astrophysics Science Archive Center Online Service, provided by the NASA/Goddard Space Flight Center.
References
- [1] Belloni, T., Méndez, M., King, A.R., van der Klis, M., van Paradijs, J., 1997, ApJ, 479, L145.
- [2] Belloni, T., Klein-Wolt, M., Méndez, M., van der Klis, M. and van Paradijs, J., 2000, A&A, 355, 271.
- [3] Castro-Tirado, A., Brandt, S., Lund, N., Lapshov, I., Sunyaev, R. A., Shlyapnikov, A. A., Guziy, S.& Pavlenko, E.P., ApJS, 92, 469, 1994.
- [4] Caunt, S. E., Tagger, M., 2001, A&A, 367, 1095.
- [5] Dhawan, V., Mirabel, I. F., Rodr guez, L. F., 2000, ApJ, 543, 373.
- [6] Eikenberry, S. S., Matthews, K., Morgan, E. H., Remillard, R. A., Nelson, R. W., 1998, ApJ, 494L, 61.
- [7] Greiner, J., Cuby, j. G., McCaughrean, M. J., Castro-Tirado, A. J., Mennickent, R. E., 2001, A&A 373L, 37.
- [8] Greiner, J., Cuby, j. G., McCaughrean, M. J., 2001, Nature, 414, 522.
- [9] Klein-Wolt, M., Fender, R.P., Pooley, G.G., Belloni, T., Migliari, S., Morgan, E.H., van der Klis, M., 2001 MNRAS in Press (astro-ph/0112044).
- [10] Markwardt, C. B., Swank, J. H., Taam, R. E., 1999, ApJ, 513, 37.
- [11] Merloni, A., Fabian, A. C., and Ross, R. R., 2000, MNRAS 313, 193 (MFR).
- [12] Mirabel, I. F., Rodriguez, L. F., Cordier, B., Paul, J., Lebrun, F., 1992, Nature, 358, 215.
- [13] Mirabel, I. F., & Rodríguez, L. F., 1994, Nature,371, 46.
- [14] Mirabel, I. F., Dhawan, V., Chaty, S., Rodriguez, L. F., Marti, J., Robinson, C. R., Swank, J., and Geballe, T., 1998, A& A 330, L9.
- [15] Mirabel, I. F., & Rodríguez, L. F., Annu. Rev. Astron. Astrophys., 37, 409, 1999.
- [16] Morgan, E. H., Remillard, R. A., Greiner, J., 1997, ApJ, 482, 1086.
- [17] Muno, M. P., Morgan, E. H., and Remillard, R. A., 1999, ApJ, 527, 321.
- [18] Psaltis, D., Belloni , T., van der Klis, M., 1999, ApJ, 526, 262.
- [19] Rodriguez, J., Varnière, P., Tagger, M., Durouchoux, P., proceedings of the Third Microquasar Workshop: Granada Workshop on galactic relativistic jet sources, Eds A. J. Castro-Tirado, J. Greiner and J. M. Paredes, Astrophysics and Space Science, of the microquasar workshop, Granada (Spain), 2001 (astro-ph/0010635).
- [20] Rodriguez, J., Varnière, P., Tagger, M., Durouchoux, P., 2002, accepted in A&A.
- [21] Sobczak, G. J, McClintock, J. E., Remillard, R. A., Cui, W., Levine, A. M., Morgan,E. H., Orosz, J. A., and Bailyn, C. D., 2000, ApJ, 531, 537 (SMR).
- [22] Swank, J., Chen,X., Markwardt,C., and Taam, R. , 1997, proceedings of the conference ”Accretion Processes in Astrophysics: Some Like it Hot”, held at U. Md., October 1997, eds. S. Holt and T. Kallman.
- [23] Tagger, M., and Pellat, R. , 1999, A& A, 349, 1003 (TP99).
- [24] Tagger, M., proceedings of the th Compton Symposium, Portshmouth (USA), 1999 (astro-ph/9910365).
- [25] Ueda, Y., Yamaoka, K., Sánchez-Fernández, C., Dhawan, V., Chaty, S., Grove, J.E., McCollough, M., Castro-Tirado, A. J., Mirabel, L. F., Kohno, K., Feroci, M., Casella, P., Trushkin, S. A., Castaneda, H., Rodriguez, J., Durouchoux, P., Swank, J. H., Kotani, T., Ebisawa, K., 2002, ApJ., in press.
- [26] Varnière, P., Tagger, M., Proceedings of the Gamma 2001 Symposium Baltimore MD, April 2001; N. Gehrels, C. Shrader, and S. Ritz, eds.
- [27] Varnière, P., Rodriguez, J., Tagger, M., 2002, accepted in A&A.
| Date | Energy range (keV) | (d.o.f.) | |||||||
|---|---|---|---|---|---|---|---|---|---|
| PCA∗ | |||||||||
| keV | |||||||||
| keV | |||||||||
| keV | |||||||||
| keV | frozen | ||||||||
| PCA | |||||||||
| keV | |||||||||
| keV | |||||||||
| keV | |||||||||
| keV | frozen | ||||||||
| Merged | keV | Frozen | |||||||
| PCA | |||||||||
| keV | |||||||||
| keV | |||||||||
| keV | |||||||||
| keV | Frozen | ||||||||
| keV | Frozen | ||||||||
| PCA | |||||||||
| keV | |||||||||
| keV | |||||||||
| keV | |||||||||
| keV | |||||||||
| PCA | |||||||||
| keV | |||||||||
| keV | |||||||||
| keV | Frozen | ||||||||
| keV | Frozen | ||||||||
| Merged | keV | Frozen |