Subaru Deep Survey II. Luminosity Functions and Clustering Properties of Ly Emitters at in the Subaru Deep Field 11affiliation: Based on data collected at Subaru Telescope, which is operated by the National Astronomical Observatory of Japan.
Abstract
We report on early results from very deep and wide-field narrow-band imaging on a 543 arcmin2 area of the Subaru Deep Field. We find 87 Lyman emitters (LAEs) at which are photometrically selected by a combination of two broad bands ( and ) and one narrow band (; Å, Å). We derive the luminosity functions (LFs) of the LAEs at Ly luminosity and at UV-continuum (rest-frame 1700Å) luminosity. The LFs show little evolution between z=3.4 and z=4.86 either in Ly or UV-continuum emission. The amplitude of the LAE LF tends to decline at the bright magnitudes more rapidly than that of the LBG LF at similar redshifts. We calculate the angular correlation function of our LAEs up to arcmin separations. The angular correlation is found to increase with decreasing angular separations, showing a clear signal of clustering. It is also found that the distribution of LAEs shows a large density gradient with a scale of arcmin, which would indicate the existence of a large-scale structure of LAEs on Mpc scales. We fit the observed correlation function by to find arcsec0.8. The estimated correlation length is Mpc in comoving units ( and ), which is slightly larger than the value for LBGs with . We calculate the angular correlation function for two sub-samples of the 87 LAEs divided by Ly luminosity, UV-continuum luminosity, and Ly equivalent width (). The Ly-bright sub-sample shows a larger correlation amplitude than the Ly-faint sub-sample, while no significant difference is found for the sub-samples divided by UV-continuum luminosity or . This may indicate that galaxies with bright Ly emission are possibly biased against the underlying dark matter halos more strongly than those with bright UV continuum.
1 INTRODUCTION
In the typical hierarchical clustering scheme of cold dark matter (CDM) models, sub-galactic clumps are formed from gravitational collapse of small initial density perturbations, and those clumps progressively merge and collapse to become galaxies of larger masses. Merging processes increase (decrease) the number density of bright (faint) galaxies, and enhance the clustering amplitudes of galaxies. The luminosity functions (LFs) and clustering properties of high- () galaxies are, thus, essential for understanding the galaxy formation. Recent observational efforts at optical wavelengths have revealed two major classes of high- galaxies which are suitable for studying LFs and clustering properties of distant galaxies.
One class of high- galaxies is Lyman break galaxies (LBGs; Steidel et al., 1996a) which are selected by their UV-continuum features redshifted to optical wavelengths 111 One can select high- galaxies by photometric redshift techniques (e.g., Connolly et al., 1995; Sawicki, Lin, & Yee, 1997; Fernández-Soto, Lanzetta, & Yahil, 1999; Furusawa et al., 2000; Fontana et al., 2000). However, since photometric redshift techniques also use essentially the Lyman break feature for selecting them, we refer to, for simplicity, those selected by photometric redshifts as LBGs throughout this paper. . Since LBGs are identified by their strong continuum break, they are generally limited to UV-continuum bright galaxies. Such bright high- galaxies can be well investigated. The LF of LBGs at (Steidel et al., 1999) has a larger than that of the local UV-selected galaxies (Sullivan et al., 2000), but its normalization, , is comparable within a factor of two for the LBGs and for the local galaxies (see also Lowenthal et al., 1997). The apparent size of LBGs at is - (kpc for and ) in a half light radius (Steidel et al., 1996b). LBGs at show stronger clustering than the underlying dark matter (Giavalisco et al., 1998; Ouchi et al., 2001a). A hint of mergers has been found for LBGs at (Ouchi et al., 2001a).
The other class of high-z galaxies is Lyman Emitters (LAEs) which are identified by their redshifted Ly emission with narrow-band imaging (Cowie & Hu, 1998; Hu, Cowie, & McMahon, 1998). LAEs are thus high- galaxies which have a relatively strong Ly emission whose rest-frame equivalent width, , is Å. Most of the detected LAEs tend to have fainter continua than LBGs (e.g., Cowie & Hu, 1998; Hu, Cowie, & McMahon, 1998; Steidel et al., 2000; Fynbo, Möller, & Thomsen, 2001). The estimated number density of LAEs down to is deg-2 per unit (Hu, Cowie, & McMahon, 1998; Rhoads et al., 2000). The size of LAEs at is as small as (kpc for and ) in a half light radius (Pascarelle, Windhorst, Keel, & Odewahn, 1996). An indication for a large scale structure formed by LAEs at has been reported by Pascarelle, Windhorst, & Keel (1998) from a combination of their three blank field surveys, although other blind searches have not found such clumpy distributions (Rhoads et al., 2000). Searches of LAEs on targetted fields have found strong clustering of LAEs around quarars (Campos et al., 1999; Møller & Fynbo, 2001; Stiavelli et al., 2001), radio galaxies (Venemans et al., 2002), high redshift clusters (Palunas, Francis, & Woodgate, 2000), and overdensities in the LBG distribution (Steidel et al., 2000).
Since LAEs are fainter and smaller than LBGs and some LAEs have strong clustering, it is possible that LAEs are dominated by sub-galactic clumps which subsequently form massive galaxies. Indeed, Pascarelle, Windhorst, Keel, & Odewahn (1996) have proposed that LAEs are sub-galactic clumps. If high- LAEs are dominated by sub-galactic clumps, the LF of LAEs is expected to show a steep decline toward the bright end. The clustering amplitude of LAEs should be larger than that of LBGs on small scales (kpc or ) where the correlation amplitude is sensitive to the fraction of merging galaxies.
In this paper, we report on luminosity functions and clustering properties of LAEs at , based on our deep () and wide-field (arcmin2) broad- and narrow-band imaging of the Subaru Deep Field. The unprecedentedly deep and wide-field imaging data enable us to investigate the LF of LAEs down to and the clustering properties up to Mpc scales in comoving units. Throughout this paper, magnitudes are in the AB system, and all calculations assume a -dominated spatially flat cosmology, , , and .
2 OBSERVATIONS AND DATA REDUCTION
As part of the Subaru Deep Field (SDF) project, deep and wide-field optical imaging of the SDF (, [J2000]) was carried out during the commissioning phase of Subaru Prime Focus Camera (Suprime-Cam; Miyazaki et al., 1998) in March to June, 2001 (Shimasaku et al. in preparation). We obtained -, -, -, -, - and a narrow-band (: centered at 7126Å) images of about a 600 arcmin2 area of the SDF 222 The central 4 arcmin2 region of SDF has ultra-deep and data (Maihara et al., 2001) . Figure 1a shows the transmittance of ,, and . The peak transmittance, central wavelength, and band width (FWHM) of are measured to be , Å, and Å, respectively. The errors indicate the rms measured at 13 positions evenly spaced over the surface of the filter. The data were reduced in the same manner as explained in Ouchi et al. (2001a). The final images cover a contiguous 543 arcmin2 area with a PSF FWHM of . The net exposure times of the final images are 210, 150, 90, 138, 81, and 162 minutes for , , , , , and , respectively. The limiting AB magnitudes are , , , , , and for a 3 detection on a diameter aperture. Source detection and photometry are performed using SExtractor version 2.1.6 (Bertin & Arnouts, 1996). The -band frame is chosen to detect objects, and we limit the object catalog to , in order to provide a reasonable level of photometric completeness.
3 PHOTOMETRIC SAMPLE OF LY EMITTERS
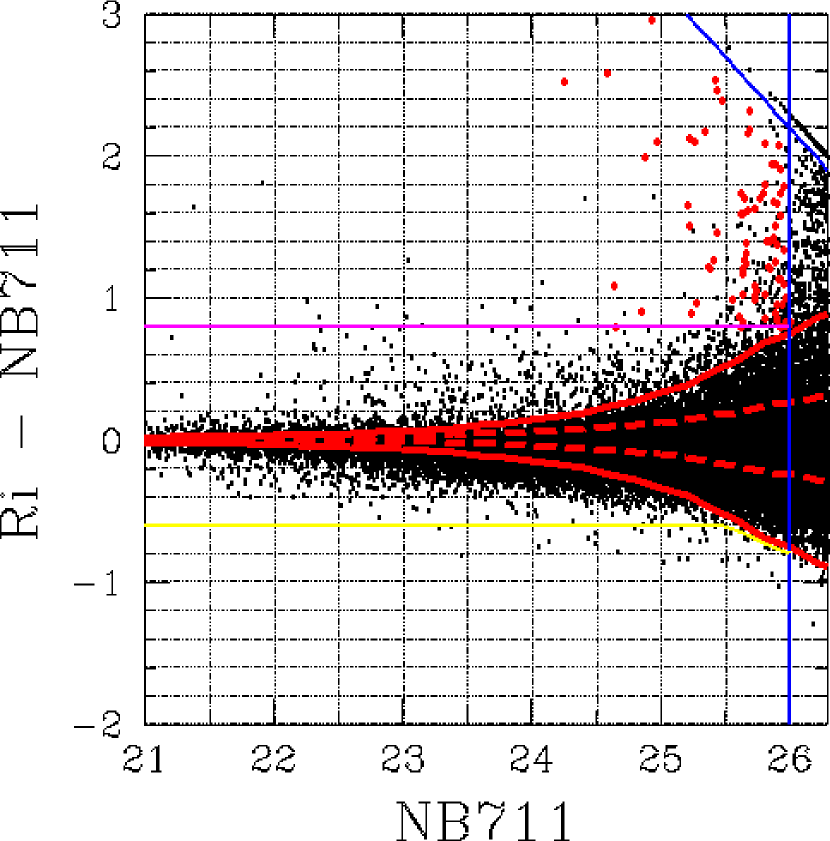
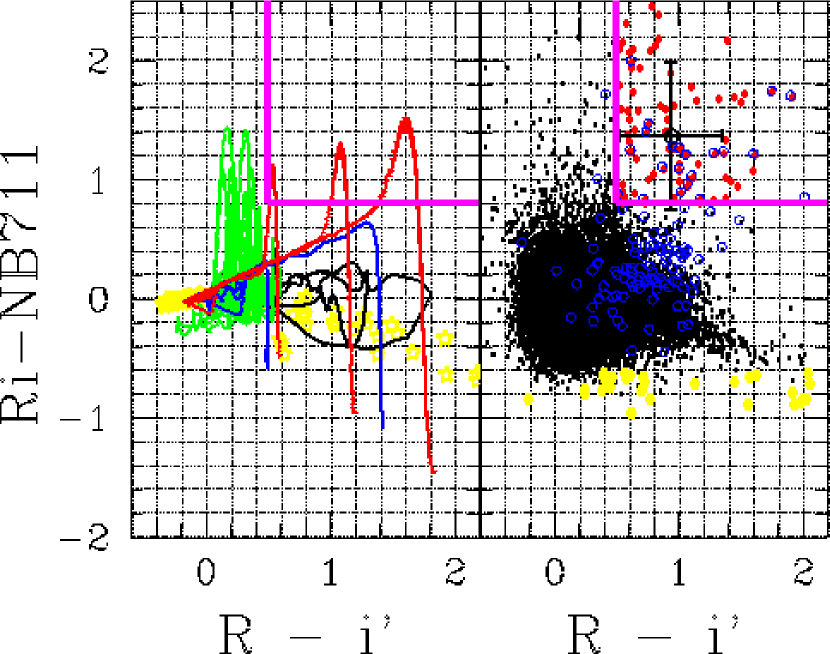
Our catalog contains 30,297 objects with in total. Figure 2 shows the color magnitude diagram of the detected objects. Since the band measures fluxes between the and bands (see Figure 1a), we define the off-band continuum flux of objects as . We determine the selection criteria which isolate LAEs at from foreground objects, on the basis of expectations from SEDs of model LAEs, foreground galaxies, and Galactic stars (left panel of Figure 3; see the figure caption for the details). We regard an object as a LAE when it satisfies the following selection criteria simultaneously,
| (1) | |||
| (2) | |||
| (3) |
The first criterion corresponds to an equivalent width () to be Å in the observed frame ( Å in the rest frame at ) 333 For simplicity, we calculate EW from alone, without correcting for color. . The second criterion rejects low- objects with strong emission lines of H, [OIII], and [OII] etc. Since the Ly continua of high- objects are absorbed by neutral hydrogen of the inter-galactic medium (IGM), -band fluxes are expected to be weaker than -band fluxes for objects. Figure 3 demonstrates that this criterion efficiently rejects low- emitters but selects galaxies whose IGM absorptions are stronger than 0.5 , where is the median opacity of the IGM given by Madau (1995). The third criterion is placed to reject break objects whose spectra have a spectral trough on the bluer side of the -band. This trough is misidentified as an emission feature by color. These three criteria collectively select LAEs at with a low contamination from low- interlopers.
There are a total of 87 objects that meet all the criteria simultaneously down to and , where is the limiting magnitude of the i’ band. The color criterion, , can be securely imposed on objects detected over a level in () by using their magnitudes or a upper limit (). Among the 87 selected objects, 62 objects brighter than have a secure limit. Remaining 25 () objects with have large errors in color, and thus the contamination by foreground objects will be higher than for the bright objects. However, in order to enlarge our sample, we do not remove these faint objects from our LAE sample, and insted estimate the contamination and completeness for the whole sample as a function of apparent magnitude on the basis of Monte Carlo simulations which take account of photometric errors. Our photometric sample of LAEs comprizes these 87 objects. These LAEs are shown by large red points in Figure 2.
In Figure 2, some objects seem to have absorption features at significant levels. We do not know the detail spectral features of those objects, but for simplicity we call those objects with absorption features ”absorbers”. We define as absorbers those having and (yellow line in Figure 2), and find 37 absorbers. We investigate the SEDs of the 37 absorbers from multi-color data. Fifteen objects show a good agreement with stellar spectra, and eight objects are consistent with late-type galaxies. However, the nature of the remaining fourteen objects is uncertain. Their spectra marginally agree with spectra of low- galaxies or Galactic objects. They may be variable objects and/or moving objects (such as Kuiper-belt objects). Future spectroscopic follow-up observations will reveal the nature of those objects 444Our on-going spectroscopic obaservations have revealed that one absorber is a galaxy with a very blue continuum and strong [OIII] emission lines in the -band.
We have estimated photometric contamination and completeness of the LAE sample. Since the sample construction is based on , , and images, we estimate the completeness and contamination by Monte Carlo simulations using real -,-, and -band images. To estimate the contamination, we generate objects that mimic all the detected objects with , and distribute them randomly on our original images after adding Poisson noises according to their original brightness. Then, we detect these simulated objects and measure their brightness. The contamination of our sample is defined by the ratio of the objects that did not pass the criteria in the original data but satisfy the criteria in the simulated data, to the number of all the original objects which passed the criteria. We iterate this process 10 times and estimate the ratio of contamination as a function of magnitude. We find the sample contamination to be 40%. We calculate the completeness of LAEs as a function of continuum () magnitude, not as a function of NB711 magnitude, since we want to derive the rest-frame UV-continuum luminosity function of LAEs (see section 4). We need to take two kinds of incompleteness into account; one is the incompleteness of -band detection, and the other is the incompleteness due to our sample being -limited. The latter incompleteness is equivalent to missing small- emitters of faint magnitudes 555 In terms of -dependent incompleteness, our -limited sample of LAEs may miss large- emitters of faint magnitudes, since the limiting magnitude of and for our sample selection is and . This implies that objects with will not be included in the sample at the faintest magnitudes (). Since we cannot determine a subsample which is complete in terms of emission luminosity, we do not calculate completeness as a function of emission luminosity in our analysis. . To estimate the completeness (the sum of the above two sources), we make a subsample composed of 45 LAEs with , whose continuum flux and (or color) are fairly accurately measured. This -limited subsample is essentially complete in terms of (or color). Assuming that the vs. color distribution found for the objects in this subsample is universal, i.e., irrespective of magnitude, we make a mock catalog of 360 () LAEs whose -band magnitudes are scaled from to into 0.5 magnitude bins. We perform Monte Carlo simulations with 360 artificial LAEs in the same manner as for the contamination estimation. We define here the completeness of LAE sample as the number of the simulated objects which again pass the selection criteria divided by all the original objects which passed the criteria. We repeat this simulation 100 times, and average the measured completenesses. The completeness weighted by the number of the detected objects are found to be 40% 666 These values of contamination and completeness include photometric errors only, and do not include any systematic errors. The systematic errors may be caused from (1)low- interlopers satisfying the selection criteria and (2)the photometric errors of input objects themselves by which the observed color distributions are wider than the real distributions in the vs. plane. More reliable contamination and completeness estimations can, however, be obtained only with spectroscopic follow-up observations.. When deriving the UV luminosity function in section 4, we correct the data for the contamination and completeness derived in this way. The completeness correction derived here is valid if the color distribution of LAEs does not change largely with apparent magnitude.
In order to examine how well eqs. (1)-(3) can select galaxies, we examine what fraction of LAEs satisfy continuum break selection criteria for LBGs. On the basis of expectations from GISSEL96 (Bruzual & Charlot, 1993) population synthesis models, we define the criteria for LBGs as , , and , which isolate galaxies from low- galaxies and Galactic stars ( Ouchi et al. in preparation; see also Ouchi et al., 2001b). Since most of our LAEs have faint continuum magnitudes (i.e., ), the number of LAEs to which the LBG selection criteria can be reliably applied is very limited. This is because the LBG selection criteria require very deep magnitudes relative to magnitudes. The limiting magnitudes of our data are in a level, and thus the LBG criteria can be safely applied only to galaxies brighter than . We have nine LAEs brighter than , and find that five out of the nine to pass the LBG criteria, implying that the contamination of our LAE sample by foreground objects is . This fraction of contaminants is consistent with that derived by the Monte Carlo simulations above. On the other hand, although we cannot make the same test to the remaining faint LAEs, we find that no object fainter than violates clearly (i.e., above 2 levels) the criterion, . From these tests, we conclude that statistical properties of LAEs can be reliably derived from our sample.
4 Luminosity Functions
We derive the luminosity function (LF) of LAEs in Ly and UV (rest-frame Å) luminosities, assuming that the surveyed volume is approximated by the box with the cross section of surveyed area and the depth corresponding to the ’s band width (i.e., FWHM). Figures 4a and 4b plot the Ly LF and UV LF, together with those of LAEs by Cowie & Hu (1998). Cowie & Hu (1998) selected all objects with observed equivalent width of Å (Å in the rest frame). Their criterion corresponds to () for LAEs, if the cosmological effects and the difference in absorption by IGM neutral hydrogen (Madau, 1995) at and are taken into account. In order to compare the LF at with that at , we make another sample for LAEs which is selected by the same criterion as of Cowie & Hu (1998) () from our all detected objects. We find that 234 objects satisfy this criterion. We show the LFs of these 234 objects by inverse open triangles in Figure 4. These LFs are not corrected for the sample contamination or completeness, and they are probably contaminated by low- emission-line galaxies, similar to Cowie & Hu’s (1998) LF for LAEs. Both LFs decline at the faint end due to incompleteness, which is not corrected.
In Figure 4a, we calculate the Ly luminosity from color and magnitude, correcting for the absorption by neutral hydrogen in IGM. A similar correction has been made to the LAE. Figure 4a shows that the Ly LF at is very similar to that at . No clear evolution is found between and within a factor 2-3. Note that both Ly LFs are likely to be highly contaminated by foreground low- emitters. The pure equivalent width selection applied to our data () finds 234 objects, while our color selection finds only 87 objects. This implys that as large as 60% of the galaxies contributing to the LF of LAEs in Figure 4a may be contaminants. A similarly large fraction of contaminants may be expected for the LF of LAEs. Thus, an actual uncertainty in our finding that no evolution is seen for LAEs between and 4.86 can be within a factor of 2-3, which is significantly larger than estimated from Figure 4a.
In Figure 4b, the 1700 Å continuum absolute magnitude is estimated from magnitudes 777 Most of the LAEs have PSF-like (FWHM) shapes. If the fluxes of PSF objects are measured with a circular aperture, they are fainter than the total magnitudes by 0.2mag. When deriving the luminosity function in Figure 4, we adopt as the total magnitude of a LAE. . Since the -band measures the flux at the rest-frame 1300Å for a galaxy, we add the median color, , of HDF galaxies ( mag; Furusawa et al., 2000) to all the magnitudes to estimate the magnitude at 1700Å. We calculate the best estimated LF of our original 87 LAEs satisfying eqs.(1)-(3) (filled squares), correcting for the contamination and completeness (section 3). No correction is applied to either the LF of LAEs (circles) or that of LAEs (inverse triangles) which are selected by . The simple criterion, , gives an unrealistically high number density of LAEs at . This is probably due to the contamination of low- interlopers because of the lack of the selection criterion based on color. For the reader’s eye guide, we draw the LFs of LBGs at (Steidel et al., 1999) and (Ouchi et al. in preparation) in Figure 4b. We find that the bright-end slope of the LF of LAEs is steeper than those of and LBGs.
Both LBGs and LAEs seem to have a similar number density at the faintest magnitudes. However, at these magnitudes, the LF of LBGs has errors of a factor of 1.5-2, and the amplitude of the LF of LAEs may have an offset of a factor of two or more due to uncertainties in the estimation of contamination, completeness and the surveyed volume. Hence, we cannot conclude clearly that LAEs constitute a majority of high-redshift galaxies at these faint magnitudes. This is why we discuss only the relative shape of the LF between LBGs and LAEs. We think that there exists one possibility that alters the shape of our LAE LF. We correct the completeness, assuming that the distribution of EW is the same irrespective of magnitude. If, however, faint LAEs tend to have weak EWs, our completeness-corrected number density will be overestimated. This may make the apparent shape of the LF steeper.
5 Clustering Properties
Figure 5 shows the sky distribution of the LAEs in our sample. We find in this figure an inhomogeneous distribution of the LAEs. Prior going to investigate the clustering properties of LAEs, we examine the spatial homogeneity of our data. We find that the photometric zero points of our data are accurate within 0.1 mag over the whole field of view, since we find that PSF-like objects make a single sharp stellar locus in the two-color ( vs. ) plane. Then we examine possible spatial differences in the source detection efficiency by (1) examining the number densities of -band detected objects in small () areas covering the survey region, (2) measuring the limiting magnitudes in 2700 small () areas for each of the , , and images, and (3) estimating the detection completeness of LAEs from Monte-Carlo simulations in the same manner as in Ouchi et al. (2001a) but assuming model LAE spectra (see caption of Figure 3). We find no inhomogeneity in (1)-(3), which indicates that the detection efficiency is uniform at least on scales.
We derive the angular two-point correlation function using the estimator defined by Landy & Szalay (1993). The random sample for the estimator is composed of 100,000 sources with the same geometrical constraints as of the data sample. We fit a single power law, , to the data points, but the best fit value of is very shallow (). This value is much smaller than the best fit values of the local galaxies,, and - LBGs, - (Giavalisco et al., 1998; Giavalisco & Dickinson, 2001; Porciani & Giavalisco, 2002). We think that the value cannot be determined with an enough accuracy from our data, and fix to the ’fiducial’ value, . We fit alone to the data with a fixed slope, , then the best-fit value of Aω is 29 arcsec0.8. The integral constant () for is calculated to be 0.195. The resulting angular correlation function for the LAEs is shown in Figure 6 after the application of the . We find that the reduced value of this fitting, 6.7, is 1.9 times larger than that for the two-parameter fitting, . Although the fitting with is worse than the one with , we cannot accurately derive from our data in any case. Thus we decide to calculate at . We calculate the angular correlation function under arcmin scales, since systematic errors increase largely over arcmin scales, which are comparable to a half of the surveyed field of view. However, we find that the sky distribution of LAEs (Figure 5) has a large gradient in the number density from the north to the south. This may imply the existence of a large-scale structure whose scale could be over arcmin (Mpc). An excess of the angular correlation function (Figure 6) over the power law at around will be (at least partly) due to this large-scale structure.
In order to investigate the dependence of clustering amplitude on physical properties of LAEs, we calculate the angular correlation function by dividing the 87 LAEs into two sub-samples based on three properties; Ly luminosity, UV magnitude, and observed equivalent width (). For each of the three properties, we divide the original sample at an appropriate boundary in order to keep a reasonable number of objects in each of the sub-samples. Figure 7a shows the results when the LAE sample is divided by Ly luminosity, (30 objects : filled circles) and (57 objects : open circles). Figures 7b and 7c are the same plots, but divided by UV magnitudes ( [30 objects: filled circles], [57 objects: open circles]) and by ( Å [30 objects: filled circles], Å [57 objects: open circles]). The correlation amplitude of the Ly-bright sample is significantly larger than that of the Ly-faint sample. On the other hand, such a significant difference is not found in either UV-magnitude sub-samples or sub-samples 888 We make similar analyses, varying the boundaries of Ly luminosity, UV magnitude, and , but keeping the number ratio of objects in the two sub-samples (e.g., Ly bright and Ly faint sub-samples) being in an appropriate range, 3:7 to 7:3. We find clear dependence of clustering amplitude on Ly luminosity in a wide range of the number ratio, but find no such significant dependence in either UV-magnitude sub-samples or sub-samples. . Since the Ly luminosity is estimated from the narrow-band magnitude, the Ly-bright sample may be biased toward LAEs whose Ly emissions are efficiently detected around the center of the band, resulting in Ly-bright objects are distributed in a smaller redshift range than Ly-faint objects. A smaller redshift distribution gives stronger angular correlation. If this is the case, however, a similar effect should also be seen in the -dependent correlation function. We do not see such effect in the sub-samples. Different degrees of contamination of low- interlopers in the two Ly sub-samples could cause a segregation in correlation amplitude. In Figure 7a, the difference in correlation amplitude in the sub-samples is about a factor of two. If the Ly segregation is solely due to the contamination, the two sub-samples must have largely different degrees of contamination by more than a factor of two. Since such a large magnitude-dependent contamination is not found in the Monte Carlo simulations (section 3), the contamination does not seem to cause the Ly-luminosity segregation. We therefore conclude that the difference in the correlation amplitude between the Ly sub-samples is probably real.
6 DISCUSSION & CONCLUSIONS
The LFs of LAEs show little evolution between and either for Ly emission or UV continuum emission ( Figures 4a and 4b). Both Ly luminosity and UV-continuum luminosity are sensitive to star-formation activities and extinction by shading HII regions. In addition, Ly luminosity is dependent on gas density and dust composition in HII regions, since the Ly photons are produced by a number of the resonance scatterings in HII regions. Therefore, little evolution of the LAE LF between and may imply that and LAEs have similar gas densities and dust components in their HII regions, unless the number density of LAE is largely changed.
Figure 4b shows that the LF of LAEs at measured in UV continuum seems to be steeper in the bright end than the LF of LBGs at similar redshifts, indicating that galaxies with a stronger Ly emission tend to be less luminous in UV continuum. Shapley et al. (2001) have found that LBGs with old stellar populations emit a stronger Ly emission than those with young stellar populations. 999 Malhotra & Rhoads (2002) have argued on the basis of the distribution of Ly equivalent width in their LAE sample that the LAEs are predominantly quite young. Thus, the age of LAEs appears to be still under debate. However, these two papers may have estimated ages of different populations (Of course, differences in the sample selection may also be a reason for the inconsistency). The result of Malhotra & Rhoads (2002) would be for the stellar age of star-forming regions in LAEs, since they estimate the age from the rest-frame UV flux to which no old star contributes. On the other hand, Shapley et al. (2001) calculate the averaged (luminosity weighted) stellar age from the combination of the rest-frame UV and the rest-frame optical flux, by taking advantage of their near-infrared data. Since we discuss the averaged feature of LAEs, we use here Shapley et al.’s result. A combination of these two findings suggests that galaxies less luminous in UV continuum are on the average older. If we assume here that UV-continuum luminosity correlates positively with the stellar mass, the suggestion above implies that less massive galaxies tend to be older, which is qualitatively consistent with a hierarchical merging scenario such as CDM models.
We find a clear clustering signal of the LAEs at . The amplitude of angular correlation function (Figure 6) is arcsec0.8, and it is about 40 times larger than that of LBGs at (Ouchi et al., 2001a), arcsec0.8. However, since the selection function in the direction of redshift of the LAE sample is about 20 times narrower than that of LBGs, the clustering amplitude of LAE in the real space is found to be comparable to that of LBGs as described below.
The clustering amplitude can be translated into the correlation length using Limber equation, given the redshift distribution of the sample. Assuming that the redshift distribution of the LAEs is a tophat shape of , we estimate the correlation length, , of the LAEs to be Mpc 101010 The actual shape of the transmittance of can be approximated by a triangle (see Figure 1a). We calculate the correlation length assuming the redshift distribution to be a triangle whose center and FWHM are and , to obtain a slightly larger value, Mpc. . Foreground contaminations to the sample dilute an apparent clustering amplitude of LAEs. When the fraction of contaminants is , the apparent value can be reduced by a factor of up to ; the maximum reduction occurs when the contaminants are not at all clustered. In reality, the contaminants in our sample will be a sum of emission-line galaxies at several redshifts, and thus would be clustered very weakly on the sky. If we assume that is 40% for our LAE sample (see section 3) and that contaminants are not clustered, we obtain the contamination-corrected correlation length to be Mpc. This is the maximum value permitted.
These raw and contamination-corrected values of are larger than that of LBGs obtained in Ouchi et al. (2001a); Mpc for the raw value and Mpc for the contamination-corrected value. The mean UV luminosity of LAEs in this study is fainter than that of LBGs studied in Ouchi et al. (2001a), since our LAE sample includes galaxies down to mag, which is mag fainter than the faintest galaxy in Ouchi et al.’s (2001a) LBG sample. Giavalisco & Dickinson (2001) have found in their LBGs that increases with the UV luminosity. If this holds for LBGs at and LAEs at , our LAE sample should give a smaller value of than Ouchi et al.’s (2001a) LBG sample. However, no such trend is seen; the of LAEs is even larger than that of LBGs. This may imply that LAEs have a higher biasing factor against the underlying dark matter than LBGs. (In this discussion, we assume that clustering properties of galaxies do not significantly evolve from to ). The general trend that increases with halo mass may not necessarily hold for LAEs, since their clustering might be ’enhanced’ due to, say, unknown evironmental effects which produce galaxies with strong Ly emission lines. However, we cannot rule out at present the possibility that the dark halo masses of LAEs are higher than our expectations from their luminosities.
The LAEs in our sample have nearly the same dynamic range both in Ly luminosity ( ) and in UV-continuum luminosity ( to ). Figure 7 shows, however, that the difference of clustering amplitude is seen not for UV sub-samples but only for Ly sub-samples. Hence the degree of clustering is probably more strongly dependent on Ly luminosity than UV-continuum luminosity. This result is consistent with the fact found above that LAEs show stronger clustering amplitude than LBGs in spite of the former being fainter in UV-continuum luminosity.
Shapley et al. (2001) have found in their LBG sample that older LBGs (in terms of mean stellar age) have a stronger Ly emission. If this is also the case for LAEs, LAEs with a stronger Ly emission will be older on the average. This is consistent with our finding that LAEs more luminous in Ly emission are more strongly clustered, if we assume that the biasing factor is higher for older galaxies.
We have found that LAEs dominate at the fainter part of the UV LF of galaxies at . We have also found a clear clustering signal in our LAE sample. Pascarelle, Windhorst, Keel, & Odewahn (1996) have made the hypothesis, from their findings of LAEs being compact, that LAEs may be sub-galactic clumps located in groups or sheets of collapsed dark matter. Our two findings seem to be consistent with the hypothesis.
References
- Bertin & Arnouts (1996) Bertin, E. & Arnouts, S. 1996, A&AS, 117, 393
- Brocklehurst (1971) Brocklehurst, M. 1971, MNRAS, 153, 471
- Bruzual & Charlot (1993) Bruzual A., G. & Charlot, S. 1993, ApJ, 405, 538
- Campos et al. (1999) Campos, A., Yahil, A., Windhorst, R. A., Richards, E. A., Pascarelle, S., Impey, C., & Petry, C. 1999, ApJ, 511, L1
- Coleman, Wu, & Weedman (1980) Coleman, G. D., Wu, C.-C., & Weedman, D. W. 1980, ApJS, 43, 393
- Connolly et al. (1995) Connolly, A. J., Csabai, I., Szalay, A. S., Koo, D. C., Kron, R. G., & Munn, J. A. 1995, AJ, 110, 2655
- Cowie & Hu (1998) Cowie, L. L. & Hu, E. M. 1998, AJ, 115, 1319
- Efstathiou et al. (1991) Efstathiou, G., Bernstein, G., Tyson, J. A., Katz, N., & Guhathakurta, P. 1991, ApJ, 380, L47
- Fernández-Soto, Lanzetta, & Yahil (1999) Fernández-Soto, A. and Lanzetta, K. M. and Yahil, A. 1999, ApJ, 513, 34
- Fontana et al. (2000) Fontana, A., D’Odorico, S., Poli, F., Giallongo, E., Arnouts, S., Cristiani, S., Moorwood, A., & Saracco, P. 2000, AJ, 120, 2206
- Furusawa et al. (2000) Furusawa, H., Shimasaku, K., Doi, M., & Okamura, S. 2000, ApJ, 534, 624
- Fynbo, Möller, & Thomsen (2001) Fynbo, J. U., Möller, P., & Thomsen, B. 2001, A&A, 374, 443
- Giavalisco et al. (1998) Giavalisco, M., Steidel, C. C., Adelberger, K. L., Dickinson, M. E., Pettini, M., & Kellogg, M. 1998, ApJ, 503, 543
- Giavalisco & Dickinson (2001) Giavalisco, M. & Dickinson, M. 2001, ApJ, 550, 177 (GD01)
- Gunn & Stryker (1983) Gunn, J. E. & Stryker, L. L. 1983, ApJS, 52, 121
- Hu, Cowie, & McMahon (1998) Hu, E. M., Cowie, L. L., & McMahon, R. G. 1998, ApJ, 502, L99
- Kinney et al. (1996) Kinney, A. L., Calzetti, D., Bohlin, R. C., McQuade, K., Storchi-Bergmann, T., & Schmitt, H. R. 1996, ApJ, 467, 38
- Landy & Szalay (1993) Landy, S. D. & Szalay, A. S. 1993, ApJ, 412, 64
- Lowenthal et al. (1997) Lowenthal, J. D. et al. 1997, ApJ, 481, 673
- Madau (1995) Madau, P. 1995, ApJ, 441, 18
- Madau, Pozzetti, & Dickinson (1998) Madau, P., Pozzetti, L., & Dickinson, M. 1998, ApJ, 498, 106
- Maihara et al. (2001) Maihara, T. et al. 2001, PASJ, 53, 25
- Malhotra & Rhoads (2002) Malhotra, S. & Rhoads, J. E. 2002, ApJ, 565, L71
- Miyazaki et al. (1998) Miyazaki, S., Sekiguchi, M., Imi, K., Okada, N., Nakata, F. & Komiyama, Y. 1998, SPIE, 3355, 363
- Møller & Fynbo (2001) Møller, P. & Fynbo, J. U. 2001, A&A, 372, L57
- Ouchi et al. (2001a) Ouchi, M. et al. 2001, ApJ, 558, L83
- Ouchi et al. (2001b) Ouchi, M. et al. 2001, To appear in the proceedings of the Marseille 2001 conference ”Where is the Matter? Tracing Dark and Bright Matter with the New Generation of Large-Scale Surveys”, 25-29 June 2001, Marseille (France)., 9252
- Palunas, Francis, & Woodgate (2000) Palunas, P., Francis, P., & Woodgate, B. 2000, American Astronomical Society Meeting, 197,
- Pascarelle, Windhorst, Keel, & Odewahn (1996) Pascarelle, S. M., Windhorst, R. A., Keel, W. C., & Odewahn, S. C. 1996, Nature, 383, 45
- Pascarelle, Windhorst, & Keel (1998) Pascarelle, S. M., Windhorst, R. A., & Keel, W. C. 1998, AJ, 116, 2659
- Peebles (1980) Peebles, P. J. E. 1980, The Large-Scale Structure of the Universe (Princeton: Princeton Univ. Press)
- Porciani & Giavalisco (2002) Porciani, C. & Giavalisco, M. 2002, ApJ, 565, 24
- Rhoads et al. (2000) Rhoads, J. E., Malhotra, S., Dey, A., Stern, D., Spinrad, H., & Jannuzi, B. T. 2000, ApJ, 545, L85
- Sawicki, Lin, & Yee (1997) Sawicki, M. J., Lin, H., & Yee, H. K. C. 1997, AJ, 113, 1
- Shapley et al. (2001) Shapley, A. E., Steidel, C. C., Adelberger, K. L., Dickinson, M., Giavalisco, M., & Pettini, M. 2001, ApJ, 562, 95
- Stiavelli et al. (2001) Stiavelli, M., Scarlata, C., Panagia, N., Treu, T., Bertin, G., & Bertola, F. 2001, ApJ, 561, L37
- Steidel et al. (1996a) Steidel, C. C., Giavalisco, M., Pettini, M., Dickinson, M., & Adelberger, K. L. 1996, ApJ, 462, L17
- Steidel et al. (1996b) Steidel, C. C., Giavalisco, M., Dickinson, M., & Adelberger, K. L. 1996, AJ, 112, 352
- Steidel et al. (1999) Steidel, C. C., Adelberger, K. L., Giavalisco, M., Dickinson, M., & Pettini, M. 1999, ApJ, 519, 1
- Steidel et al. (2000) Steidel, C. C., Adelberger, K. L., Shapley, A. E., Pettini, M., Dickinson, M., & Giavalisco, M. 2000, ApJ, 532, 170
- Sullivan et al. (2000) Sullivan, M., Treyer, M. A., Ellis, R. S., Bridges, T. J., Milliard, B., & Donas, J. ; 2000, MNRAS, 312, 442
- Venemans et al. (2002) Venemans, B. P. et al. 2002, ApJ, 569, L11