Clusters of Galaxies at Sharp Focus: Cooling Flows and Radio Sources Unveiled by Chandra
Abstract
Chandra images of galaxy clusters have revealed a wealth of structure unseen by previous generations of low resolution X-ray observatories. In the cores of clusters, bright, irregular X-ray emission is now routinely seen within central dominant galaxies (CDGs) harboring powerful radio sources. The radio sources are interacting with and are often displacing the hot gas leaving cavities in their wakes. The cavities rise buoyantly, transporting up to ergs of energy to the intracluster medium over the life of a cluster. The dynamically important magnetic fields observed in cooling flows may have originated from these cavities. The cooling rates found by Chandra and XMM-Newton are much smaller than previously reported, and they are more in line with the levels of cold gas and star formation seen in other bandpasses. I discuss the emerging correlation between extended H emission, star formation, and bright X-ray emission at locations where the cooling time of the keV gas approaches a few hundred million years. Data from a variety of disciplines suggest repeated, short duration bursts of cooling and star formation are occurring, possibly induced and regulated in some instances by the central radio source. Finally, I discuss the interesting possibility that radio sources quench cooling flows, while emphasizing the difficulties with some proposed scenarios.
Dept. of Physics & Astronomy, Ohio University, Clippinger Labs, Athens, OH 45701
1. Introduction
In my oral presentation, I discussed four topics: the discovery and interpretation of the large density discontinuities, or so-called cluster “cold fronts”, Chandra observations of high redshift clusters, interactions between radio sources and the hot intracluster medium (ICM), and cooling flows. The first topic has been reviewed by Forman et al. (2001) and Sarazin (2001), to which I refer the interested reader. The exciting topic of high resolution X-ray imaging of distant clusters is somewhat less mature, perhaps because it is photon-starved and results are emerging slowly. However, Chandra is beginning to reveal the structure, temperatures, and masses of distant clusters, giving us a new view of cluster formation and evolution. For further details, I refer the reader to other discussions of high redshift galaxies (Fabian et al. 2001a, Holden et al. 2001, Stanford et al. 2001, Jeltema et al. 2001) while at the same time, apologizing to those whose papers I have missed.
I concentrate here on Chandra observations of the cores of relatively nearby cooling flow clusters (Fabian 1994). I emphasize the bright X-ray systems where Chandra’s superb spatial resolution can be used to full advantage in exploring the structure of the ICM. These systems are particularly interesting as they tend to harbor powerful radio sources. Chandra observations of these systems are providing new insight into the life cycles of radio sources and the deposition of energy and magnetic field into the ICM. In addition, I highlight the significant contributions Chandra’s superb spatial resolution is making toward a solution to the well-known cooling flow problem–the fate of the putatively large cooling mass fluxes in clusters–which I discuss in some detail. This review updates and expands the briefer discussions by McNamara et al. (2001a) and McNamara (2001).
2. Interactions Between Radio Sources and the keV Gas
Images of cooling flow clusters taken in the past decade with the ROSAT High Resolution Imager (HRI) have shown X-ray structure surrounding the radio sources in CDGs (Sarazin et al. 1995, Sarazin 1997, Rizza et al. 2000). The X-ray morphology varies, with some objects exhibiting enhanced emission at the location of the radio source, while others show deficits. However, in most instances, a detailed comparison between the X-ray and radio morphologies was prohibited by the roughly four arcsec resolution of the HRI. By virtue of their proximity, the HRI images of NGC 1275 in the Perseus cluster (Böhringer et al. 1993) and Cygnus A (Carilli, Perley, & Harris 1994) clearly show the radio lobes displacing the thermal gas surrounding them. Nevertheless, ROSAT’s limited spatial and spectral resolution did not permit a spectral analysis that would lead to a detailed understanding of the nature of the interactions. Chandra has changed this situation dramatically. Its exquisite, half arcsecond spatial resolution and moderate spectral resolution is capable of probing both spatially and spectrally interactions between radio sources and the surrounding plasma in a variety of systems including galaxies (Finoguenov & Jones 2000, Jones et al. 2000), groups (Vrtilek et al. 2000), and clusters. I discuss here the recent cluster studies which I suggest are leading to a new understanding of these interactions and their impact on the dynamics of the ambient medium in which they occur.
2.1. Radio-Bright Cavities in the keV Gas
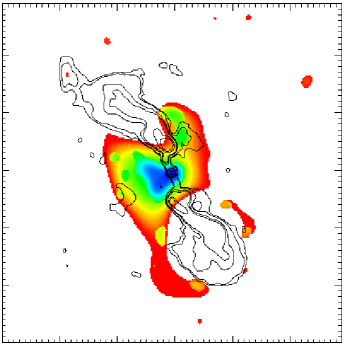
The first Chandra images to show crisp signatures of interactions between the keV gas and powerful radio sources were those of the Hydra A and Perseus clusters (McNamara et al. 2000, Fabian et al. 2000a). In both cases, the large depressions in the X-ray emission coincident with the radio lobes and the bright emission surrounding and between the lobes are strikingly shown in Figure 1. Since then many clusters have been reported with similar features, such as Abell 2052 (Blanton et al. 2001), RBS 797 (Schindler et al. 2001), MKW3s (Mazzotta et al. 2001), Abell 2597 (McNamara et al. 2001b), Cygnus A (Wilson, Young, & Shopbell 2000), and 2A0335+096 in the Chandra archive. As Figure 1 shows, the radio lobes appear to have displaced the keV gas surrounding them, leaving cavities. Some of the questions to be answered are how the cavities formed, how they are supported against collapse (i.e., what is the equation of state within the cavities?), how long they survive, how frequently they occur, and their long-term impact on the ICM. I will address these topics here to the varying degrees of detail permitted by the data available at this time.
Using simulations of jets expanding into the ICM, Clarke, Harris, & Carilli (1997) and Heinz, Reynolds, & Begelman (1998) argued that the cavities seen in the ROSAT images of Perseus (Böhringer et al. 1993) and Cygnus A (Carilli, Perley, & Harris 1994) were caused by strong shock waves generated by relativistic jets. These models predicted that the X-ray emission from the rims surrounding the cavities should be spectrally hard, and gas in the rim should have higher entropy than the surrounding gas. While these predictions have yet to be tested in the case of Cygnus A, to our surprise the Chandra images of Hydra A (McNamara et al. 2000, Nulsen et al. 2001), Perseus (Fabian et al. 2000a), and Abell 2052 (Blanton et al. 2001) show soft emission from the rims, indicative of low entropy gas. This implies that the radio lobes expanded gently into the intracluster medium at roughly the sound speed in the keV gas (Reynolds, Heinz, & Begelman 2001, David et al. 2001, Nulsen et al. 2001). The few cavities studied thus far do not appear to have formed by shock waves associated with the radio sources, or they are being viewed in the late stages of their development.
The source of pressure within the cavities is not well understood. In Hydra A and Abell 2052, the external gas pressure exceeds the internal equipartition magnetic field and cosmic ray pressure by roughly a factor of ten (McNamara et al. 2000, Blanton et al. 2001). If the equipartition pressures are valid, the cavities should quickly collapse. However, their high frequency of detection, and the existence of the older, radio-quiet ghost cavities, implies that they persist on timescales longer than their sound crossing (collapse) timescales. The cavities should then be roughly in pressure balance with the surrounding gas. This would require an additional source of internal pressure support such as a dilute thermal gas, or an unseen population of energetic particles.
In Hydra A and Abell 2052, the data are consistent with the cavities being devoid of thermal gas. However, the uncertainties of the measurements do not preclude this. As a counter example, Mazzotta et al. (2001) have reported a hot thermal bubble in MKW3s. In either case, the gas density within the cavities is clearly less than their surroundings, so they should behave like bubbles in water and rise buoyantly in the intracluster medium (McNamara et al. 2000, Churazov et al. 2001). In this instance, the timescale for cavities to reach their heights in cluster atmospheres is determined by their buoyancy speed, which is of the same order as the Keplerian velocity at their true distance from the center of the cluster (Churazov et al. 2001). This timescale provides crude ages for the cavities of yr, which exceeds their sound collapse timescales.
2.2. Radio-Faint “Ghost” Cavities in the keV Gas
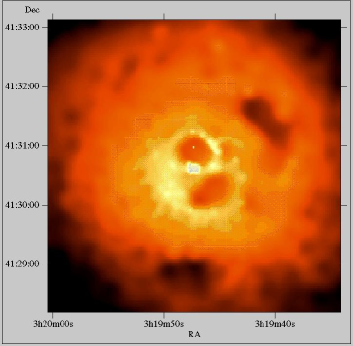
In addition to radio-filled cavities, holes in the cluster X-ray emission that lack bright radio emission above GHz have been discovered in the Perseus and Abell 2597 clusters. These “ghost” cavities are seen in Perseus beyond its inner radio-filled cavities (Fabian et al. 2000a and Figure 1) and beyond the powerful radio source in the nucleus of Abell 2597’s CDG (McNamara et al. 2001b and Figure 2). In Perseus, flattened ghost cavities are seen roughly one arcmin to the northwest and south of the cluster center (Figure 1). The inner cavities are filled with bright radio emission (Fabian et al. 2000a), although the radio emission is not shown in Figure 1.
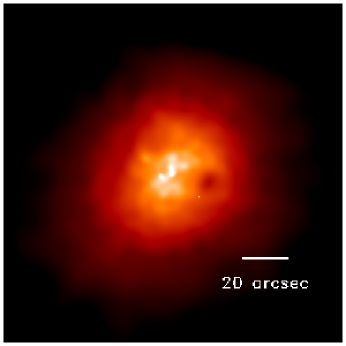
Likewise, Abell 2597’s ghost cavities are located symmetrically about the inner radio source roughly 20 arcsec to the northeast and southwest of the CDG’s nucleus. The cavity to the southwest is most prominent in the left panel of Figure 2. In the right panel of Figure 2, I have displayed the cavities with respect to the compact central radio source after subtracting the background cluster emission and expanding the image to highlight the central structure. The ghost cavities clearly do not coincide with the central radio source.
Based on the properties of radio-bright cavities, it is reasonable to suppose that the ghost cavities were produced in radio episodes that predated the current ones. One might then expect to detect faint radio emission from the dying lobes of the causal radio event. Indeed, faint spurs of radio emission have been detected near Perseus’s ghost cavities at 74 MHz (Blundell et al. 2000, Fabian et al. 2000a). Likewise, faint radio emission at 1.4 GHz was detected at the level of a few mJy toward Abell 2597’s ghost cavities with the VLA (McNamara et al. 2001b). These radio detections are consistent with the hypothesis that the ghost cavities were created in earlier radio events that occurred between 50–100 Myr ago. The energy required to inflate Abell 2597’s ghost cavities implies that the radio source was an order of magnitude more powerful in the past than the one seen today, which would have been as powerful as Hydra A. These bubbles of magnetic field and cosmic rays are presumably lifted into the outer regions of clusters where, rejuvenated, they may contribute to the formation of radio halos (Kempner & Sarazin 2001, Enßlin & Gopal-Krishna 2001).
2.3. Repeated Radio Outbursts Magnetize the keV Gas
That nearly 70% of CDGs in cooling flows are radio-bright (Burns 1990) implies that radio sources live longer than about 1 Gyr, or they recur with high frequency. Our interpretation of the cavities implies the latter, with a recurrence approximately every 100 Myr (McNamara et al 2001b). This would have significant implications for understanding energy feedback from the radio source to the ICM (Tucker & David 1997, Soker et al. 2001, Churazov et al. 2002). A lower limit to the energy expended during cavity formation is given by the work done on the surrounding gas. For Hydra A, the total energy is erg (McNamara et al. 2000), and energies of the same order are found for Abell 2052 (Blanton et al. 2001) and Abell 2597 (McNamara et al. 2001b).
Assuming that CDGs produce between bubbles over their lifetimes, each with an energy of , they would deposit erg into the ICM in the form of magnetic field, cosmic rays, and heat. This energy would be comparable to the the total thermal energy of the X-ray-emitting plasma in the inner regions of some clusters. Clusters are magnetized (Clarke, Kronberg, & Böhringer 2001, Kronberg et al. 2001), and these bubbles may be vessels that transport magnetic field from giant, central black holes to the ICM. If a significant fraction this energy were deposited as magnetic field in the inner 100 kpc of clusters, the implied field strengths of G would be consistent with the field strengths derived from Faraday rotation measures observed in the cores of cooling flow clusters (Ge & Owen 1993).
3. The Cooling Flow Problem in the Chandra–XMM-Newton Era
Galaxy clusters often harbor bright cusps of X-ray emission in their central kpc. These cusps are associated with regions of dense gas with radiative cooling times less than a few Gyr (Fabian 1994). Absent a significant source of heat, the gas will cool to low temperatures and accrete onto the cluster’s CDG where it will presumably accumulate in atomic and molecular clouds and form stars. Indeed, the likelihood that a CDG has detectable levels of cold gas and star formation increases dramatically with X-ray cooling rate (McNamara 1997, Cardiel et al. 1998, Allen 1995, Crawford & Fabian 1993, Crawford et al. 1999, Edge 2001). This is shown in Figure 3, where I plot the trend for larger blueward colors associated with star formation in CDGs with increasing mass cooling rate. The cooling rates were estimated primarily with ROSAT data. The correlation suggests a strong connection between cooling flows and star formation. The problem with this interpretation rests with the large discrepancies between the star formation rates implied by the colors and the X-ray cooling rates.

While the cooling rates plotted are typically hundreds of solar masses per year, the star formation rates are typically several to several tens of solar masses per year, depending on the star formation history of the system in question. The systems with the largest star formation rates, which approach , appear to have experienced bursts or episodes of star formation lasting Myr or so (McNamara 1997). Therefore, unless cooling is likewise episodic, cold gas would accumulate to the observed levels in tens of Myr, much less than the probable Gyr ages of cooling flows. This uncomfortable situation has lead to the view that either the matter is accumulating in a dark or otherwise unusual physical state, or the cooling rates have been substantially overestimated. The Chandra and XMM-Newton data are showing that the cooling rates were indeed substantially overestimated. Nevertheless, the consensus of data from a variety of disciplines suggests that cooling is indeed occurring.
3.1. The Short Cooling Time of the keV Gas
Chandra has the unprecedented capability to measure the state of the keV gas in clusters on scales of a few arcsec. This corresponds to a few kpc for clusters within , which is comparable to the sizes of the radio sources and sites of star formation. With this unique capability, Chandra is applying a critical test of the cooling flow paradigm by providing for a direct comparison between local cooling rates and star formation rates, and searches for local heat sources that could reduce the cooling rates.

Chandra has confirmed the signature decline in gas temperature and the steeply rising density and pressure in the inner few tens of kpc of cooling flows (McNamara et al. 2000, David et al. 2001, Blanton et al. 2001, McNamara et al. 2001b). A typical example, Abell 2597, is shown here in Figure 4. The gas temperature declines from keV at 100 kpc to keV in the inner few kpc. At the same time, the density and pressure increase dramatically, reaching values of and in the central few kpc. The radiative cooling time of the gas there is only a few hundred Myr. No other X-ray observatory can make these measurements on such a fine scale.
3.2. Correlated Sites of Cooler KeV Gas & Star Formation
Several Chandra studies have shown a great deal of X-ray structure associated with high density, cooler gas in the central few tens of kpc of clusters. Much of this structure, seen for example in Figures 1 & 2, is associated with the radio sources, nebular emission, and sites of star formation. For instance, a bright, flattened X-ray structure is associated with the disk of star formation and nebular emission in Hydra A (McNamara et al. 2000). A similar spatial correlation is seen in Abell 2597, where bright knots of X-ray emission accompany the regions of ongoing star formation, nebular emission, and molecular gas (Heckman et al. 1989, McNamara & O’Connell 1993, Koekemoer et al. 1999, Voit & Donahue 1997, Donahue et al. 2000, Baker & Jaffe 2001, private communication). In both Hydra A and Abell 2597, the star formation regions and H emission are seen where the cooling time of the keV gas is shortest Myr.
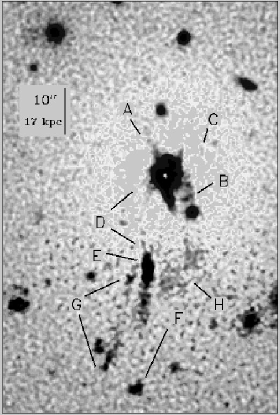
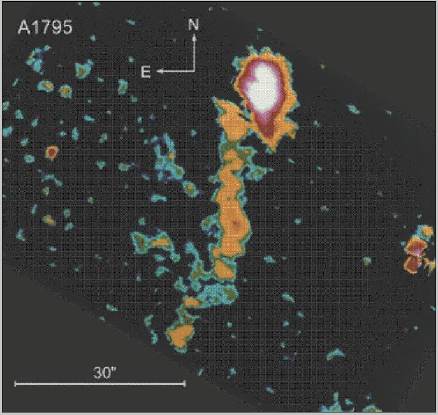
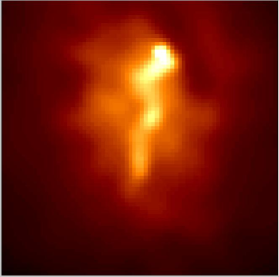
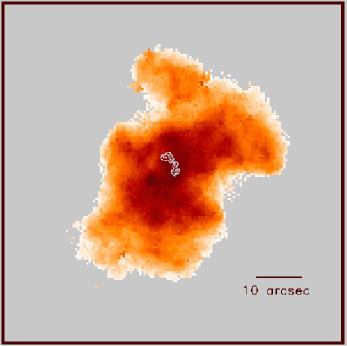
The most striking example of this correlation is seen in Abell 1795. The Chandra image (Fabian et al. 2001b) shows a bright filament of gas near the nucleus of the CDG that extends southward between 50–70 kpc. Trails of -band, young-star continuum (McNamara et al. 1996) and H emission (Cowie et al. 1983) roughly correspond to the bright X-ray filament. I have reproduced these images here in Figure 5. Although it is not clear how these features came into being, the possibilities include a cooling filament or “cooling wake” of gas that formed as the CDG sloshed about in the cluster potential (cf., Markevitch, Vikhlinin, & Mazzotta 2001), or the remains of cooler gas that arrived in the cluster core by way of a merger with a group of galaxies (McNamara et al. 1996). In any case, these correlations clearly establish a relationship between the coolest X-ray-emitting gas and star formation, as is suggested by the statistical correlation between cooling rate and color excess shown in Figure 3.
3.3. Atomic & Molecular Gas of Varying Temperature
I wish to emphasize that the evidence for gas with a range of temperature, as would be expected in a cooling flow, is not restricted to keV and recombination (H) temperatures alone. Large reservoirs of atomic and molecular gas with a variety of temperatures are seen in cooling flows. H I has been detected in absorption against the radio continua of several CDGs in large cooling flows (e.g., O’Dea, Baum, & Galimore 1994). The kinetic temperature of the atomic hydrogen is probably between K. In addition, molecular gas has been detected in the H2 feature in essentially all of the large cooling flows with strong nebular line emission (Elston & Maloney 1994, Jaffe & Bremer 1997, Falcke et al. 1998, Donahue et al. 2000). This infrared feature is tracing molecular gas at a temperature of K. Furthermore, carbon monoxide emission, which was first detected in Perseus (Lazareff et al. 1989), has now been detected in many cooling flow clusters by Edge (2001). In several cases, emission is seen in multiple line transitions which seem to trace warm molecular gas at K. The amounts of gas can exceed in some cases, bearing in mind uncertainties in the mass estimates of factors of several. These properties are atypical of CDGs in clusters without the X-ray signatures of cooling flows, although sensitive observations of a proper control sample should be pursued to confirm this. In any case, these observations demonstrate that large reservoirs of gas ranging between the virial temperature and molecular cloud temperatures are indeed present in the central few tens of kpc of cooling flows.
3.4. Reduced Cooling Rates from Chandra and XMM-Newton
Cooling rates have been now been estimated using a variety of methods and instruments on Chandra and XMM-Newton for several cooling flow clusters (Fabian et al. 2000b, McNamara et al. 2000, Peterson et al. 2001, David et al. 2001, Molendi & Pizzolato 2001, Böhringer et al. 2001). The consensus reached in these studies of an admittedly limited number of objects is that the spectroscopically-derived cooling rates are factors of 5–10 less than earlier ROSAT and Einstein values.
The most compelling evidence for reduced cooling is found with the XMM-Newton and Chandra high resolution grating spectra for the putatively massive, cooling flow in Abell 1835 (Allen et al. 1996). In contrast, the grating spectra give upper limits of , based primarily on Fe XVII emission line fluxes (Peterson et al. 2001, Wise 2001, private communication). These measurements imply that either most of the cooling gas is maintained above keV, or that gas is cooling without an obvious spectroscopic signature (Fabian et al 2000b). Moderate resolution CCD spectroscopy from Chandra and XMM-Newton also give systematically lower cooling rates.
The only remaining evidence for massive cooling is found using morphological cooling rates, calculated essentially by dividing the central gas mass by the cooling time. This method gives s that are roughly consistent with results from earlier X-ray missions. However, the morphological vastly exceed the spectroscopic in Hydra A, for example (David et al. 2001). The inconsistency between these methods suggests that either the cooling gas is being reheated or maintained at keV temperatures by some heating process (David et al. 2001, Fabian et al. 2000b, Narayan & Medvedev 2001), or our cooling models are wrong.
3.5. A Stellar Repository for Cooling Gas in Abell 2597 & Hydra A
The strongest spectroscopic evidence for cooling gas in the Hydra A cluster is found in the central 30 or so kpc (David et al. 2001, McNamara et al. 2000) near a large circumnuclear disk of young stars and gas (McNamara 1995, Hansen et al. 1995, Melnick et al 1997). The spectroscopic cooling rate derived from spectral imaging is within a 70 kpc radius. Beyond roughly 70 kpc, the Chandra data are consistent with single temperature thermal models without cooling, while earlier studies reported cooling rates of (David et al. 1990, Peres et al. 1998, but see Ikebe et al. 1997). The mass of young stars in the disk derived from rotation curve and luminosity measurements is . This mass is consistent with the present rate of cooling throughout the limited volume of the disk over the age of the cluster. However, if all of material cooling within a 70 kpc radius is accreting onto the disk, it would double its mass in Myr.
Similarly, a preliminary analysis of a Chandra image of Abell 2597 gives (McNamara et al. 2002), compared to the PSPC value of (Sarazin & McNamara 1997, Peres et al. 1998). The CDG in Abell 2597 likewise is experiencing vigorous star formation with a total mass of (McNamara & O’Connell 1993, Koekemoer et al. 1999). Cooling at the above rate would be capable of fueling star formation for a few tens of Myr or so depending on the star formation history. The upshot here is that the local cooling rates surrounding the star formation regions and the star formation rates seem to be converging. However, the state of the hot gas in cluster cores is much more complex than we might have hoped. Until these complexities are sorted out, the connection between cooling and star formation will remain uncertain. A lingering issue with the X-ray analysis is that while cooling flow models generally reproduce the observed spectra of the inner most regions of clusters quite well, we and others (Molendi & Pizzolato 2001) find that single temperature models often work equally well. There is ample evidence for keV gas with short cooling times, but there is little evidence for multiphase, cooling gas.
3.6. Episodic Cooling, Star Formation, and Feedback
The properties of Abell 2597 and Hydra A, if representative of other cooling flows, suggest that cooling and star formation occur episodically, rather than in a long duration flow as was previously thought. Interestingly, it has been known for some time that star formation in cooling flows probably occurs primarily in bursts, and that these bursts are sometimes associated with the radio source (McNamara & O’Connell 1993, Allen 1995, McNamara 1997, Cardiel et al. 1998). Furthermore, the star formation episodes occur on timescales that are less than or on the order of both the Myr timescales for radio outbursts inferred from the ghost cavity properties, and the cooling time of the gas in the vicinity of the star formation regions. The similarity of these timescales is at least consistent with the notion that feedback between gas accretion and the radio source is in some cases triggering star formation, while at the same time, regulating the degree of cooling.
One of the most appealing models to explain the reduced cooling rates is heating by the mechanical power of radio sources (Soker et al. 2001, Churazov et al. 2002). While there is some evidence for heating as seen in Hydra A’s flat central entropy profile (David et al. 2001), the gas surrounding the radio source is cooler, not hotter, than the ambient gas (McNamara et al. 2000, Fabian 2000a, Nulsen et al. 2001). This fact is seriously troubling for direct heating scenarios.

In Figure 6, I plot radio luminosity against central X-ray luminosity for a small sample of cooling flows. The filled points represent the observed radio luminosity, while the triangles are the same points multiplied by to represent the possible total mechanical energy available to work on the surrounding medium. The line indicates the threshold where the instantaneous radio luminosity matches the cooling luminosity, or the minimum energy required to quench a cooling flow over the short duration of the radio source.
Figure 6 shows that Hydra A and a few other sources are certainly powerful enough to significantly reduce or quench a cooling flow for many tens of Myr or so. However, most objects do not have enough power to quench cooling, and those that do must efficiently couple their mechanical power to the cooling gas. How the radio power would be coupled to the cooling gas is poorly understood. Several authors (David et al. 2001, Nulsen et al. 2001, Quilis, Bower & Balogh 2001, Brüggen et al. 2002, Churazov et al. 2002) have proposed scenarios where convective currents driven by Hydra A’s radio source may be removing cooling material out of the cluster’s core where it will expand, mix with ambient gas, and cool less efficiently. This process can assist in reducing the deposition of cooled gas without directly introducing heat. However, it is not clear whether these scenarios are consistent with the pronounced metallicity gradient in the cluster’s core (David et al. 2001, Fukazawa et al. 2000). Convection should remove a metallicity gradient, unless the excess metals can be replenished rapidly by ongoing star formation.
I should caution that the ROSAT data plotted in Figure 6 were taken heterogeneously from the literature, and the spatial resolution is poorly matched to the radio sources. Certainly this correlation needs to be revisited with Chandra. But it serves to illustrate the point that although radio sources clearly have a major impact on the cores of clusters, their ability to quench cooling over cluster ages has not, in my view, been demonstrated. Other agents such as heat conduction from the hot outer layers of clusters ought, yet again, to be reconsidered (Narayan & Medvedev 2001) in models aiming to reduce the level of cooling in cooling flows.
Acknowledgments
I would like to acknowledge the colleagues with whom I have worked closely in the last few years, Michael Wise, Paul Nulsen, Craig Sarazin, Larry David, and Chris Carilli, for their major contributions to the work discussed here. This research is supported by generous grants from NASA, the Chandra X-ray Center, the Space Telescope Science Institute, and the Department of Energy, including LTSA grant NAG5-11025 and Chandra General Observer and Archival Research Awards GO0-1078A, AR2300-7X, and GO1-2139X. I would like to give special thanks to Eric Schlegel for organizing this meeting, and to the Scientific Organizing Committee for inviting me to attend.
References
Allen, S. W. 1995, MNRAS, 276, 947
Allen, S. W. Fabian, A. C., Edge, A. C., Bautz, M. W., Furuzawa, A., & Tawara, Y. 1996, MNRAS, 283, 263
Blanton, E. L., Sarazin, C. L., McNamara, B. R., & Wise, M. 2001, ApJ, 558, L15
Blundell, K. M., Kassim, N. E., & Perley, R.A. 2000, in “The Evolution of Galaxies on Cosmological Timescales,” ASP, J. E. Beckman & T. J. Mahoney, eds., astro-ph/0004005
Böhringer, H., Voges, W., Fabian, A. C., Edge, A. C., & Neumann, D. M. 1993, MNRAS, 264, L25
Böhringer et al. 2001, AA, 365, L181
Brüggen, M., Kaiser, C. R., Churazov, E., & Enßlin, T. A. 2001, MNRAS, submitted astro-ph/0108486
Burns, J. O. 1990, AJ, 99, 14
Cardiel, N., Gorgas, J., & Aragon-Salamanca, A. 1998, MNRAS, 298, 977
Carilli, C. L., Perley, R. A., & Harris, D. E. 1994, MNRAS, 270, 173
Churazov, E., Brüggen, M., Kaiser, C. R., Böhringer, H., & Forman, W. 2001, ApJ, 554, 261
Churazov, E., Sunyaev, R., Forman, W., & Böhringer, H. 2002, preprint
Clarke, D. A., Harris, D. E., & Carilli, C. L. 1997, MNRAS, 284, 981
Clarke, T. E., Kronberg, P. P., & Böhringer, H. 2001, ApJ, 547, L111
Cowie, L. L., Hu, E. M., Jenkins, E. B., & York, D. G. 1983, ApJ, 272, 29
Crawford, C. S., Allen, S. W., Ebeling, H., Edge, A. C., Fabian, A. C. 1999, MNRAS, 306, 857
Crawford, C. S. & Fabian, A. C. 1993, MNRAS, 265, 431
David, L. P., Arnaud, K. A., Forman, W, Jones, C. 1990, ApJ, 356, 32
David, L. P., Nulsen, P. E. J., McNamara, B. R., Forman, W., Jones, C., Ponman, T., Robertson, B., Wise, M. 2001, ApJ, 557, 546
Donahue, M., Mack, J., Voit, G. M., Sparks, W., Elston, R., Maloney, P. R. 2000, ApJ, 545, 670
Edge, A. C. 2001, MNRAS, in press astro-ph/0106225
Elston, R. & Maloney, P. 1994, in Infrared Astronomy with Arrays: The Next Generation, ed. I. S. McLean (Kluwer: Dordrecht), 169
Enßlin, T. A. & Gopal-Krishna 2001, AA, 366, 26
Fabian, A. C. 1994, ARAA, 32, 277
Fabian, A. C., Mushotzky, R. F., Nulsen, P. E. J., Peterson, J. R. 2000b, MNRAS, 321, L20
Fabian, A. C., Crawford, C. S., Ettori, S., Sanders, J. S. 2001a, MNRAS, 322, 11
Fabian, A. C., Sanders, J. S., Ettori, S., Taylor, G. B., Allen, S. W., Crawford, C. S., Iwasawa, K., Johnstone, R. M., Ogle, P. M. 2000a, MNRAS, 318, L65
Fabian, A. C., Sanders, J. S., Ettori, S., Taylor, G. B., Allen, S. W., Crawford, C. S., Iwasawa, K., Johnstone, R. M. 2001b, MNRAS, 321, L33
Falke, H, Rieke, M. J., Rieke, G. H., Simpson, C. & Wilson, A. S. 1998. ApJ, 494, L155
Finoguenov, A., Jones, C. 2001, ApJ, 547, L107
Forman, W., Jones, C., Markevitch, M., & Vikhlinin, A. 2001, in Merging Processes in Clusters of Galaxies, edited by L. Feretti, I. M. Gioia, and G. Giovannini (Dordrecht: Kluwer), in press
Fukazawa, Y., Makishima, K., Tamura, T., Nakazawa, K., Ezawa, H., Ikebe, Y., Kikuchi, K., Ohashi, T. 2000, MNRAS, 313, 21
Ge, J. P. & Owen, F. N. 1993, AJ, 105, 778
Hansen, L., Jorgensen, H. E., & Norgaard-Nielsen, H.U., 1995, AA, 301, 640
Heckman, T. M., Baum, S. A., van Breugel W. J. M., & McCarthy, P. J. 1989, ApJ, 338, 48
Heinz, S., Reynolds, C. S., & Begelman, M. C. 1998, ApJ, 501, 126
Holden, B. P., Stanford, S. A., Rosati, P., Squires, G., Tozzi, P., Fosbury, R. A. E., Papovich, C., Eisenhardt, P., Elston, R., Spinrad, H. 2001, AJ, 122, 629
Ikebe, Y., Makishima, K., Ezawa, H., Fukazawa, Y., Hirayama, M., Honda, H., Ishisaki, Y., Kikuchi, K., Kubo, H., Murakami, T., Ohashi, T., Takahashi, T., Yamashita, K. 1997, ApJ, 481, 660
Jaffe, W. & Bremer, M. N. 1997, MNRAS, 284, L1
Jeltema, T. E., Canizares, C. R., Bautz, M. W., Malm, M. R., Donahue, M, & Garmire, G. 2001, ApJ, 562, 124
Kempner, J. C., & Sarazin, C. L. 2001, ApJ, 548, 639
Jones, C., Forman, W., Vikhlinin, A., Markevitch, M., David, L., Warmflash, A., Murray, S., & Nulsen, P. E. J. 2001, ApJ, submitted astro-ph/0108114
Koekemoer, A. M., O’Dea, C. P., Sarazin, C. L., McNamara, B. R., Donahue, M., Voit, G. M., Baum, S. A., & Galimore, J. F. 1999. ApJ, 525, 621
Kronberg, P. P., Dufton, Q. W., Li, H., Colgate, S. A. 2001, ApJ, in press, astro-ph/0106281
Lazareff, B., Castets, A., Kim, D.W., & Jura, M. 1989, ApJ, 336, L13
Markevitch, M., Vikhlinin, A., & Mazzotta, P. 2001, ApJ, 562, L153
Mazzotta, P., Kaastra, J. S., Paerels, F. B., Ferrigno, C., Colafrancesco, S., Mewe, R., & Forman, W.R. 2001, ApJ, submitted astro-ph/0107557
McNamara, B. R. 1995, ApJ, 443, 77
McNamara, B. R. 2001, Proceedings of XXI Moriond conference: Galaxy Clusters and the High Redshift Universe Observed in X-rays”, edited by D. Neumann, F. Durret, & J. Tran Thanh Van astro-ph/0105563
McNamara, B. R. 1997, in “Galactic and Cluster Cooling Flows”, ed. N. Soker (San Francisco: PASP), 109 astro-ph/9612196
McNamara, B. R., & O’Connell, R. W. 1993, AJ, 105, 417
McNamara, B. R., Wise, M., Sarazin, C. L., Jannuzi, B. T., & Elston, R. 1996, ApJ, 466, L9
McNamara, B. R., Wise, M., Nulsen, P. E. J., David, L. P., Sarazin, C. L., Bautz, M., Markevitch, M., Vikhlinin, A., Forman, W. R., Jones, C., & Harris, D. E. 2000, ApJ, 534, L135
McNamara, B. R., Wise, M. W., Nulsen, P. E. J., David, L. P., Carilli, C. L., Sarazin, C. L., O’Dea, C. P., Houck, J., Donahue, M., Baum, S., Voit, M., O’Connell, R. W., Koekemoer, A. 2001b, ApJ, 562, L149
McNamara, B. R., Wise, David, L. P., Nulsen, P. E. J., & Sarazin, C. L. 2001a, in Constructing the Universe with Clusters of Galaxies, ed. F. Durret & D. Gerbal, (Paris: IAP), astro-ph/0012331
McNamara, B. R. et al. 2002, in preparation
Melnick, J., Gopal-Krishna, Terlevich, R. 1997, MNRAS, 288, 78
Molendi, S. & Pizzolato, F. 2001, ApJ, 560, 194
Narayan, R. & Medvedev, M.V. 2001, preprint astro-ph/0110567
Nulsen, P. E. J., David, L. P., McNamara, B. R., Jones, C., Forman, W.R., & Wise, M. 2001, ApJ, in press
O’Dea, C. P., Baum, S. A., & Galimore, J. F., 1994, ApJ, 436, 669
Peres, C. B., Fabian, A. C., Edge, A. C., Allen, S. W., Johnstone, R. M., & White, D. A. 1998, MNRAS, 298, 416
Peterson, J. R., Paerels, F. B. S., Kaastra, J. S., Arnaud, M., Reiprich, T. H., Fabian, A. C., Mushotzky, R. F., Jernigan, J. G., Sakelliou, I. 2001, A&A, 365, L324
Quilis, V., Bower, R. G., & Balogh, M. L. 2001, MNRAS, in press astro-ph/0109022
Reynolds, C. S., Heinz, S., & Begelman, M. C. 2001, ApJ, 549, L179
Rizza, E., Loken, C., Bliton, M., Roettiger, K., Burns, J.O., & Owen, F.N. 2000, AJ, 119, 21
Sarazin, C.L. 1997, in “Galactic and Cluster Cooling Flows, ed. by N. Soker, (San Francisco: Publ. Astr. Soc. Pacific), 172 astro-ph/9612052
Sarazin, C. L. 2001, in Merging Processes in Clusters of Galaxies, edited by L. Feretti, I. M. Gioia, and G. Giovannini (Dordrecht: Kluwer), in press astro-ph/0105458
Sarazin, C. L., Burns, J. O., Roettiger, K., McNamara, B. R. 1995, A pJ, 447, 559
Sarazin, C.L. & McNamara, B.R. 1997, ApJ, 480, 203
Schindler, S., Castillo-Morales, A., De Filippis, E., Schwope, A., W mbsganss, J. 2001, A& A, in press, astro-ph/0107504
Soker, N., White, R. E., III, David, L. P., & McNamara, B. R. 2001, ApJ, 549, 832
Stanford, S. A., Holden, B., Rosati, P., Tozzi, P., Borgani, S., Eisenhardt, P. R., Spinrad, H. 2001, ApJ, 552, 504
Tucker, W., & David, L. P. 1997, ApJ, 484, 602
Voit, G. M., Donahue, M. 1997, ApJ, 486, 242
Vrtilek, J. M., David, L. P., Grego, L., Jerius, D., Jones, C., Forman, W., Donnelly, R. H., & Ponman, T. J., 2000, in Constructing the Universe with Clusters of Galaxies, ed. F. Durret & D. Gerbal, (Paris: IAP)
Wilson, A. S.,Young, A. J., Shopbell, P. L. 2000, ApJ, 2000, 544, L27