11email: garrett@jive.nl
The FIR/Radio correlation of high redshift galaxies
in the region of the HDF-N
The correlation between the far-infrared (FIR) and radio emission is well established for nearby star forming galaxies. Many applications, in particular the radio-to-submm spectral index redshift indicator, tacitly assume that the relation holds well beyond our local neighbourhood, to systems located at cosmological distances. In order to test this assumption I have constructed a sample of 20 HDF-N galaxies, all with measured spectroscopic redshifts, and all detected by both ISO and the WSRT at 15 micron and 1.4 GHz respectively. The galaxies span a wide range of redshift with a median value of . The ISO 15 micron data were k-corrected and extrapolated to the FIR (60 and 100 micron) by assuming a starburst (M82) spectral energy distribution (SED) for the entire sample. An initial analysis of the data suggests that the correlation between the FIR and the radio emission continues to apply at high redshift with no obvious indication that it fails to apply beyond . The sample is “contaminated” by at least 1 distant (), radio-loud AGN, VLA J123642+621331. This source has recently been detected by the first deep field VLBI observations of the HDF-N and is clearly identified as an outlier in the FIR/radio correlation.
Key Words.:
galaxies: starburst – galaxies: evolution – infrared: galaxies – radio continuum: galaxies1 Introduction
The correlation between the far-infrared (FIR) and radio emission is one of the tightest and most universal correlations known among the global properties of local star forming and starburst galaxies (see van der Kruit 1973, Helou & Bicay 1993 and references therein). Entirely unexpected, yet extending across five orders of magnitude in luminosity, the physical explanation for the tightness of the relation is that the non-thermal radio emission and the thermal FIR emission are both related to processes governed by massive star formation. Established via FIR and radio observations of nearby galaxies, the FIR/radio correlation forms the basis of several key applications. In particular, the technique of using the radio-to-submm spectral index as a redshift indicator (Carilli & Yun, 2000) and the use of unbiased radio observations to estimate the global star formation history of the Universe (Haarsma et al. 2000). These applications are beginning to overhaul current ideas of star formation and galaxy formation in the early Universe. In particular, deep SCUBA sub-mm observations of the high redshift Universe (e.g. Hughes et al. 1998, Barger et al. 1999) reveal a dominant population of dusty, optically faint (early type) galaxies that are inferred (via the radio-to-submm spectral index redshift indicator) to lie at cosmological distances (). These results are in sharp contrast to optical and ultraviolet studies which argue for a strong peak in the global star formation rate at around (e.g. Madau et al. 1996).
| WSRT ID | RA ( hr) | DEC () | S1.4GHz | ISO ID | S15μ | |
|---|---|---|---|---|---|---|
| (m,s) | (′ ′′) | Jy | Jy | |||
| 3631+1108 | 36 31.59 | 11 08.20 | HDF_PM3_1 | 355 | 1.013 | |
| 3634+1239 | 36 34.44 | 12 39.63 | HDF_PM3_3 | 363 | 1.219 | |
| 3634+1214 | 36 34.46 | 12 14.26 | HDF_PM3_2 | 448 | 0.458 | |
| 3635+1427 | 36 35.09 | 14 27.16 | HDF_PM3_5 | 441 | 0.297 | |
| 3636+1132 | 36 36.78 | 11 32.07 | HDF_PM3_7 | 300 | 0.078 | |
| 3637+1151 | 36 37.32 | 11 51.89 | HDF_PM3_10 | 212 | 0.842 | |
| 3637+1117 | 36 37.53 | 11 17.19 | HDF_PM3_9 | 212 | 1.018 | |
| 3644+1247 | 36 44.19 | 12 47.31 | HDF_PM3_17 | 282 | 0.557 | |
| 3646+1405 | 36 46.02 | 14 05.63 | HDF_PM3_20 | 107 | 0.962 | |
| 3646+1528 | 36 46.19 | 15 28.39 | HDF_PM3_21 | 418 | 0.851 | |
| 3646+1447 | 36 46.20 | 14 47.56 | HDF_PM3_23 | 144 | 0.558 | |
| 3647+1427 | 36 47.84 | 14 27.02 | HDF_PM3_24 | 307 | 0.139 | |
| 3649+1314 | 36 49.58 | 13 14.12 | HDF_PM3_27 | 320 | 0.475 | |
| 3650+1034 | 36 50.98 | 10 34.63 | HDF_PM3_28 | 341 | 0.410 | |
| 3651+1357 | 36 51.36 | 13 57.04 | HDF_PM3_30 | 151 | 0.557 | |
| 3651+1222 | 36 51.81 | 12 22.37 | HDF_PM3_29 | 48 | 0.401 | |
| 3653+1137 | 36 53.05 | 11 37.67 | HDF_PM3_32 | 180 | 1.275 | |
| 3702+1401 | 37 02.40 | 14 01.24 | HDF_PM3_44 | 144 | 1.243 | |
| 3641+1546 | 36 41.90 | 15 46.87 | HDF_PS3_10 | 459 | 0.857 | |
| 3641+1331 | 36 41.90 | 13 31.96 | HDF_PS3_6e | 23 | 4.424 |
These sub-mm and radio based claims for substantial global star formation rates at high redshift depend upon a crucial assumption: viz. that the FIR/radio correlation is entirely independent of redshift. In fact there are many reasons why the correlation might well fail at non-local redshifts. In the radio domain these include primarily (Condon 1992, Lisenfeld, Volk & Xu 1996), the quenching of the radio emission due to inverse Compton (IC) losses via the CMB (scaling as ). In addition, the trend for higher redshift systems to be more luminous (a selection effect related to current sensitivity limits) may also lead to global changes in the properties of the sources actually detected (as compared to local, less luminous star forming galaxies that form the basis of the locally derived relation). An overall change in the SED of these systems might well be expected, and the differing time scales associated with the rise in the FIR and radio emission may be significant, particularly for vigorous starburst systems. Specific effects regarding the level of radio emission might occur via (i) evolving magnetic field strengths (Dunne et al. 2000), (ii) varying levels of free-free absorption (Rengarajan & Takeuchi 2001), (iii) further IC losses associated with the intense but local radiation environment and (iv) the possibility of significant “contamination” of high redshift star forming systems with co-existing, low-luminosity, “radio loud” AGN.
Until recently a study of the FIR/radio correlation at non-local redshifts has been difficult since it requires extremely deep and complementary observations in both the radio and far/mid-IR wavebands, together with spectroscopic redshifts of relatively faint sources. Like many other areas of astrophysics, the situation has recently been transformed by the wealth of publicly available data generated by deep multi-wavelength studies of the Hubble Deep Field (HDF). In this paper I investigate the nature of the FIR/radio correlation at moderate redshifts (up to assuming throughout the currently “preferred” cosmological model (, , km/sec/Mpc).

2 The ISO 15 micron and WSRT 1.4 GHz HDF-N Sample
A sample of 20 HDF-N sources was established from the following simple criteria: (i) they are detected by both the WSRT at 1.4 GHz (Garrett et al. 2000) and ISO at 15 micron (Aussel et al. 1999), and (ii) each WSRT/ISO source is independently identified with the same optical candidate with a measured redshift (as determined by Cohen et al. 2001). Details of the sample is presented in Table 1. The WSRT sources are all detected with a SNR . The ISO 15 micron sources are mostly drawn from the PRETI main source list (Aussel et al. 1999) but a few of the most significant (SNR ) detections presented in the PRETI supplementary source list are also included. No attempt was made to remove possible AGN candidates from the sample.
One limitation of this study is that the deep ISO measurements were made in the mid-infrared and it was therefore necessary to extrapolate the 15 micron measurements to 60 and 100 micron. This was achieved by constructing a SED based on the starburst galaxy M82 (this source has been extensively studied at all wave-bands including those that form the basis of our SED - the radio, mm, sub-mm, far, mid and near infrared bands). A k-correction (dependent on source redshift and our assumed SED) was also applied to both the mid-infrared and radio data. Note that for non-local redshifts the steepness of the Rayleigh-Jeans tail in the FIR makes the k-correction absolutely essential, without this the observed FIR-Radio correlation completely disappears (it is this same property that, in principle, makes the sub-mm/radio spectral index such a powerful redshift estimator). I adopt the FIR/radio ratio as quantified in the parameter defined by Condon (1992):
3 Results
Figure 1 shows a logarithmic plot of the FIR and radio luminosities for the HDF-N sample. A median-fit to the data indicates the linearity of the relation (the slope of the fit is 1.00 with a correlation coefficient of 0.93). This striking result strongly suggests that the FIR/radio correlation continues to apply at non-local, moderate redshifts. Note that the luminosities probed by our faint (but distant) sample extends the range (upwards) by two orders of magnitude compared to previous, “local” studies. The highest luminosity sources in Figure 1 also tend to be more distant.
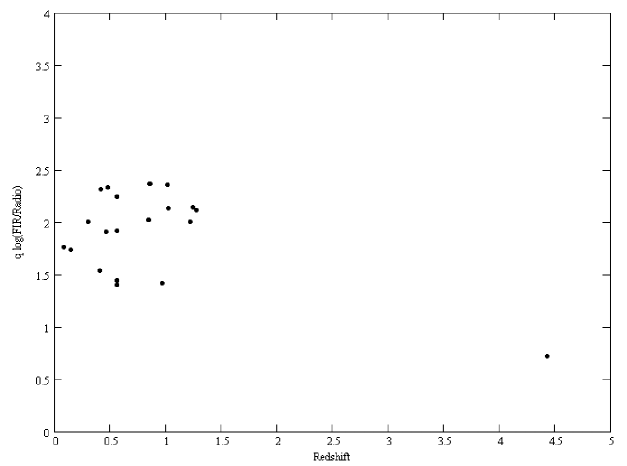
Figure 2 shows the value of plotted as a function of redshift. There is a clear clustering of sources around (excluding the radio-loud outliers). Given that the dominant error is the process of extrapolating the mid-infrared fluxes to the far-infrared via our assumed SED, this is remarkably similar to the value measured by Condon (1992) for local galaxies - . The absolute value of quoted here should not be over interpreted: for example repeating the analysis with an Arp 220 SED increases the value of to 2.3.
There is one obvious outlier observed in both Figure 1 and 2. This outlier (seen to the extreme right of both figures) corresponds to a source (VLA J123642+621331), and is widely believed to be an optically faint, dust obscured star forming galaxy, which also harbours an AGN (Waddington et al. 1999, Garrett et al. 2001, Brandt et al. 2001). The fact that it deviates from the FIR/radio correlation is entirely to be expected, and suggests that just as the locally derived correlation can distinguish between sources powered by AGN and star formation processes, the extended correlation can very likely do the same thing for moderate redshift sources.
4 Conclusions
The FIR/radio correlation appears to apply to the vast majority of the 20 HDF-N galaxies in our sample. There is no obvious evidence to suggest that the relation does not apply equally well, beyond . This result lends support to the idea (Carilli & Yun 2000) that the radio-to-submm spectral index is a useful redshift indicator for the optically faint, sub-mm and radio source population. In addition, it re-emphasises the crucial role that deep radio observations play as an unbiased estimator in studies of the star-formation history of the (obscured) early Universe.
Our analysis extends the FIR/radio correlation (in terms of source luminosity) by up to 2 orders of magnitude (as compared to local studies). In addition to the puzzle of just why the FIR/radio correlation is so tight in the local Unverse, it seems we must also consider why it continues to apply equally well to these more luminous and more distant systems. A more extensive investigation of the FIR/radio correlation at high redshift awaits much deeper SIRTF and ALMA infrared and sub-mm observations. Complimentary radio data will be essential and these depend critically on upgraded instruments such as those currently proposed (-MERLIN and EVLA). On longer time scales, next generation radio instruments, in particular the Square Km Array (SKA), will completely revolutionise our view of galaxy formation in the early Universe. SKA will detect even relatively feeble/normal ( few /yr) star forming galaxies out to any redshift that they might reasonably be expected to exist.
Acknowledgements.
I would like to thank the referee Min S. Yun for useful comments and suggestions. The Westerbork Synthesis Radio Telescope is operated by the ASTRON (Netherlands Foundation for Research in Astronomy) with support from the Netherlands Foundation for Scientific Research, NWO. The European VLBI Network is a joint facility of European and Chinese radio astronomy institutes funded by their national research councils.References
- (1) Aussel, H., Cesarsky, C.J., Elbaz, D., & Starck, J.L. 1999, A&A, 342, 313
- (2) Barger, A. J., Cowie, L. L., Sanders, D. B., Fulton, E., Taniguchi, Y., Sato, Y., Kawara, K., & Okuda, H. 1998, Nat, 394, 248
- (3) Brandt, W.N., Hornschemeier, A.E., Alexander, D.M., Garmire, G.P., Schneider, D.P., Broos, P.S., Townsley, L.K., Bautz, M.W., Feigelson, E.D., & Griffiths, R.E. 2001, AJ, 122, 1.
- (4) Carilli, C.L., & Yun, Min S. 2000, ApJ, 530, 618
- (5) Condon, J.J. 1992, ARA&A, 30, 575
- (6) Cohen, J.G., Hogg, D.W., Blandford, R., Cowie, L.L., Hu, E., Songaila, A., Shopbell, P., & Richberg, K. 2000, ApJ, 538, 29
- (7) Dunne, L., Clements, D.L., & Eales, S.A. 2000, MNRAS, 319, 813
- (8) Garrett, M.A., de Bruyn, A.G., Giroletti, M., Baan, W.A., Schilizzi, R.T. 2000, A&A 361, L41
- (9) Garrett, M.A., Muxlow, T.W.B., Garrington, S.T., Alef, W., et al. 2001, A&A 366, L5
- (10) Haarsma, D.B., Partridge, R.B., Windhorst, R.A., & Richards, E.A. 2000, ApJ, 544, 641
- (11) Helou, G. & Bicay, M. D. 1993, ApJ, 415, 93
- (12) Hughes, D.H., Serjeant, S., Dunlop, J., Rowan-Robinson, M., et al. 1998, Nat, 394, 241
- (13) Lisenfeld, U., Volk, H.J., & Xu, C. 1996, A&A, 314, 745
- (14) Madau, P., Fergusson, H.C., Dickinson, M.E., Giavalisco, M., Steidel, C.S. & Fruchter, A. 1996, MNRAS, 283, 1388
- (15) Rengarajan, T.N. & Takeuchi, T.T. 2001, PASJ, 53, 433
- (16) van der Kruit, P.C. 1973, A&A, 29, 263
- (17) Waddington, I., Windhorst, R.A., Cohen, S.H., Partridge, R.B., et al. 1999, ApJ, 526, L77