X-ray Line Emission in Hercules X-1
Abstract
We find line emission from the hydrogen- and/or helium-like ions of Ne, O, N and C in the low and short-on states of Her X-1, using the XMM-Newton Reflection Grating Spectrometer. The emission line velocity broadening is km s-1. Plasma diagnostics with the Ne IX, O VII and N VI He lines and the radiative recombination continua of O VII and N VII, indicate the gas is heated by photoionization, with an electron temperature of eV. We use spectral models to measure element abundance ratios of , , and times solar, which quantify CNO processing in HZ Her. Photoexcitation and high-density effects are not differentiated by the measured He lines, as shown by calculations that use previous UV photometry. We set limits on the location of the line emission region, and find an electron density cm-3. The narrow emission lines can be attributed to reprocessing in either an accretion disk atmosphere and corona or on the X-ray illuminated face of HZ Her. In the main-on state, the bright continuum only allows the detection of interstellar absorption, plus O VII He emission lines with km s-1 and complex profiles. Other broad lines may be present. The broad lines may originate in a region near the pulsar magnetosphere. In such a case, periodic occultations of the Her X-1 magnetosphere must occur with 35 d phase, consistent with the precession of the accretion disk. Fe L lines are not detected.
keywords:
X-rays: binaries — line: formation — line: identification — pulsars: individual — accretion, accretion disks1 Introduction
In Her X-1, X-rays are being generated by the infall of plasma from a star (HZ Her) onto a neutron star ([\astronciteReynolds et al.1997]). The neutron star pulsates in the X-ray band with period ([\astronciteTananbaum et al.1972]). The thermal emission observed in the soft X-ray band, the large luminosity of the system ( erg s-1), and the observed broad UV emission lines ([\astronciteBoroson et al.1997]), all indicate the mass transfer is being mediated by an accretion disk. Her X-1 is unusually well placed for soft X-ray and UV observations, since it is kpc above the galactic plane while at a distance of kpc ([\astronciteReynolds et al.1997]). An orbital period of can be measured from X-ray eclipses ([\astronciteTananbaum et al.1972]).
One of our main goals is to find the spectral signatures of a precessing accretion disk. The Her X-1 system goes through high and low X-ray flux states in an almost periodic fashion, with a d pseudo-period ([\astronciteGiacconi et al.1973]). Variability as a function of has also been observed in the optical light curves ([\astronciteGerend & Boynton1976]), X-ray pulse shapes ([\astronciteDeeter et al.1991]), X-ray dips ([\astronciteScott & Leahy1999]), and X-ray spectra ([\astronciteRamsay et al.2002] and this paper). The -phase has been associated with disk precession ([\astroncitePetterson et al.1991, \astronciteScott et al.2000]). Only a handful of other X-ray sources are known to exhibit such pseudo-periodicities, and Her X-1 is the brightest of the group. The binary system is being observed nearly edge-on, at an inclination angle of . Models of the disk atmosphere and corona ([\astronciteJimenez-Garate et al.2001]) show that its line emission is detectable, especially at large and in binaries with large ( cm) disks. Her X-1 is also a prime object to study the interaction of an accretion disk with a strong magnetic field ( G from [\astroncitedal Fiume et al.1998], [\astronciteTruemper et al.1978]).
2 Spectroscopy with RGS
Three observations with the XMM-Newton Reflection Grating Spectrometer (), during the low, short-on and main-on states, reveal recombination line and continuum emission in Her X-1. We find dramatic spectral changes through the 35 d cycle, including changes in the continuum, line fluxes, and line widths. The high resolution X-ray spectra unveil two new components inside the Her X-1 system:
-
1.
A photoionized narrow-line region, with velocity broadening km s-1. The density of this material is cm, with the lowest temperatures in the K range. We set an upper bound for the radius of this region of cm, just outside the cm Roche lobe radius.
-
2.
A photoionized broad-line region evidenced by O VII He lines with velocity broadening km s-1. If the broadening is due to orbital velocity, this region is between cm. We estimate the density of this region to be cm-3.
2.1 Low and short-on states: narrow line emission
The low and short-on state spectra consist of a power-law continuum plus radiative recombination () emission. The brightest line features have a velocity broadening km s-1. The count rate in the short-on is twice as that in the low state, for both continuum and most lines. The N VI, O VII, and Ne IX triplet ratios indicate the gas is photoionized (section 3). The power-law continuum is probably due to Compton scattering of the neutron star X-rays in the accretion disk corona and/or on the face of the companion.
The variation of the X-ray line flux with 35 d phase, vis-a-vis the expected accretion disk inclination from [*]mjimenez-C1:sco00, suggests that at least half of the line emission originates on the face of the companion. If the accretion disk atmosphere and corona are the only source of X-ray lines, then we expect the outer-disk inclination to be in disagreement with the [*]mjimenez-C1:sco00 values. As the disk precesses from to , the observed lines should increase their flux and broadening, because the inner-disk becomes unobstructed by the outer-disk ([\astronciteJimenez-Garate et al.2001]). According to the from [*]mjimenez-C1:sco00, the disk was more edge-on during the short-on than during the low state observation. If the line emission originates on the HZ Her, this can be explained by shadowing from the disk.


2.2 The main-on: magnetosphere emission?
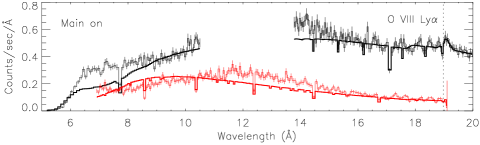
The main-on state in the 5–38 Å band is dominated by a smooth continuum and a broad continuum ”bump” previously identified with Fe L line emission (see figure 2). Most of the soft X-ray continuum originates from reprocessing on the disk, judging by its sinusoidal pulse profile. The sharply peaked pulse profile observed below Å ([\astronciteRamsay et al.2002]), indicates the emission region is compact ( cm), and near the neutron star. The 10–15 Å ”bump” does not contain any obvious Fe L lines. The continuum shape is complex and has not been successfully fitted yet with a model.
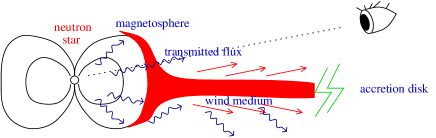
Weaker, discrete spectral features are present as well. A surprisingly broad O VII He line complex, with kms-1, is centered on the line, and is consistent with the line ratios observed in the low and short-on states. A weaker, similarly broad N VII Ly line may also be present. High density plasma funneled out of the disk by the magnetic field forms a magnetospheric shell which may produce recombination emission as it is blasted by pulsar X-rays. If the magnetospheric ions are fully stripped of electrons, photons which are Compton scattered by those electrons may illuminate the neighboring disk and produce recombination (see figure 3). A 1s-2p resonant absorption feature from atomic O is detected. A neutral O edge is mostly instrumental in nature. The second order effective area also seems overestimated by the calibration below Å, if we take the first order as reference. There is marginal evidence for a complex line shape, possibly a P Cygni with km s-1, in O VIII Ly (figure 2). P Cygni profiles for winds with velocities of km s-1 have been found by [*]mjimenez-C1:chi00 in the UV. The upper bounds for the fluxes of unresolved lines are below those observed in the low and short-on states, for many of the lines (see figure 1). This may be due to an orbital phase () dependence of the line fluxes, since the main-on observation was performed at , while the other two observations were obtained at , suggesting the narrow lines originate on HZ Her.

3 Plasma Diagnostics
We use five kinds of spectral diagnostics:
-
1.
The ratio in He-like ion line triplets. The triplet consists of a resonance (), intercombination () and a forbidden () line. The plasma is found to be dominated by photoionization since the . In contrast, collisional plasmas have ([\astronciteLiedahl1999]).
-
2.
The line ratio as density diagnostic in He-like ions. When the density is higher than some threshold, , while in the low density limit, ([\astroncitePorquet & Dubau2000]). We observe .
-
3.
The ratio as UV radiation probe in He-like ions. Excitation by UV photons can also explain ([\astronciteMewe & Schrijver1978], [\astronciteKahn et al.2001]). We find photoexcitation competes with electron impact excitation. Using UV photometry from [*]mjimenez-C1:bor97, we set cm for the radius of the line emission region.
-
4.
Temperature diagnostics with the radiative recombination continuum () ([\astronciteLiedahl & Paerels1996]). The width of the is proportional to the electron temperature. For O VII and N VII, we find eV and eV, respectively. Model calculations with v.2.1d ([\astronciteKallman & McCray1982]) show eV for N VII and O VII.
-
5.
Using the ionization parameter, and assuming thermal and ionization balance in the optically thin case, we constrain the density to cm-3 for the narrow line region, and cm-3 for the broad line region of the main-on state. We use the limits on the distance to the pulsar that we set from photoexcitation and from velocity broadening.
4 Emission measure analysis
This analysis allows us to measure or set limits on the density, geometry, and element abundances of the emission regions. We use plasma and spectral models together with a phenomenological emission measure distribution to fit the observed line fluxes. The emission measure, , equals the volume times the density squared. The is proportional to the recombination line flux. The may vary as a function of the ionization parameter . To fit the line fluxes, we need the differential emission measure (as defined in [\astronciteLiedahl1999]). We use recombination rates calculated by Liedahl (private communication) with the atomic code ([\astronciteKlapisch et al.1977]).
In one model, the emission measure is constant with respect to , while in a second model, we let the vary as a power law of . The results of model 1, shown in figure 4, show that element abundance ratios differ from the solar values. The of N and O is seen to depend on the charge state, invalidating model 1. The line flux variability, however, is well-represented by figure 4. Unlike the flat- model 1, the power-law model 2 achieves self-consistency, and from it, element abundance ratios are extracted. We find , and times solar for the low state data, using the solar abundances from [*]mjimenez-C1:wil00. Nitrogen is significantly enriched, indicating CNO processing in HZ Her. A lower limit of cm-3 is estimated from model 1 for the broad line region, by using the maximum volume deduced from velocity broadening.

5 Conclusions
The X-ray emission lines from Her X-1 are weak, but they provide a wealth of information on gas which is too hot to observe at other wavelengths and which may be very close to the neutron star. By use of models, the X-ray spectrum yields more accurate element abundance ratios between C, N, O, and Ne, constraining the historical nuclear burning in HZ Her. The temperature can be measured, and limits on the density and geometry of the gas are set. Two dynamically distinct photoionized regions are identified. A low dispersion velocity region may be the accretion disk atmosphere and corona, or the illuminated face of HZ Her. The high dispersion velocity region, albeit weakly detected, may be dense material in the magnetosphere or its neighboring inner-disk.
The high resolution X-ray spectrum of Her X-1 varies dramatically with 35 d phase, presumably due to the precession of the accretion disk. This spectral variability may help us determine the inclination-dependence of spectra from other X-ray binaries with disks.
Many features known to be present in the spectrum of photoionized gases have not been detected due to the low signal-to-noise of these data. In particular, the Lyman series lines provide constraints on the column density and line optical depth, and accurate measurements of the verify the validity of the plasma equilibrium calculations used here. This will allow us to identify the source of the line emission and further investigate the environment around accreting neutron stars.
References
- [\astronciteBoroson et al.1997] Boroson, B., Blair, W. P., Davidsen, A. F., Vrtilek, S. D., Raymond, J., Long, K. S., McCray, R. 1997, ApJ 491, 903
- [\astronciteChiang2001] Chiang, J. 2001, ApJ 549, 537
- [\astroncitedal Fiume et al.1998] dal Fiume, D. et al. 1998, A&A 329, L41
- [\astronciteDeeter et al.1991] Deeter, J. E., Boynton, P. E., Miyamoto, S., Kitamoto, S., Nagase, F., Kawai, N. 1991, ApJ 383, 324
- [\astronciteGerend & Boynton1976] Gerend, D. & Boynton, P. E. 1976, ApJ 209, 562
- [\astronciteGiacconi et al.1973] Giacconi, R., Gursky, H., Kellogg, E., Levinson, R., Schreier, E., & Tananbaum, H. 1973, ApJ 184, 227
- [\astronciteKahn et al.2001] Kahn, S. M., Leutenegger, M. A., Cottam, J., Rauw, G., Vreux, J.-M., den Boggende, A. J. F., Mewe, R., Güdel, M. 2001, A&A 365, L312
- [\astronciteKallman & McCray1982] Kallman, T. R. & McCray, R. 1982, ApJS 50, 263
- [\astronciteKlapisch et al.1977] Klapisch, M., Schwab, J. L., Fraenkel, J. S., & Oreg, J. 1977, Opt. Soc. Am., 61, 148
- [\astronciteLiedahl & Paerels1996] Liedahl, D. A. & Paerels, F. 1996, ApJL 468, L33
- [\astronciteLiedahl1999] Liedahl, D. A. 1999, in X-ray Spectroscopy in Astrophysics, EADN School proceedings, 1999, ed. J. A. van Paradijs, J. A. M. Bleeker, 189
- [\astronciteMewe & Schrijver1978] Mewe, R. & Schrijver, J. 1978, A&A 65, 99
- [\astronciteJimenez-Garate et al.2001] Jimenez-Garate, M. A., Raymond, J. C., Liedahl D. A. & Hailey, C. J. 2001, ApJ 558, 448
- [\astroncitePetterson et al.1991] Petterson, J. A., Rothschild, R. E., & Gruber, D. E. 1991, ApJ 378, 696
- [\astroncitePorquet & Dubau2000] Porquet, D. & Dubau, J. 2000, ApJS 143, 495
- [\astronciteRamsay et al.2002] Ramsay G., Zane S., Jimenez-Garate M., den Herder J., & Hailey C., 2002, MNRAS submitted
- [\astronciteReynolds et al.1997] Reynolds, A. P., Quaintrell, H., Still, M. D., Roche, P., Chakrabarty, D., & Levine, S. E. 1997, MNRAS 288, 43
- [\astronciteScott & Leahy1999] Scott, D. M. & Leahy, D. A. 1999, ApJ 510, 974
- [\astronciteScott et al.2000] Scott, D. M., Leahy, D. A., & Wilson, R. B. 2000, ApJ 539, 392
- [\astronciteTananbaum et al.1972] Tananbaum, H., Gursky, H., Kellogg, E. M., Levinson, R., Schreier, E., & Giacconi, R. 1972, ApJL 174, L143
- [\astronciteTruemper et al.1978] Truemper, J., Pietsch, W., Reppin, C., Voges, W., Staubert, R., & Kendziorra, E. 1978, ApJL 219, L105
- [\astronciteWilms et al.2000] Wilms, J., Allen, A., & McCray, R. 2000, ApJ 542, 914