High Resolution X-Ray Spectroscopy of 14 Cooling-Flow Clusters of Galaxies Using the Reflection Grating Spectrometers on XMM-Newton
Abstract
We present high resolution X-ray spectra of 14 cooling-flow X-ray clusters and groups obtained with the Reflection Grating Spectrometers (RGS) on XMM-Newton. The spectra exhibit line emission from a number of Fe L charge states as well as O VIII, Mg XII, Ne X, Si XIV & XIII, N VII, and C VI. All spectra show a deficit of soft X-ray lines predicted from the isobaric multi-phase spectral model as compared with morphological mass deposition rates from spatially-resolved spectroscopy with the European Photon Imaging Cameras (EPIC). We present some weak detections of plasma several times cooler than the ambient cluster temperatures. The results further suggest that either morphological mass deposition rates systematically overestimate the actual cooling rate or the emission measure of cooling-flows has a much steeper distribution than that predicted by a simple isobaric multi-phase model. We briefly discuss some modifications to the cooling-flow process.
keywords:
XMM-Newton – RGS – X-ray Spectroscopy – Cooling-Flow – Clusters of Galaxies1 Introduction
It has long been recognized that the cores of clusters of galaxies have sufficient X-ray luminosity to cool 10 to 1000 solar masses of keV plasma every year (e.g. [\astronciteFabian & Nulsen1977], [\astronciteCowie & Binney1977], [\astronciteFabian1994]). The details of the cooling process are still debated, however, in most models parcels of cooling plasma collect at the center of the cluster, forming what is referred to as a cooling-flow. Direct evidence for cooler gas in the cores of clusters is indeed well-established ([\astronciteCanizares et al.1979], [\astronciteCanizares et al.1982], [\astronciteMushotzky & Szymkowiak1988]).
If the gas were to cool homogeneously, the density profile of the cluster core would be relatively steep. That is inconsistent with imaging observations ([\astronciteJohnstone et al.1992]), which has led to the conclusion that the cooling gas must condense locally in smaller clouds distributed over a large volume (tens of kpc), i.e. in a multi-phase medium. However, even ignoring the details of the resulting spatial distribution, simple thermodynamic arguments show that the integrated X-ray spectrum of such a cooling flow can be robustly predicted. If the blobs of gas cool in thermal isolation at constant pressure, and the dominant energy loss mechanism is via X-ray radiation, then the luminosity radiated per unit temperature interval must be proportional to the mass deposition rate, :
| (1) |
where is Boltzmann’s constant, and is the mean molecular weight per particle. The only free parameter is , which can be estimated from an X-ray image of the cluster core. The resulting spectrum can be calculated using a collisional equilibrium spectral synthesis model with an assumed set of elemental abundances, and normalizing the contribution in each temperature interval as given in Equation (1).
Data acquired by the Reflection Grating Spectrometer on XMM-Newton have enabled this robust spectral prediction to be quantitatively tested for the first time. Surprisingly, the observed spectra reveal a remarkable systematic deficit of emission at low temperature, as compared to the multi-phase model ([\astroncitePeterson et al.2001], [\astronciteTamura et al.2001], [\astronciteKaastra et al.2001], [\astronciteXu et al.2002]). Emission is observed at the expected levels for temperatures just below the ambient temperature of the cluster, (down to roughly ), but not for significantly lower temperatures. This result has been confirmed with medium resolution spatially-resolved spectroscopy using XMM-Newton EPIC and Chandra observations where spectral fits have yielded significantly smaller ’s than expected ([\astronciteDavid et al.2001], [\astronciteBöhringer et al.2001], [\astronciteMolendi & Pizzolato2001], [\astronciteSchmidt, Allen, & Fabian2001], [\astronciteEttori et al.2002]). The interpretation of this effect is still unclear, although a number of possible physical mechanisms for suppressing the low temperature X-ray emission have been suggested (e.g. [\astroncitePeterson et al.2001], [\astronciteFabian et al.2001]). In this presentation, we review the results of RGS observations for 14 separate cooling-flow clusters, sampling a wide range in mass deposition rate. A companion analysis of the EPIC data for the identical sample of clusters is presented in [*]jpeterson-B3:kaastra2.
Diffuse X-ray Spectroscopy with the RGS
We briefly comment on the spectral capabilities of the RGS, and the analysis of RGS data for extended sources. Since, the RGS is a slitless spectrometer ([\astronciteden Herder et al.2001]), its spectral resolution is degraded for extended sources. Nevertheless, in contrast to the transmission grating instruments on Chandra, its dispersion is sufficiently high that it currently provides the highest spectral resolution for the soft X-ray band for sources of arcminute size. The spectral resolution for an extended source larger than 10 arcseconds is given by
| (2) |
At this resolution, one can still unambiguously resolve the most prominent resonance line contributions from all charge states of the most abundant elements. Of particular importance is the the Fe L complex, which can be resolved into its emission line contributions from Fe XXIV through Fe XVII (Li-like to Ne-like). The RGS resolution is several times higher than a CCD instrument in the Fe L region for a typical source size.
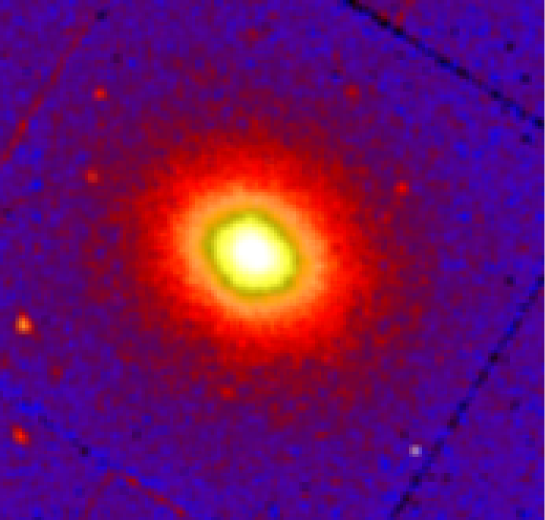
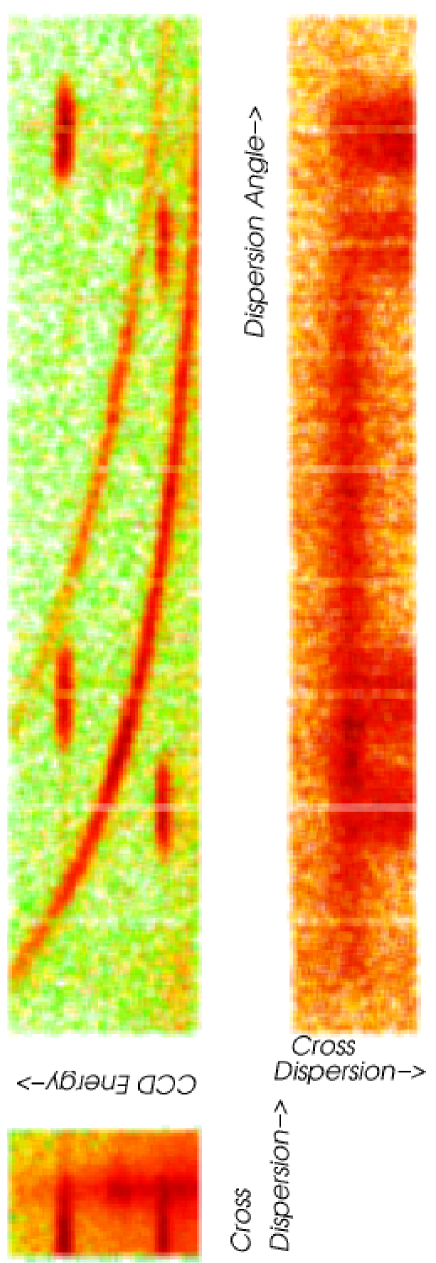
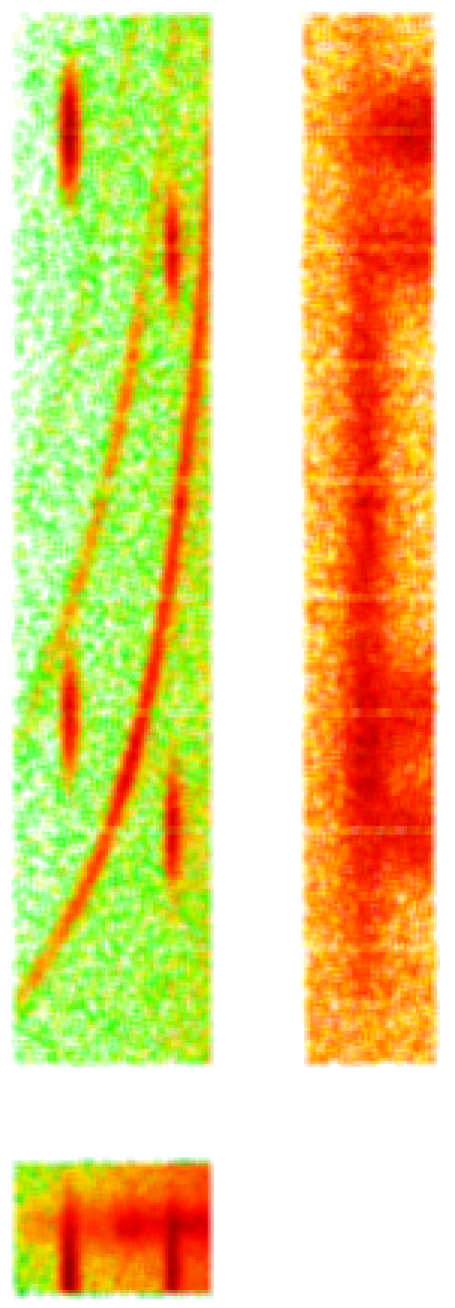
The combined effective area of the two RGS instruments is . The field of view is 5 arcminutes in the cross-dispersion direction and 1 degree in the dispersion direction. This is sufficient to capture the entire cooling-flow region and produce a well-resolved spectrum with a 50 ks exposure for a typical cluster. The instrument response for an extended source is the convolution of the spatial distribution of each emission line and the off-axis response for a given data selection region. To properly account for these effects, we use a novel Monte Carlo code for all spectral fitting analyses ([*]jpeterson-B3:peterson3). A full spectral-spatial model of the source is used to set limits on the cooling-flow model. An example of the RGS data and corresponding EPIC-MOS data is shown in Figures 1 and 2. Figure 3 shows a Monte Carlo simulation for the same data set.
The Soft X-ray Cooling-Flow Problem
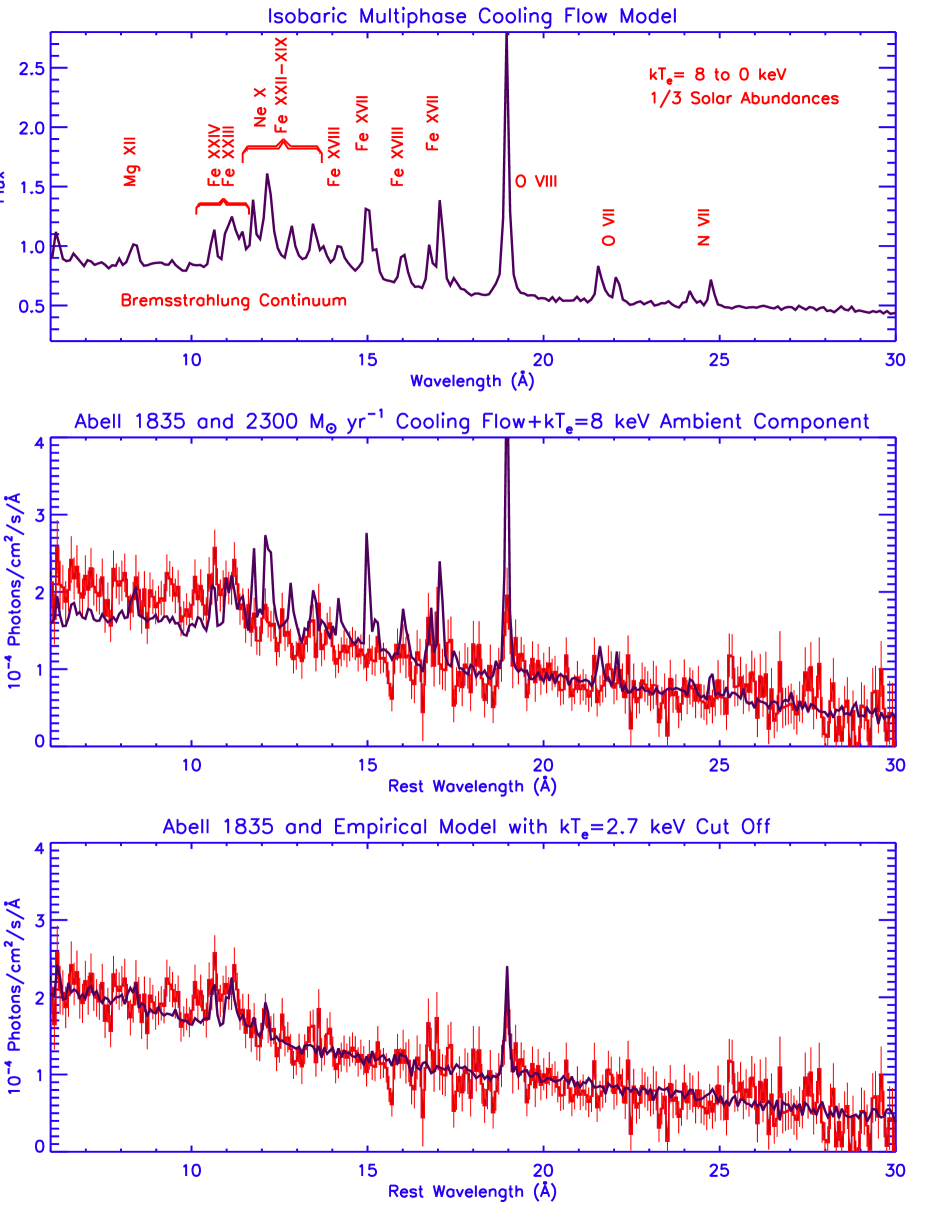
The failure of the isobaric multiphase cooling flow model to adequately describe the RGS data is illustrated for one of the most massive cooling flow sources, Abell 1835, in Figure 4. The predicted spectrum (at the resolution of the RGS for this source) is shown in the top panel. The model predicts detectable emission lines from the complete range of Fe L charge states, as well as from He-like and H-like charge states of N, O, Ne and Mg. The comparison of this model with the observed RGS spectrum of Abell 1835 is shown in the second panel. As can be seen, the fit is reasonable for the higher ionization Fe L lines (Fe XXIV and Fe XXIII), but the model vastly overpredicts the emission line intensities for the lower charge states, especially Fe XVII.
The final panel shows an empirical parameterization, where the isobaric model temperature distribution has been arbitrarily truncated at temperatures below . This model has no clear physical motivation, but it does provide a good fit to the data. Note that it reproduces the emission from Fe XXIV and Fe XXIII by the two line blends at 10.6 and 11.2 roughly at the predicted value of .
Previous, lower spectral resolution X-ray observations of cooling flow clusters had provided hints of this problem - a deviation from simple model predictions at the lowest energies. However, the discrepancies to model fits in those cases were generally interpreted as evidence for absorption by cool clouds embedded in the cooling flow ([\astronciteWhite et al.1991]). For the RGS data, we can measure the intensities of the emission lines individually. It is clear from the raw data that absorption cannot explain this effect - the low energy lines are too weak, while the lower energy continuum is predicted correctly. Further, the RGS data make it clear that the failure of the model cannot be ascribed to the assumed elemental abundances. In particular, we see a deficit of low temperature emission lines in the Fe L spectrum alone.
There is, however, clear detections of large quantities of plasma at temperatures above at roughly the predicted quantity. This is very difficult to reconcile with any theoretical model. This problem is essentially distinct from the classic cooling-flow problem of the failure to detect the final products of cooling-flows, molecular clouds and stars. In fact, recent detections of CO emission by [*]jpeterson-B3:edge from massive cooling-flows now suggest that the end products of cooling may indeed be present. However, some unforeseen process must be suppressing the cooling radiation in the soft X-ray band.
Other Clusters in the Sample
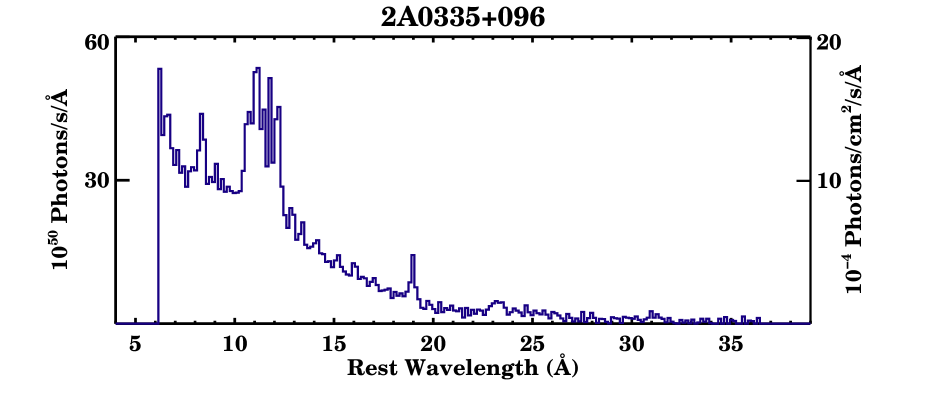
Similar results for the full sample of 14 clusters are presented in [*]jpeterson-B3:peterson2. Generally, hot (several keV) clusters exhibit spectra similar to Abell 1835 where no emission lines are detected below 3 keV. Intermediate temperature clusters ( keV) exhibit spectra similar to that shown in Figure 5 for the cluster 2A0335+096. Prominent emission lines from Fe XXII-Fe XXIV are very apparent between 10 and 12 . Weaker emission lines are also detected from the lower charge states, however they become increasingly more discrepant with the predictions as the temperature at which they are produced drops to lower and lower values. Since emission from essentially all Fe L ions is detected for these lower temperature clusters, the spectra clearly demonstrate the need for a continuous distribution of temperatures - but not the unique distribution predicted by the isobaric cooling flow models.
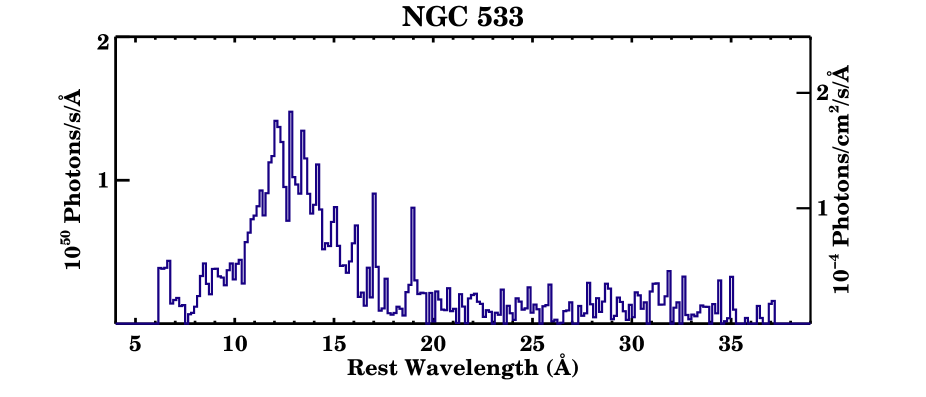
A spectrum from a 1 keV cool group of galaxies, NGC 533 is shown in Figure 6. Here again, there is evidence for significant cooling below ambient temperatures. The ratio of Fe XVII to Fe XVIII, however, is roughly 1, while the prediction for the standard isobaric model is closer to 3. Our sample includes 14 clusters, which differ in inferred cooling-flow mass deposition rate by three orders of magnitude. In every case, the isobaric cooling flow models overpredicts the observed spectrum at the lowest temperatures. It appears that the total soft X-ray luminosity is roughly consistent with the predicted morphological mass deposition rate, but that the emission measure distribution is considerably steeper than this simple model would seem to require.
Empirical Parameterization
We are able to fit the observed spectra reasonably well, however, using a variety of empirical parametrizations. One that works especially well involves a simple modification of Equation (1):
| (3) |
This means, for example, that at temperatures of of the ambient temperature of the cluster, the X-ray luminosity is weaker than predicted by the model by a factor of 4 or more. The integrated soft X-ray luminosity is therefore consistent with that needed for massive cooling-flows to within a factor of 2, but the results are clearly discrepant with the standard multi-phase model at the lowest temperatures. All clusters in the sample appear to follow this trend.
The General Theoretical Problem
The cooling time for a constant pressure hot X-ray plasma is proportional to the temperature squared divided by the cooling function. This implies that it would take 6 times longer for Abell 1835 to cool from 8 keV to 3 keV than to cool from 3 to 0 keV. It is extremely perplexing why there is no evidence for cooling after it has cooled 85 of the way. The lack of emission lines at lower temperatures could imply that either there is no gas cooling or it could also mean that the cooling rate at lower temperature is much faster than predicted. This could result from mixing processes which alter the rate of cooling at each temperature or from additional coolants which carry energy away in addition to the X-radiation.
The primary difficulty in finding a solution to this puzzle is that it is difficult to find a dynamical time-scale that would be so closely connected to the cooling time, which could vary by orders of magnitude depending on the local plasma conditions. Various ideas have been suggested, but none appears to naturally explain the observed phenomena. Mixing with cool clouds ([\astronciteBegelman & Fabian1990]) condensed from the cooling-flow could liberate some energy at other wavelengths, posssibly in the UV, as suggested by H observations (e.g. [\astronciteHeckman et al.1989], [\astronciteCrawford et al.1999]) and O VI ([\astronciteOegerle et al.2001]), or through IR dust emission (e.g. [\astronciteEdge et al.1999], [\astronciteAllen et al.2001]). However, one would also naively expect copious soft X-ray emission from the cloud interfaces with the hotter gas. Some fraction of the thermal energy could be liberated in Alfvén waves or mildly relativistic particles as the magnetic field compresses. The very field lines that isolate the cooling blobs initially may reconnect and allow for modification of the cooling rate at each temperature. Finally, some heating models (e.g. by AGN outflows [\astronciteTabor & Binney1993], [\astronciteDavid et al.2001]) could provide the necessary energy input to prevent the cooling, but they need to be finely tuned to work in just the right way for such a diverse sample of clusters.
The solution to the soft X-ray problem could be complex and it could be difficult to distinguish between the alternatives. Future work connecting the X-ray observations to other wavelength observations, further empirical quantification of the temperature distributions in cooling-flows, and considerably more theoretical progress may result in a more complete understanding of the cooling process.
Acknowledgements.
This work is based on observations obtained with XMM-Newton, an ESA science mission with instruments and contributions directly funded by ESA Member States and the USA (NASA).References
- [\astronciteAllen et al.2001] Allen et al. 2001, MNRAS 322, 589.
- [\astronciteBegelman & Fabian1990] Begelman, M. & A. C. Fabian 1990, MNRAS 244, 26.
- [\astronciteBöhringer et al.2001] Böhringer, H. et al. 2001, A & A 365, 181.
- [\astronciteCanizares et al.1979] Canizares, C. R. et al. 1979, ApJ 234, L33.
- [\astronciteCanizares et al.1982] Canizares, C. R. et al. 1982, ApJ 262, L32.
- [\astronciteCowie & Binney1977] Cowie, L. L. & J. Binney 1977, ApJ 215, 723.
- [\astronciteCrawford et al.1999] Crawford et al. 1999, MNRAS 306, 857.
- [\astronciteDavid et al.2001] David, L. P. et al. 2001, ApJ 557, 546.
- [\astronciteEdge et al.1999] Edge et al. 1999, MNRAS 306, 599.
- [\astronciteEdge2001] Edge, A. C. 2001, MNRAS 328, 762.
- [\astronciteEttori et al.2002] Ettori et al. 2002, MNRAS, in press
- [\astronciteFabian & Nulsen1977] Fabian, A. C. & P. E. J. Nulsen 1977, MNRAS 180, 479.
- [\astronciteFabian1994] Fabian, A. C., ARA&A 1994, 32, 277.
- [\astronciteFabian et al.2001] Fabian, A. C. et al., MNRAS 320, 20.
- [\astronciteHeckman et al.1989] Heckman et al. 1989, ApJ 338, 48.
- [\astronciteden Herder et al.2001] den Herder et al., A & A 365, 7.
- [\astronciteJohnstone et al.1992] Johnstone, R. M., MNRAS 255, 431-440.
- [\astronciteKaastra et al.2001] Kaastra, J. S. et al. 2001, A & A 365, 99.
- [\astronciteKaastra et al.these proceedings] Kaastra, J. S. et al., these proceedings
- [\astronciteMolendi & Pizzolato2001] Molendi & Pizzolato 2001, ApJ 560, 194.
- [\astronciteMushotzky & Szymkowiak1988] Mushotzky, R. F. & Szymkowiak 1988, in Clusters of Galaxies, Vol. 299, 53.
- [\astronciteOegerle et al.2001] Oegerle et al. 2001, ApJ 560, 187.
- [\astroncitePeterson et al.2001] Peterson, J. R. et al. 2001, A & A 365, 104.
- [\astroncitePeterson et al.in preparation] Peterson, J. R. et al., in preparation.
- [\astroncitePeterson, Jernigan & Kahnin preparation] Peterson, J. R., J. G. Jernigan, & S. M. Kahn, in preparation.
- [\astronciteSchmidt, Allen, & Fabian2001] Schmidt, R. W., Allen, S. W., & A. C. Fabian, MNRAS 327, 1057.
- [\astronciteTabor & Binney1993] Tabor, G. & J. Binney 1993, MNRAS 263, 123.
- [\astronciteTamura et al.2001] Tamura, T. et al. 2001, A & A 365, 87.
- [\astronciteWhite et al.1991] White, D. A. et al. 1991, MNRAS 252, 1991.
- [\astronciteXu et al.2002] Xu, H. et al. 2002, astroph-0110013; also Kahn, S. M. et al., these proceedings