Molecular Hydrogen in the Lagoon:
H2 line emission from Messier 8
Abstract
The 2.12m v=1–0 S(1) line of molecular hydrogen has been imaged in the Hourglass region of M8. The line is emitted from a roughly bipolar region, centred around the O7 star Herschel 36. The peak H2 1–0 S(1) line intensity is . The line centre emission velocity varies from km in the SE lobe to km in the NW lobe. The distribution is similar to that of the CO J=3–2 line. The H2 line appears to be shock-excited when a bipolar outflow from Herschel 36 interacts with the ambient molecular cloud. The total luminosity of all H2 lines is estimated to be and the mass of the hot molecular gas (without any correction for extinction).
1 School of Physics, University of New South Wales,
Sydney, NSW 2052
2 School of Cosmic Physics, Dublin Institute
for Advanced Studies, 5 Merrion Square, Dublin 2, Ireland
M.Burton@unsw.edu.au
Keywords: infrared: ISM—ISM: HII regions—ISM: individual (M8)—ISM: molecules—molecular processes—shock waves—stars: formation.
1 Introduction
The Lagoon Nebula, Messier 8, is an HII region centred on the stellar cluster NGC 6523. It is embedded within a molecular cloud which extends to the young ( years old) star cluster NGC 6530, to its east (Lada et al. 1976). Star formation is presumed to have proceeded from NGC 6530 and is now active in M8. Within M8’s core lies the O7V star Herschel 36 (Woolf 1961), which has created a blister-type HII region, the Hourglass. This visually distinctive nebula is extended EW and NS, and lies E of Herschel 36. The Hourglass is embedded within an extended HII region, in extent, which is ionized by two O stars, HD 165052 and 9 Sgr (Woolf 1961, Lada et al. 1976). Nearby to Herschel 36 are a number of obscured sources, first observed in the near–IR by Allen (1986). Woodward et al. (1990) have designated them KS1 to KS5. Together, they may form a cluster of hot stars, analogous to the Trapezium in the Orion Nebula (M42), where is the dominant member. In the mid–IR MSX111see http://irsa.ipac.caltech.edu/ for details. sky survey, this region appears as bright, extended source, with a 21m continuum flux of 960 Jy. This source is also prominent in sub–mm (Tothill 1999) and mm (Richter, Stecklum & Launhardt 1998) wavelength continuum. Nearby to Herschel 36, narrow band optical imaging with the HST reveals an object reminiscent of the proplyds in the Orion Nebula—a star within a bow-shock arc, whose apex is pointed towards Herschel 36 (Stecklum et al. 1998). It is presumed to be an externally ionized circumstellar disk. These authors also estimate the distance to M8 to be 1.8 kpc, based on the association with NGC 6530.
Of particular interest to this paper are the observations by White et al. (1997) of intense CO line emission from M8. They found the peak CO J=3–2 intensity to be over 100 K, making it the second brightest CO line source known. The CO J=3–2 and 4–3 lines were mapped and found to have a loose, bipolar structure, extending NW–SE from Herschel 36. Taking the broad CO line profiles (extending over 20 km ), and the presence of a jet-like object extending SE of Herschel 36 in HST images (Stecklum et al. 1995), it seems likely that there is a molecular outflow in the core of M8. If so, it would be expected for there to be molecular hydrogen line emission as well, both shocked (from the deceleration of the outflow by the ambient cloud) and fluorescent (excited by far–UV photons from Herschel 36). However, White et al. (1997) also searched for the near–IR H2 v=1–0 S(1) line in M8, but did not detect it. In this paper we report more sensitive observations for H2 emission from M8, and find that there is indeed excited H2 line emission from this source.
2 Observations and Data Reduction
The Hourglass region of the Lagoon Nebula, Messier 8, was imaged on 1997, July 22, using the IRIS 1–2.5m camera, in conjunction with the University of New South Wales Infrared Fabry-Pérot etalon (UNSWIRF, Ryder et al. 1998), on the 3.9-m Anglo Australian Telescope (AAT). The UNSWIRF etalon has a FWHM spectral resolution of , a pixel size of and a circular field of view. It is scanned through a spectral line of interest in order to obtain an emission line image of a source, with minimal contamination from any continuum radiation present. It also permits limited kinematic information to be obtained, through the emission velocity of the line centre across the field of view.
The H2 1–0 S(1) (2.1218m) line was observed. Following a rapid scan to determine the plate spacing for the line centre, three on-line plate spacings were used for imaging, spaced by , together with an off-line setting, to the blue. Integration times were two minutes per plate spacing, and in addition, a sky frame, N, was obtained immediately after each source frame.
The star BS 6748 (K=4.57 mags.) served as the flux standard, and was imaged at each etalon spacing. The absolute accuracy in flux calibration using a Fabry-Pérot etalon is around 30%. A diffused dome lamp provided a flat field for each etalon spacing. An arc lamp was scanned through a free spectral range in order to wavelength calibrate the etalon response for each pixel of the array.
Data reduction was undertaken using a custom software package using IRAF222Image Reduction and Analysis Facility (see http://www.iraf.noao.edu).. Frames are linearised, flat-fielded using a dome flat at the appropriate plate spacing, cleaned of bad pixels, sky-subtracted, shifted to align stars in each frame, smoothed and the off-line frame subtracted from each on-line frame (having been appropriately scaled to minimise residuals from the subtraction process). Stacking of the three on-line frames produces a data cube, which is fitted, pixel-by-pixel, with the instrumental profile (a Lorentzian), to yield a line image. A coordinate frame was added using the digitised sky survey333see http://stdatu.stsci.edu/dss/. to relate common stars between the visible and 2.1m.
The line centre at each pixel position is obtained from the plate spacing determined for the peak of the fitted profile. The accuracy of this procedure varies with position on the array, as well as with the S/N the line is measured with. Where this is adequate, the accuracy typically is . Absolute line emission velocities were determined with reference to the plate spacing found for the peak of the H2 emission in M17, which is assumed to be at (). Note that, as a consequence of the broad wings to the instrumental profile, the line width cannot determined unless it is very much wider than the spectral resolution (which it is not in M8).
3 Results
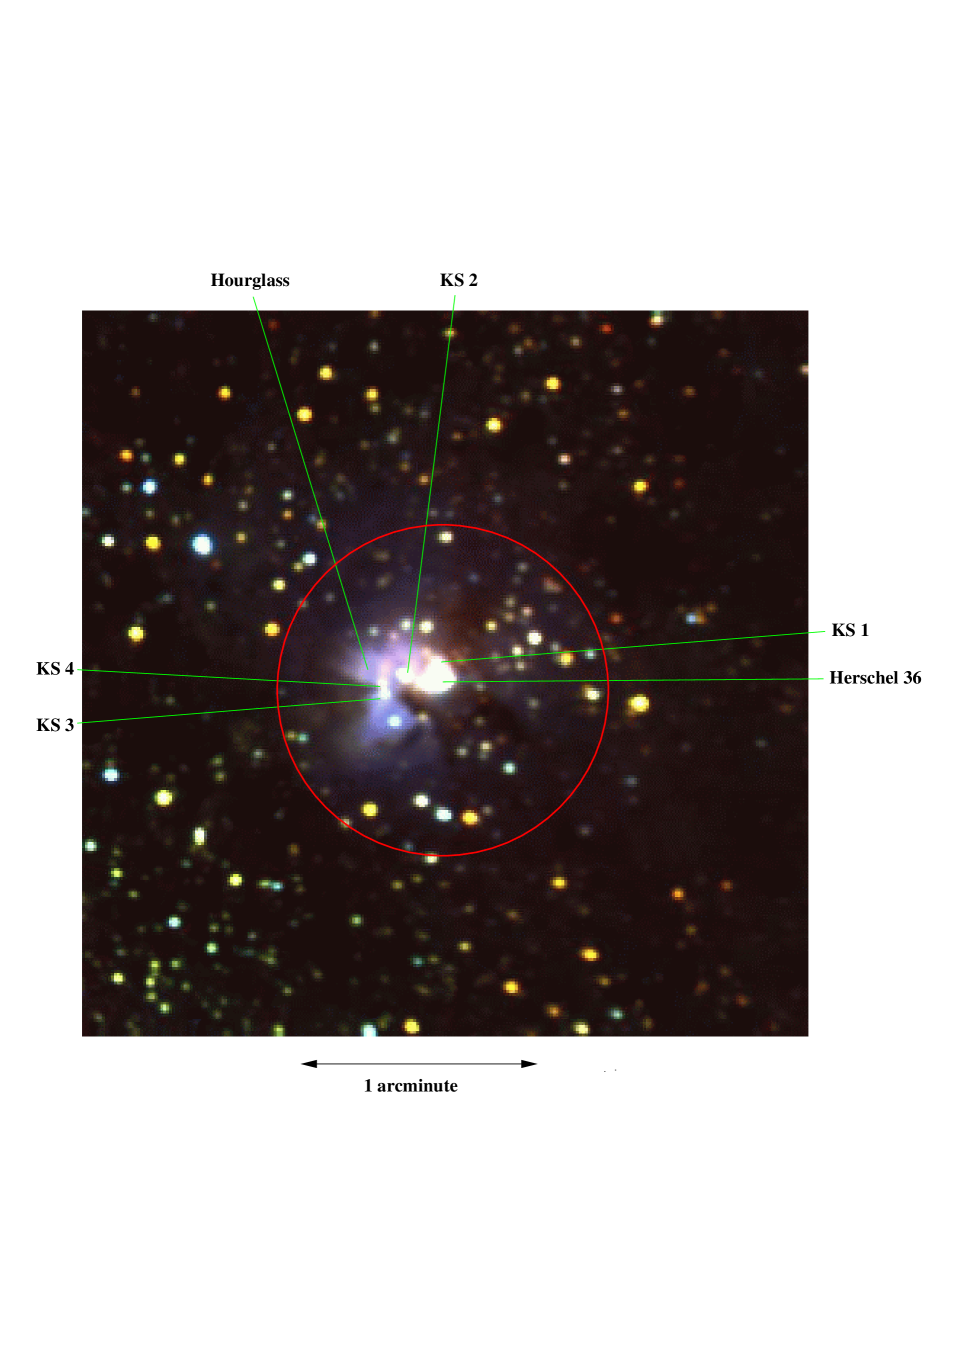
The field surrounding the Hourglass is shown in the 3-colour near–IR image in Fig. 1. The J (1.25m), H (1.65m) and K (2.2m) images were previously obtained by the author and David Allen during the commissioning of IRIS in 1991. They have been combined to produce a 3-colour image which simulates the appearance of the nebula if our eyes were sensitive to the 1–2.5m wavelength range. Embedded and obscured stars are red or yellow and foreground stars are blue. The HII region of the Hourglass appears blue as its near–IR emission is dominated by Paschen lines of hydrogen in the J–band. The morphology of the Hourglass is the same in the three bands, suggesting that this is its intrinsic shape, rather than being determined by variable extinction in the optical (as suggested by Woodward et al. 1986). In the figure, Herschel 36 and the Hourglass are marked, as well as the four 2m sources KS1–KS4 (Woodward et al. 1990).
 |
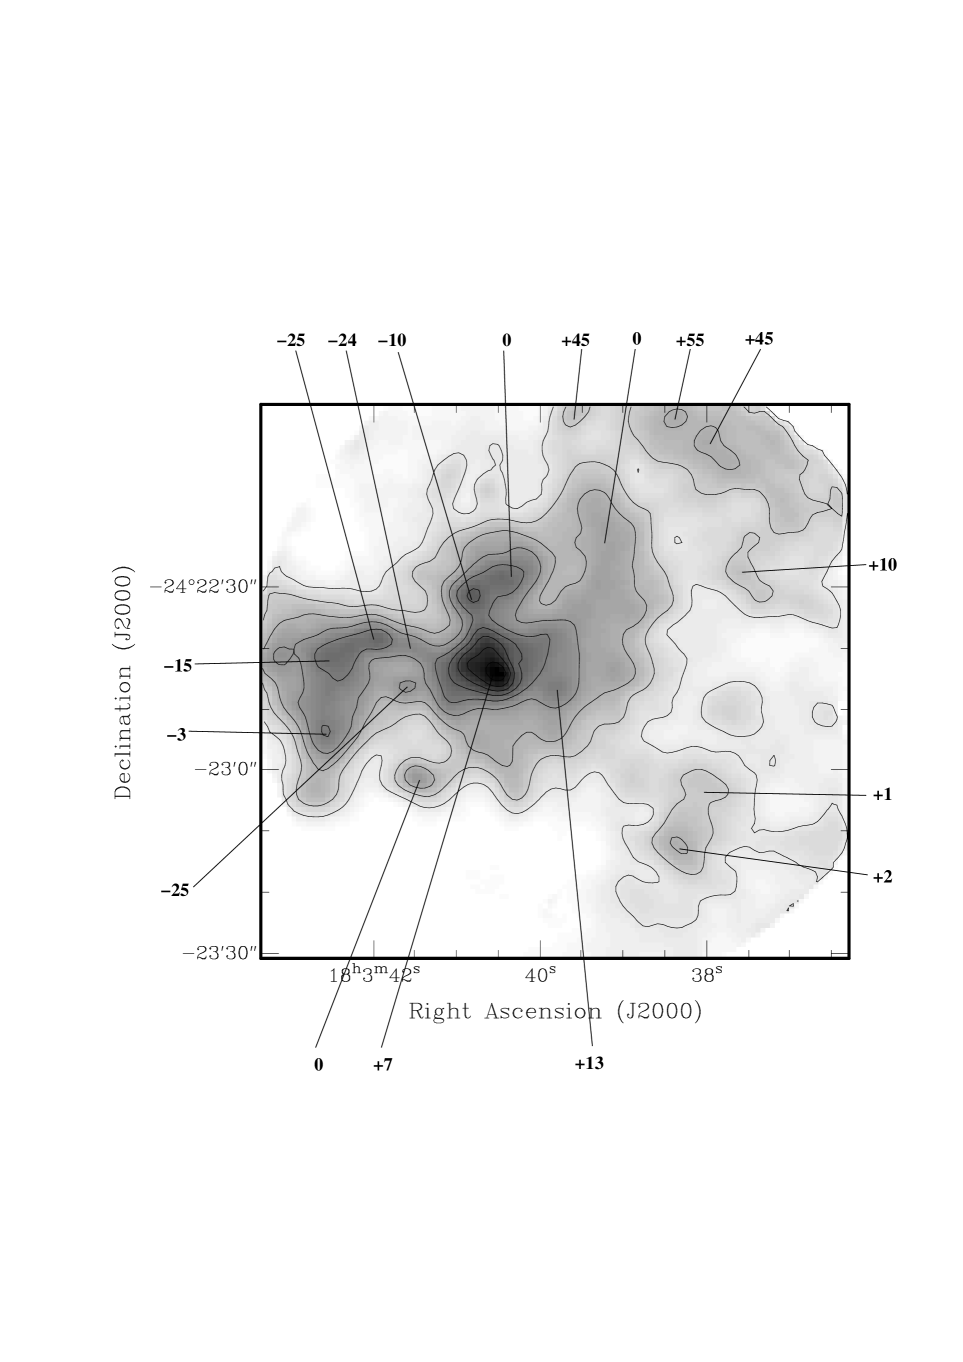
The molecular hydrogen v=1–0 (1) line emission image of M8 is shown in Fig. 2, overlaid with contours of the line flux. The emission is clumped and the morphology broadly bipolar, centred about Hershel 36. Also shown are the line centre velocities for selected locations, obtained from fitting the instrumental profile to the three on-line images. While the accuracy of individual velocities is no better than , they do indicate that there is a velocity gradient of across the field, extending from to the east of Herschel 36, to to its north-west.
 |
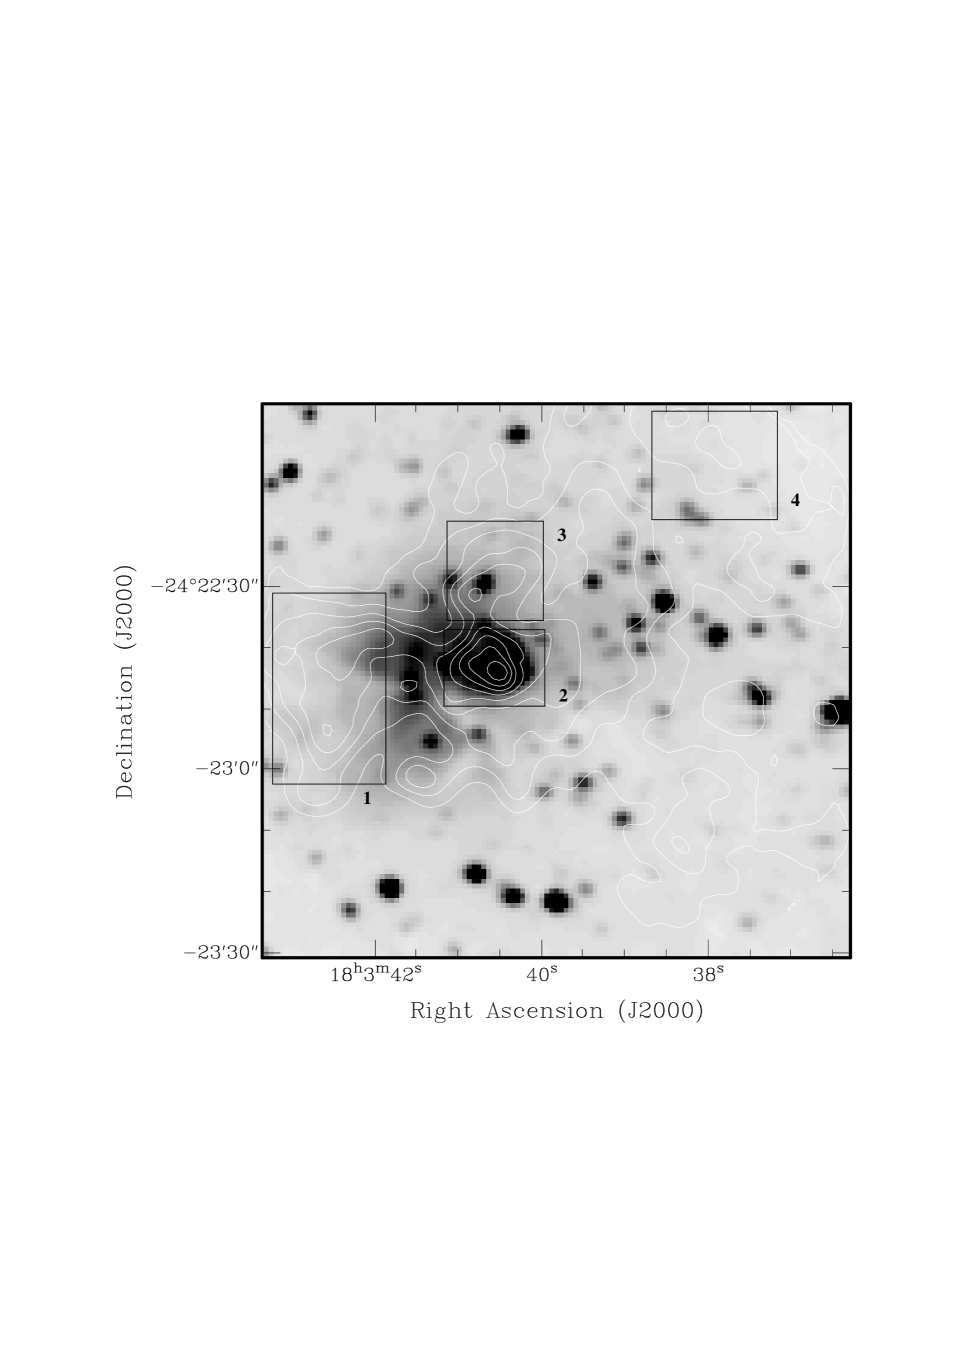
The 2.12m H2 line emission is compared to the 2.2m K–band continuum emission in Fig. 3. It can be seen that the H2 emission peaks close to the continuum peak, Herschel 36. The Hourglass, however, appears as a cavity in the H2 distribution. H2 line fluxes have been determined for the apertures indicated in this figure, and are listed in Table 1, together with the positions of the emission peaks. The total 1–0 S(1) line emission from the region is and the peak intensity is . At an assumed distance of 1.8 kpc for M8, these figures are equivalent to a luminosity in the 1–0 S(1) line of , and to a peak column density in the (v,J) = (1,3) level of the H2 molecule of (without any correction applied for extinction to the emitting region).
 |
| Region1 | RA2 | Dec2 | Aperture3 | 1–0 S(1) Flux4 | 1–0 S(1) Peak Intensity5 |
|---|---|---|---|---|---|
| arcsec | |||||
| 1 | |||||
| 2 | |||||
| 3 | |||||
| 4 | |||||
| Total6 |
1 Aperture, as shown in Fig. 3.
2 Position of peak emission within the aperture, in J2000.
3 Size of aperture.
4 Total H2 1–0 S(1) line emission from aperture.
5 Peak emission intensity within aperture.
6 Integrated fluxes for the entire field.
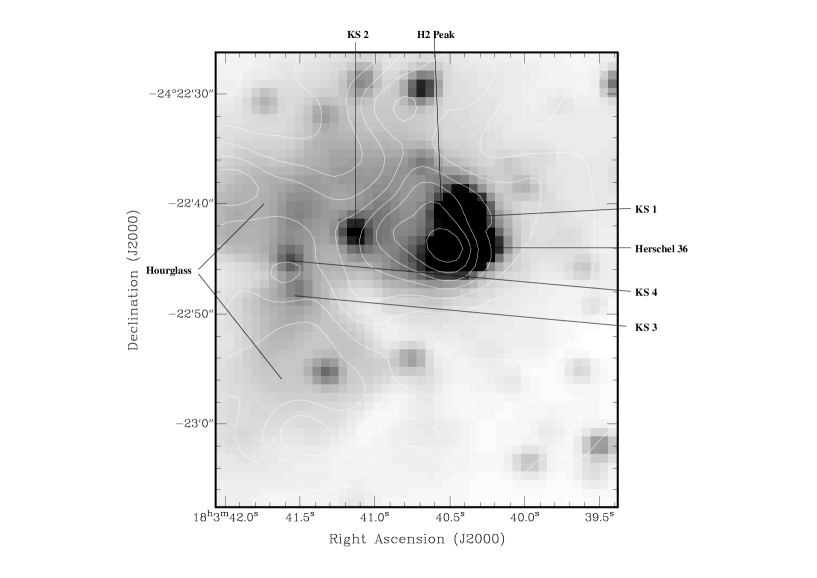
An enlarged image of the H2 line emission, overlaid on the K–band continuum, is shown in Fig. 4. It is apparent that the H2 emission does not, in fact, peak at the location of Herschel 36. The H2 emission peaks approximately (1.5”E, 0.5”S) from Herschel 36, roughly half way between it and the proplyd (2.5”E, 1.5”S) of Herschel 36.
 |
4 Discussion
4.1 H2 Morphology and Kinematics
Given the intensity of the CO line emission measured in M8 by White et al. (1997), it was a considerable surprise when the same authors failed to detect any H2 line emission from the source. M8 is the second most intense CO source detected, and clearly a site of active massive star formation. White et al. imaged M8 through a narrow band (1% width) filter centred on the H2 1–0 S(1) line, and used a broad band 2.2m image to subtract the continuum from it. They failed to detect any H2 line emission, and placed an upper limit of on the line flux. This is equivalent to , equal to the peak intensity we actually measured in M8. Thus, the upper limit of White et al. (1997) is consistent with our detection of H2 line emission. It does, however, highlight the difficulty of measuring line emission through narrow band filters in the presence of a strong continuum, and the advantages of using a Fabry-Pérot etalon for such measurements. The detection limit we achieved, with just 6 minutes on-line integration, is .
Comparison with the 12CO J=3–2 image obtained by White et al. (1997) (see their Fig. 2a, within the outermost white contour, at a level of ) shows that the morphology is very similar to the H2 1–0 S(1) line, given the difference in resolution of the two images (the CO 3–2 image was obtained through a beam). The line emission is peaked around Herschel 36, and extends in two lobes in a NW–SE, from the centre. The extension to the SW is also seen in both line images. This corresponds to a region of increased extinction seen in optical images.
The CO 3–2 line also displays broad line profiles, extending from +2 to +22 km (), and peaking at +10 km near Herschel 36. Profiles in the NW lobe tend to extend somewhat further to the red than they do in the SE lobe. Similar behaviour is displayed by the H2 line centre velocities, though the velocity extent is considerably larger than for the CO line. The H2 velocity ranges from km in the SE lobe, to +7 km at the emission peak, to km in the NW lobe.
4.2 Shock Excitation
High spatial resolution imaging in the optical lines of H and [SII] with the HST, and with adaptive optics in the K and L band near–IR continuum (Stecklum et al. 1995) shows an ionized, jet-like feature, extending from Herschel 36 to the SE (the K and L band emission is presumed to dominated by the 2.16m Br and 4.05m Br hydrogen recombination lines). Taken with the morphology and velocity extent of both the CO and H2 line emission, this suggests that the H2 line is shock-excited. It would appear to be the result of an interaction of a wind or jet from Herschel 36 with the ambient molecular cloud. The H2 morphology then represents the location where a loosely collimated bipolar flow from Herschel 36, surrounding an ionized jet, runs into a molecular cloud. The larger velocities seen in H2 than CO represent the shock speeds where the outflow impacts the molecular cloud. The flow then cools and decelerates, and this compressed gas is seen in the lower-velocity CO lines.
Presuming the H2 line emission is dominated by shocks, it is possible to estimate the total H2 line luminosity and the mass of hot, post-shock gas. In molecular shocks, the total H2 line luminosity is typically times the 1–0 S(1) line flux, and the fraction of hot H2 that is in the (v,J)=(1,3) state of the molecule is (e.g. see Burton 1992). The total H2 line luminosity from the source is then , and the peak column density of hot H2 is (i.e. at the emission peak). The total mass of hot H2 in the source is . These figures should be corrected for an unknown amount of extinction to the emitting region. This cannot be obtained from our data, so we will use the estimates of mags. towards Herschel 36 and the proplyd, made by Stecklum et al. (1998). This is equivalent to mags. at 2.1m. If this is representative of the extinction to the H2 emitting region, then the extinction-corrected luminosity, peak column density and mass of hot H2 are , and , respectively.
These figures can be compared to the total amount of molecular gas and its peak column density, estimated by White et al. (1997) from the CO lines. They determined these to be and , respectively. These are very much greater than the quantities determined for the hot molecular gas, as expected if the hot material comprises just a thin skin of material in front of cooled, compressed gas. The cooling time for hot H2, , is year, which therefore suggests that the outflow must have existed for years.
The mechanical luminosity of the outflow can be estimated as
| (1) |
where is the mass of hot H2 and V is the average speed of the shock wave. Taking this to be 35 km (half the range in velocity of the H2 line emission) yields (extinction corrected), an order of magnitude greater than the H2 line luminosity. This is obviously a crude estimate, but it does indicate that the H2 lines are a significant contributor, and possibly the dominant one (given the assumptions made), to the cooling of the gas behind the shock front.
4.3 Fluorescence
Despite our conclusion that the H2 line emission is dominated by shocks, there may still be a significant contribution by far–UV fluorescence to parts of it. The Hourglass is an HII region, excited by the UV radiation from Herschel 36. The gap in the H2 emission around the Hourglass suggests a physical connection between the two, for instance the Hourglass may be a cavity embedded within the outflow. The H2 line velocity in the cavity covering the Hourglass is approximately constant, taking the value km (). A constant velocity would be expected for fluorescent emission from a molecular cloud with small internal motions (e.g. see Burton et al. 1990). The velocity measured then indicates the velocity of the surface of the photodissociation region. This velocity, km , is at the negative limit of the 50 km range for the ionized gas in the Hourglass, as measured through [OIII] 5007Å line emission (Chakraborty & Anandarao 1999). Furthermore, Woodward et al. (1986) have detected 3.28m PAH emission from the region around the Hourglass. This is excited by the same far–UV photons that can fluorescently excite H2 (e.g. see the PAH emission in NGC 6334; Burton et al. 2000). Therefore, it seems likely that some of the H2 emission, especially in the vicinity of the Hourglass, is fluorescently excited. However, with our data, it is not possible to estimate what fraction this might be.
5 Conclusions
Strong near–IR molecular hydrogen line emission is produced from around the Hourglass in the M8 star forming region. The peak H2 brightness is at the detection limit of a previous attempt to measure H2 line emission from the source, thus explaining the reported non-detection. The H2 is emitted from an extended, roughly bipolar region, centred on the powering source for the Hourglass, Herschel 36. It is orientated along a NW–SE direction. The morphology is similar to that of the CO J=3–2 distribution in M8. Taken with the km variation in the H2 line centre across the region, and the 20 km width of the CO profiles, this suggests that the H2 emission is shock-excited, when a bipolar outflow, originating from Herschel 36, impacts the surrounding molecular cloud. The total H2 line luminosity is (not corrected for any extinction). The H2 lines provide a significant means of ridding the source of the mechanical energy in the outflow, though we cannot yet determine whether H2 line emission is the dominant coolant in the shocked gas.
To examine the excitation mechanism more closely, in particular to determine whether there may also be fluorescent H2 emission, it would be necessary to measure higher excitation lines of the molecule, from . This could be done either by long-slit spectroscopy, or through further Fabry-Pérot imaging, with the waveplates tuned to appropriate lines. To improve the determination of the flow energetics it will be necessary to use greater spectral resolution and resolve the line profiles, in order to measure the momentum and kinetic energy distribution of the hot molecular gas across the source.
Acknowledgements
Several people have provided considerable assistance with the work presented here. I particularly wish to thank Michael Ashley, Lori Allen, Jung-Kyu Lee, Stuart Ryder and John Storey for their help with the observations. Christine Carmody also helped with the reduction of the data. The staff of the Anglo Australian Telescope provided great assistance with the installation and operation of UNSWIRF.
References
Allen, D.A., 1986, MNRAS, 319, 35P.
Burton, M.G., 1992, Aust. J. Phys., 45, 463.
Burton, M.G., Ashley, M.C.B., Marks, R.D., Schinckel, A.E., Storey, J.W.V., Fowler, A., Merrill, M., Sharp, N., Gatley, I., Harper, D.A., Loewenstein, R.F., Mrozek, F., Jackson, J. & Kraemer, K., 2000, ApJ, 542, 359.
Burton, M.G., Geballe, T.R., Brand, P.W.J.L. & Moorhouse, A., 1990, ApJ, 352, 625.
Chakraborty, A. & Anandarao, B.G., 1999, A&A, 346, 947.
Lada, C.J., Gull, T.R., Gottlieb, C.A. & Gottlieb, E.W., 1976, ApJ, 203, 159.
Richter, S., Stecklum, B. & Launhardt, R., 1998, Abstracts of contributed talks and posters presented at the annual scientific meeting of the Astronomische Gesellschaft, Heidelberg, September 14-19, 1998.
Ryder, S.D., Allen, L.E., Burton, M.G., Ashley, M.C.B. & Storey, J.W.V., 1998, PASA, 15, 228.
Stecklum, B., Henning, T., Eckart, A., Howell, R.R. & Hoare, M., 1995, ApJ, L153.
Stecklum, B., Henning, T., Feldt, M., Hayward, T.L., Hoare, M.G., Hofner, P. & Richter, S., 1998, AJ, 115, 767.
Tothill, N.F.H., 1999, PhD Thesis, Queen Mary and Westfield College, University of London.
White, G.J., Tothill, N.F.H., Matthews, H.E., McCutcheon, W.H., Huldtgren, M. & McCaughrean, M.J., 1997, A&A, 323, 529.
Woodward, C.E., Pipher, J.L., Helfer, H.L., Sharpless, S., Moneti, A., Kozikowski, A., Oliveri, M., Willner, S.P., Lacasse, M.G. & Herter, T., 1986, AJ, 91, 870.
Woodward, C.E., Pipher, J.L., Helfer, H.L. & Forrest, W.J., 1990, ApJ, 365, 252.
Woolf, N.J., 1961, PASP, 73, 206.