AGN Populations from Optical Identification of ASCA Surveys
Abstract
To understand luminous AGNs in the universe, the ASCA AGN samples are the best at present. Combining the identified sample of AGNs from ASCA Large Sky Survey and Medium Sensitivity Survey, the sample of hard X-ray selected AGNs have been expanded up to 108 AGNs above the flux limit of 10-13 erg s-1 cm-2 in the 2–10 keV hard X-ray band. We discuss the fraction of absorbed AGNs in the hard X-ray selected AGN sample, and nature of absorbed luminous AGNs.
Subaru Telescope, National Astronomical Observatory of Japan, Hilo, HI, 96720
ISAS, Sagamihara, Kanagawa, 229-8510, Japan
Department of Astronomy, Kyoto University, Kyoto, 606-8502, Japan
1. Introduction : Importance of a Bright Hard X-ray AGN sample
The fraction of absorbed AGNs, especially luminous absorbed AGNs, is one of a big issue in understanding the true number density of active nuclei in the universe. Recently many candidates of absorbed luminous AGNs are found in AGN surveys in radio, X-ray, and near-infrared wavelengths (e.g., Webster et al. 1995). The discoveries imply that we have been missing significant fraction of nucleus with high activity in traditional optical/UV-selections of AGNs due to absorption to the nucleus. However the fraction of the absorbed AGN in the entire AGN population is not clear. Radio-selected samples are affected by red AGNs with red synchrotron component (Francis et al. 2001), soft X-ray selection is biased against heavily absorbed AGNs (Kim & Elvis 1999), and 2MASS-selected red AGNs are limited in the low redshift universe (Cutri et al. in this volume).
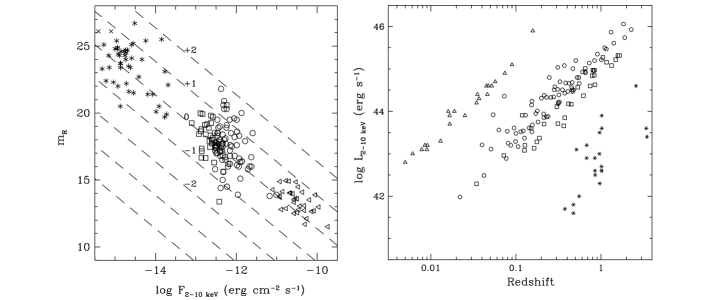
In order to construct a complete sample of AGNs less biased against absorption to nucleus, we conduct optical follow-up observations for ASCA Large Sky Survey (hereafter ALSS; Ueda et al. 1999) and ASCA Medium Sensitivity Survey (hereafter AMSS; Ueda et al. 2001) in the hard X-ray band. Hard X-ray emission can penetrate the obscuring matter of absorbed AGNs and is very suitable in searching absorbed AGNs. Using 2–10 keV hard X-ray emission, we can detect AGNs with X-ray absorption up to hydrogen column density of 1022∼23 cm-2, which corresponds to of 20 50 with galactic conversion factor, without bias. ALSS is a survey in a continuous field with 5.4 square degree near the north galactic pole. We selected 34 X-ray sources detected with SIS 2–7 keV significance larger than 3.5. The sources are identified with 30 AGNs, 2 clusters of galaxies and 1 galactic star (Akiyama et al. 2000). One X-ray source with hard spectrum is still unidentified, and Chandra follow-up observation is planed in Cycle 3. AMSS is a serendipitous source survey based on ASCA pointing observations conducted in high galactic latitude region (). We conducted optical follow-up observations for 86 X-ray sources detected with GIS 2–10 keV significance larger than 5.6 in the northern sky (declination above ; we call AMSSn sample). All of the X-ray sources are identified with 78 AGNs, 7 clusters of galaxies, and 1 galactic star (Akiyama et al. in preparation). In total, we constructed sample of 108 hard X-ray selected AGNs with the flux limit of ASCA, about erg s-1 cm-2 in the 2–10 keV band. In Figure 1, we plotted the hard X-ray flux vs. optical magnitude (left) and the redshift vs. luminosity distribution (right) diagrams of ALSS and AMSSn AGNs. The ASCA samples are two orders of magnitude brighter and more luminous than the sample of deep Chandra and XMM-Newton surveys, and consists of luminous AGNs, i.e., QSOs, in the universe below redshift 1. The high completeness of the ASCA samples makes us possible to discuss the fraction of absorbed AGNs definitely.
2. Fraction of Heavily Absorbed AGNs
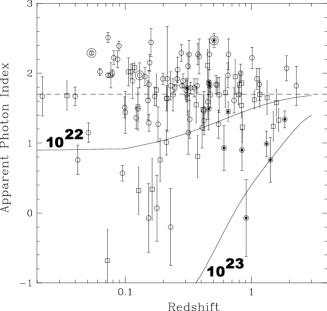
Using the hardness of X-ray spectrum of each source, we can estimate the X-ray absorption to the nucleus in each object. The 0.7–10 keV apparent photon index distributions of ALSS and AMSSn AGNs are plotted as a function of redshift in left panel of Figure 2. The upper and lower solid lines in the figure correspond to the apparent photon index of an object with intrinsic photon index of 1.7 and X-ray absorption with hydrogen column density of (cm-2) and (cm-2) at each redshift, respectively. The X-ray sources with apparent photon index smaller than 1 can be regarded as significantly harder than canonical power-law spectra of broad-line AGNs (with photon index of 1.7). They correspond to intermediate redshift AGNs with X-ray absorption of (cm-2) and high-redshift AGNs with absorption of (cm-2). At high-redshift (), the apparent photon indexes of highly absorbed objects become close to that of object without absorption, because we observe very high energy photons of the source-frame, which are less affected by absorption than low-energy photons.
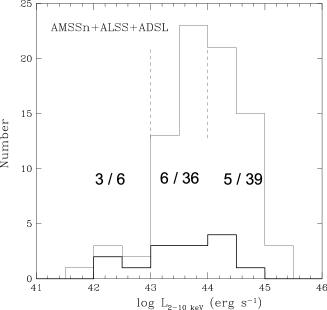
Based on the estimated amount of absorption to nucleus, we examine the fraction of absorbed AGNs in the hard X-ray selected AGNs. For simplicity, we limit the sample below redshift of 0.6, and regard AGNs with (cm-2) as significantly absorbed AGNs. It should be noted that at high-redshifts () AGNs with hydrogen column density of (cm-2) can not be regarded as significantly absorbed in the current sample. In right panel of Figure 2, the luminosity distribution of the all AGNs and significantly absorbed AGNs from combination of the ALSS, AMSSn, and ASCA Deep Survey in the Lockman Hole (ADSL; Ishisaki et al. 2001) is plotted. The fraction of absorbed AGNs is higher in the lowest luminosity range, but there is no clear deficiency of absorbed AGN above 1044 erg s-1, which is observed in the ALSS sample (Akiyama et al. 2000). The fraction of absorbed AGN are 6/36 and 5/39 in the luminosity between 1043 erg s-1 and 1044 erg s-1 and in the luminosity above 1044 erg s-1, respectively. The fraction of absorbed AGNs is higher in the luminosity range below 1043 erg s-1 (3/6) than in the luminosity range above, but the number of AGNs in the low luminosity range is fairly limited. The fraction of luminous ( erg s-1) AGNs with (cm-2) in the sample of AGNs without bias up to (cm-2) (15%) is clearly smaller than that expected from the models of cosmic X-ray background (45%; Comastri et al. 1995) or that observed in local low-luminosity Seyfert galaxies (40%; Risaliti et al. 1999).
3. Case studies on absorbed QSOs
The fraction of absorbed QSOs is not as large as expected, but we detected several candidates of absorbed QSOs in ASCA surveys. Their counterparts are relatively faint and have larger X-ray to optical flux ratio than normal AGNs (see dotted objects in left panel of Figure 2). Most of high-redshift AGNs with hard X-ray spectra have large X-ray to optical flux ratios. The X-ray to optical flux ratio is similar to those of optically-faint hard X-ray source population found in deep Chandra surveys (see left panel of Figure 1; e.g., Alexander et al. 2001), and the ASCA optically-faint AGNs can be low-redshift and/or high-luminosity cousin of the Chandra population.
Although measured amount of X-ray absorption is large, most of the luminous absorbed QSOs show broad MgII 2800Å or H 6563Å emission line. The origin of the discrepancy can be 1) broad MgII 2800Å from scattered nuclear light or 2) discrepancy between amount of X-ray photoelectric absorption and optical dust reddening. We show two examples of absorbed QSOs fall in each category.
3.1. An absorbed QSO at with a strong broad MgII 2800Å emission line
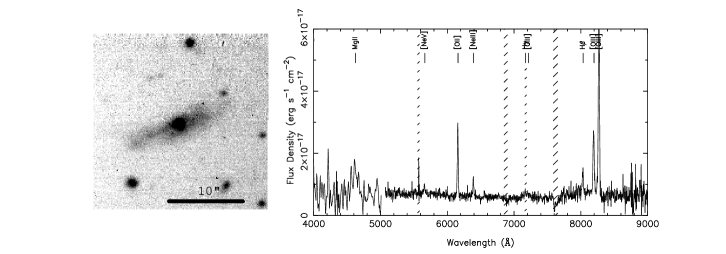
AX J131831+3341 is an absorbed radio-quiet QSO at a redshift of 0.65 found in ALSS (Akiyama et al. 2000). Its X-ray luminosity is estimated to be erg s-1, which corresponds to the luminosities of QSOs. The observed X-ray spectrum of the object in a 0.7–10 keV band is described by intrinsic absorption with a hydrogen column density of cm-2 and an intrinsic photon index of 1.7. The hydrogen column density corresponds to the lower edge of the column density distribution of Seyfert 1.8-1.9 galaxies.
The optical spectrum of the object shows strong emission lines, such as broad MgII 2800Å, narrow [OII] 3727Å, and narrow [OIII] 5007Å, but no broad H emission line (see right panel of Figure 3). Its small H-to-[OIII] 5007Å equivalent width ratio is comparable to those of Seyfert 1.8-2 galaxies. Optical and near-infrared images show nuclear and extended components (see left panel of Figure 3). Because the nuclear component has very red color but blue and colors, the nucleus is thought to be absorbed with and emerge only in the -band (Akiyama and Ohta 2001). The amount of absorption is consistent with the amount of X-ray absorption. The optical blue continuum and broad MgII 2800Å emission line can originate from scattered nuclear light (Akiyama et al. 2001).
3.2. A candidate of a type-2 QSO with large X-ray absorption and a strong broad-H emission line
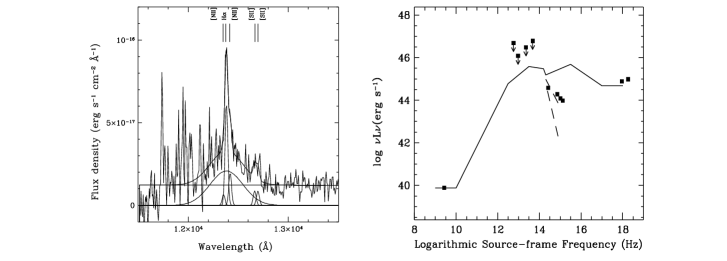
AX J08494+4454 is a candidate of a type-2 QSO at found in the course of the optical identification of ASCA deep survey in Lynx field (Ohta et al. 1996). Recently, deep Chandra hard X-ray spectrum and IRCS/Subaru -band spectrum of the object are obtained (Akiyama et al. 2002). The 0.5–10 keV 150ks Chandra spectrum of AX J08494+4454 is hard, and is explained well with a power-law continuum absorbed by a hydrogen column density of cm-2. The 2–10 keV luminosity of the object is estimated to be erg s-1, after correcting the absorption, and reaches hard X-ray luminosities of QSOs. The large X-ray absorption and the large intrinsic luminosity support the original identification of AX J08494+4454 as a type-2 radio-quiet QSO. Nevertheless, deep Subaru/IRCS -band spectroscopic observation suggests the presence of a strong broad H emission line from AX J08494+4454 (left panel of Figure 4). The broad H emission line has a velocity width of km s-1, which corresponds to a typical broad-Balmer line velocity width of a luminous QSO. The existence of the strong broad H line means that the object is not a type-2 QSO, but a luminous cousin of a Seyfert 1.9 galaxy in the source-frame optical spectrum. The Balmer decrement of broad lines, the broad H emission to the hard X-ray luminosity ratio, and optical SED (right panel of Figure 4) suggest that the nucleus is affected by dust extinction with of mag in the optical wavelength. The estimated amount of dust extinction is much smaller than that expected from the X-ray column density ( mag). The discrepancy can be explained with a smaller dust to gas mass ratio which may due to dust sublimation in the X-ray absorbing matter, the size difference between optical and X-ray emitting region, or different dust size distribution in AGNs (e.g., Maiolino et al. 2001).
Acknowledgments.
The authors would like to thank ALSS and AMSS members.
References
Akiyama, M., et al. 2000, ApJ, 532, 700
Akiyama, M., and Ohta, K. 2001, PASJ, 53, 63
Akiyama, M., et al. 2001, PASJ, 52, 577
Akiyama, M., Ueda, Y., and Ohta, K. 2002, ApJ, in press (astro-ph/0111037)
Alexander, D.M., et al. 2001, ApJ, in press (astro-ph/0107450)
Comastri, A., Setti, G., Zamorani, G., and Hasinger, G. 1995, A&A, 296, 1
Elvis, M., et al. 1994, ApJS, 95, 1
Francis P.J., et al. 2001, PASA, in press (astro-ph/0107235)
Hornschemeier, A., et al. 2001, ApJ, 554, 742
Ishisaki, Y., et al. 2001, PASJ, 53, 445
Kim, D., and Elvis, M. 1999, ApJ, 516, 9
Maiolino, R., Marconi, A., and Oliva, E. 2001, A&A, 365, 37
Ohta, K., et al. 1996, ApJ, 458, 57
Piccinotti, G., et al. 1982, ApJ, 253, 485
Risaliti, G., Maiolino, R., Salvati, M. 1999, ApJ, 522, 157
Ueda, Y., et al. 1999, ApJ, 518, 656
Ueda, Y., et al. 2001, ApJS, 133, 1
Webster, R., et al. 1995, Nature, 375, 469