Molecular hydrogen at = 1.973 toward Q 0013004: Dust depletion pattern in damped Lyman- systems ††thanks: Based on observations carried out at the European Southern Observatory (ESO) under prog. ID No. 66.A-0624 and 267.A-5714 with UVES the echelle spectrograph mounted on the Very Large Telescope (VLT) at Cerro Paranal Observatory in Chile.
Abstract
We study the dust depletion pattern in eight well separated components of the = 1.973, log (H i) = 20.83, damped Lyman- system toward Q 0013004, four of which have detectable H2 absorption. The apparent correlation between the abundance ratios [Fe/S] and [Si/S] in the components indicates that the abundance pattern is indeed due to dust-depletion. In particular, we find evidence for depletion similar to what is observed in cold gas of the Galactic disk ([Fe/Zn] = 1.59, [Fe/S] = 1.74, [Zn/S] = 0.15, [Si/S] = 0.85) in one of the weakest components in which molecular hydrogen is detected with log (H2) 16.5. This is the first time such a large depletion is seen in a DLA system. Extinction due to this component is negligible owing to small total Hi column density, log (Hi ) 19.4. This observation supports the possibility that current samples of DLA systems might be biased against the presence of cold and dusty gas along the line of sight.
The overall metallicities of this peculiar DLA system in which O i and C ii are spread over 1050 km s-1 are [P/H] = 0.64, [Zn/H] = 0.74 and [S/H] = 0.82 relative to solar. The sub-DLA system at = 1.96753 has [P/H] 0.06, [Zn/H] 0.02 and [S/H] 0.18. The overall molecular fraction is in the range 2.7 log 0.6, which is the highest value found for DLA systems. H2 is detected in four components at 615, 480, 0 and 85 km s-1 relative to the strongest component at = 1.97296. CO is not detected (log (CO)/(H i) 8) and HD could be present at = 1.97380.
We show that the presence of H2 is closely related to the physical conditions of the gas: high particle density together with low temperature. The observed excitation of high H2 levels and the molecular fraction show large variations from one component to the other suggesting that the UV radiation field is highly inhomogeneous throughout the system. Gas pressure, estimated from C i absorptions, is larger than what is observed in the ISM of our Galaxy. This, together with the complex kinematics, suggests that part of the gas is subject to high compression due to either collapse, merging and/or supernovae explosions. This is probably a consequence of intense star-formation activity in the vicinity of the absorbing gas.
keywords:
Cosmology: observations – Galaxies: halos – Galaxies: ISM – Quasars: absorption lines – Quasars: individual: Q 00130041 Introduction
The amount of dust present at high redshift has important consequences on the physics of the gas. In addition, dust directly affects our view of the high redshift universe through extinction. Therefore, the presence of dust in damped Lyman- (hereafter DLA) systems, that contain most of the neutral hydrogen in the universe, can have significant consequences. Although the presence of dust in DLA systems has been claimed very early (Pei et al. 1991), the issue has remained controversial. Indeed, Lu et al. (1996) have questioned the idea that the overabundance of Zn compared to Cr or Fe observed in DLA systems (e.g. Pettini et al. 1997) is due to selective depletion onto dust-grains and have argued that the overall abundance pattern observed in DLA systems is indicative of Type II supernovae enrichment instead. In recent years several studies have shown that both effects, dust-depletion and peculiar nucleosynthesis history, should be invoked to explain the abundance pattern (Vladilo 1998, Prochaska & Wolfe 1999, Ledoux et al. 2001a). However, the lack of statistics and the wide variety of objects that can give rise to DLA systems, namely dwarf galaxies (Centurión et al. 2000), large disks (Prochaska & Wolfe 1997, Hou et al. 2001), galactic building blobs (Haehnelt et al. 1998, Ledoux et al. 1998) etc., with, for each of these objects, its own history, prevent us to have a clear picture of the nature of DLA systems. Nevertheless, all studies conclude that the dust content of DLA systems is small. However, it is possible that the current sample of DLA systems is biased against high-metallicity and dusty systems. Indeed, Boissé et al. (1998) have noticed that there is a lack of systems with large (H i) and large metallicity. Very recent investigation of an homogeneous sample of radio-selected quasars shows that the dust-induced bias cannot lead to underestimate the H i mass in DLA systems by a large factor (Ellison et al. 2001). However even a factor of two could change our understanding of DLA systems.
An obvious way to search for DLA systems with large amount of dust is to select those where molecules are detected as these molecules form predominantly at the surface of dust grains. However, it may not be so simple as it has been shown that the presence of H2 is not only related to the dust-to-metal ratio but is mostly dependent on the physical conditions of the gas. First of all, H2 is detected when the particle density is large (Petitjean et al. 2000, Ledoux et al. 2001b). In any case, the system at = 1.973 toward Q 0013004 is a good target as very strong molecular absorption lines have been identified by Ge & Bechtold (1997, see also Ge et al. 1997).
2 Observations
The Ultra-violet and Visible Echelle Spectrograph (D’Odorico et al. 2000) mounted on the ESO Kueyen 8.2 m telescope at the Paranal observatory has been used on October 2123, 2000, to obtain high-spectral resolution spectra of Q 0013004. Additional observations were performed in service mode on September 1011 and 1318 2001. The slit width was 1 arcsec (the seeing was most of the time better than 0.8 arcsec) and the CCDs were binned 22. The resulting resolution was 45000. The total exposure time 22 hours was split into 1 h exposures. Two dichroic settings were used to cover the complete wavelength range. The data were reduced using MIDAS, the ESO data reduction package, and the UVES pipeline in an interactive mode. The main characteristics of the pipeline is to perform a precise inter-order background subtraction, especially for master flat-fields, and an optimal extraction of the object signal rejecting cosmic ray impacts and subtracting the sky at the same time. The data reduction is checked step by step. Wavelengths were corrected to vacuum-heliocentric values and individual 1D spectra were combined together. The resulting S/N ratio per pixel in the final spectrum is of the order of 35 at 3500 Å and 80 at 5000 Å.
3 The DLA system at = 1.973
3.1 Molecular hydrogen

| Level | log | lines | ||
| (cm-2) | (K) | |||
| 1.96685a | J = 0 | 2.35 | 3 | … |
| J = 1 | 1.21 | 2 | 300 | |
| J = 2 | 6.09 | 1 | 776 | |
| J = 3 | 3.39 | 2 | 382 | |
| J = 4 | … | … | ||
| 1.96822b | J = 0 | 1.05: | 1 | … |
| J = 1 | 9.03 | 2 | 73 | |
| J = 2 | 9.65 | 1 | 302 | |
| J = 3 | 4.18 | 3 | 258 | |
| J = 4 | 8.58 | 3 | 363 | |
| J = 5 | 3.57 | 5 | 372 | |
| 1.97296c | J = 0 | 5.5–1.0 | … | … |
| J = 1 | 1.4–2.0 | … | … | |
| J = 2 | 7.5–2.0 | … | … | |
| J = 3 | 4.3–1.0 | … | … | |
| J = 4 | 1.46 | 3 | … | |
| J = 5 | 1.30 | 4 | … | |
| 1.97380d | J = 0 | 5.0–6.0 | … | … |
| J = 1 | 1.0–3.0 | … | … | |
| J = 2 | 5.0–3.0 | … | … | |
| J = 3 | 6.42 | 1 | … | |
| J = 4 | … | … | ||
| a = 8.89 km s-1; b = 7.07 km s-1 | ||||
| c = 18.87 km s-1; d = 11.26 km s-1 | ||||
The presence of H2 in the = 1.973 system toward Q 0013 was first reported by Ge & Bechtold (1997). Based on an intermediate resolution spectrum and a single component curve of growth analysis, they derived a very high value of the molecular fraction, = 2 (H2)/[(H i)+2(H2)] = . In the UVES data, H2 is detected in four distinct main components spread over 700 km s-1, at = 1.96685 ( km s-1), 1.96822 (480 km s-1), 1.97296 (0 km s-1) and 1.97380 ( km s-1), marked with vertical dotted lines in Fig. 1. For simplicity we name these components a, b, c and d respectively. Four additional strong metal components at = 1.96729 ( km s-1), 1.97023 ( km s-1), 1.97098 ( km s-1) and 1.97138 ( km s-1), with highly saturated O i, Si ii and Mg ii lines, but clearly identified by the weaker S ii lines, are marked with vertical dashed lines in Fig. 1 (see also Fig. 2 and Fig. 4). These additional components, in which we measure a conservative upper limit, (H2), probably have a non-negligible contribution to the total H i column density.
In the case of components c and d the absorption lines due to rotational levels are strongly saturated and possibly blended with other lines. This implies that we can only derive a lower limit on the H2 column density from the condition that the lines must be saturated and an upper limit from the absence of damping wings. Results are given in Table 1 together with the number of unblended lines, , that are used to derive the column densities.
Components a and b are narrow and mostly unblended. As the lines are moderately saturated it is possible to derive H2 column densities for various levels (see Table 1). The total H2 column density in these components is 2.39 and 3.46 respectively. The excitation temperatures = 300 and 73 K could reflect the kinetic temperature of the gas (e.g. Abgrall et al. 1992).
In the case of component a the excitation temperatures for the ortho and para states ( K and K) are different (although errors are large). This happens also in component b. Note however that the estimated column densities of and levels are based on a single unblended line. Moreover, transitions from this latter component are blended with transitions at =1.96685 (see Fig. 1). The fact that and are different could indicate that excitation is not dominated by collisions and other processes such as UV pumping are important (see Srianand & Petitjean 1998). As emphasized by Srianand et al. (2000), populating the J = 4 level after formation of a molecule on a dust grain is probably negligible in this gas. The photo-absorption rate in the Lyman and Werner bands is therefore and 9 s-1, respectively, for a and b, based on the column densities. This is consistent with what is measured in the Galactic ISM.
Absorption due to H2 is detected up to in component c. The lines from the = 4 and 5 levels are narrow and unsaturated and we used a single-component fit to derive the column densities. Neglecting the formation pumping to and using the lower limit on the column density, we obtain . This is at least a factor 3 smaller than that derived for component b.
It is clear from Fig. 1 that the lines are either absent or weak in component d. We determine the column density for from the H2-L0-R3 line that is not saturated. Absence of absorption from high levels, despite strong saturation of the transitions from levels, suggests that the rate of UV pumping to high levels is low in this component. We derive which is at least a factor 8 smaller than what is derived for component b.
All this indicates that there are large fluctuations of the ambiant UV flux inside the system.
3.2 Atomic hydrogen

The overall structure of the strong metal lines is illustrated in Fig. 2. The location of the strongest components with and without detected H2 molecules is indicated by, respectively, dotted and short-dashed lines as in Fig. 1. The long-dashed lines show components with absorption due to low-ionization species only. It can be seen that the low-ionization absorptions (from O i, C ii, Si ii, Mg ii) span about 1000 km s-1 and are structured in two main strong systems at 1.9676 and 1.9733 separated by 575 km s-1. Note that most of the Si iv and C iv absorption is located inbetween these two strong low-ionization systems.
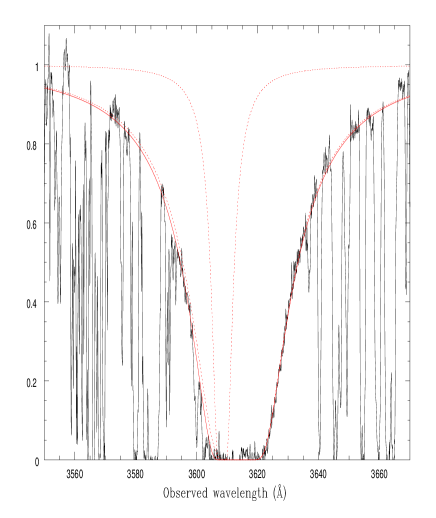
A Voigt profile centered at the mean position of the two strongest H2 components (c and d), = 1.9733, gives a good fit to the red wing of the Lyman- absorption with a total column density, (H i) = 6.71020 cm-2. This is consistent with the value derived by Ge & Bechtold (1997). There is however an excess of absorption in the blue wing that we attribute to H2 components a and b that are blue-shifted by 615 and 480 km s-1 relative to the strongest H2 component. We can therefore estimate (H i) associated with these two blueshifted components. In Fig. 3, we show the fits to the damped absorption with and without the additional absorption (log (H i) = 19.4) that can be accomodated at 1.96753. This implies that less than 10% of the Hi gas is associated with H2 components a and b. This gives a lower limit on the molecular fraction and for components a and b respectively. These limits are higher than what has been observed in other DLA systems (e.g. Petitjean et al. 2000). Such a large value for in a low Hi column density cloud is at odd with what is observed in the ISM of our Galaxy where log 4 for log (H i) 20 (Savage et al. 1977). This implies high formation rate, and therefore large amount of dust, high density, low temperature, and low destruction rate, therefore shielding from the UV field.
We derive for the whole system 61017 log (H2) 1 cm-2. Therefore, the mean fraction of molecular hydrogen is in the range 0.0020.25. This is much larger than what is seen in other DLA systems (see Petitjean et al. 2000; Ledoux et al. 2001b).
3.3 Other molecules
If the molecular fraction is close to the upper limit we derived above then one can expect to detect other molecular species such as CO and HD (see Varshalovich et al. 2001). We do not detect molecular CO down to (1088) 7 mÅ. This means (CO) 21012 cm-2 in components c and d, using the oscillator strength by Morton (1975). Therefore log (CO)/(H i) 8.5. Note that in our Galaxy, when log (H2) 19, CO is readily detected with log (CO) 13 (Federman et al. 1980).
It is difficult to trace HD in this system because blending of lines is severe for all bands. At = 1.97296 (component c), absorption features are present at the expected position of HD-L0-R0 and HD-L1-R0 but they are stronger than a possible HD-L3-R0 absorption ( 30 mÅ). Note that consistent features are seen at = 1.97278, especially at the expected position of HD-L3-R0 but HD-L0-R0 is not visible down to 40 mÅ. The large equivalent width limit is a consequence of the line falling in the wing of another stronger absorption. At = 1.97380 (corresponding to component d), consistent absorption features are present at the expected position of HD-L0-R0, HD-L3-R0 and HD-L4-R0. HD-L1-R0 is possibly present but blended. The detection should be considered as tentative as HD-L0-R0 and HD-L3-R0 are affected by noise. The strongest constraint on this component is given by (HD-L0-R0) 10 mÅ. Using = 1105.845 Å and = 7.610-4 we derive (HD) 41014 cm-2. Using the limits on H2 indicated in Table 1, we derive 1.010-5 (HD)/(H2) 210-3.
4 Metallicity and depletion
4.1 The system as a whole
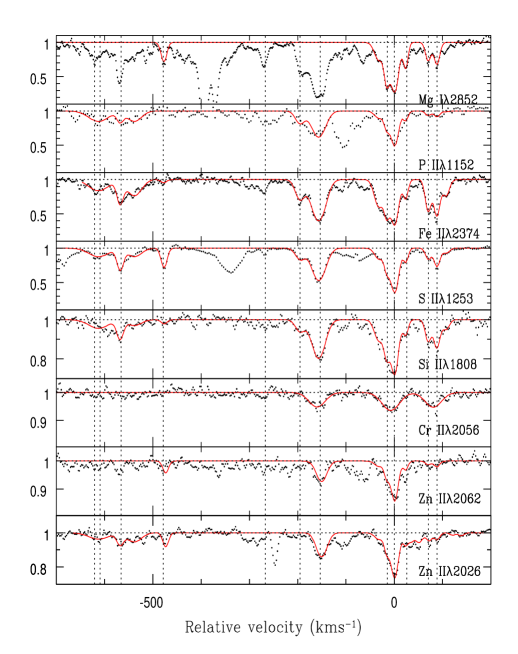
The absorption lines from heavy elements show a complex multiple component structure (see Fig. 4) and only a few of the strong velocity components have detectable associated H2 absorption.
Ion [X/S]a,b (cm-2) DLA Cold Warm Halo DLA at = 1.9733c H i 6.70 …… ….. …… …… Si ii 2.70 S ii 1.90 …. P ii 5.71 Zn ii 5.47 Cr ii 9.86 Fe ii 6.41 Ni ii 1.44 Mn ii 2.31 Sub-DLA at = 1.96753d H i 2.70 …. Si ii 2.65 0.38 S ii 3.32 P ii 1.16 Zn ii 1.16 Fe ii 5.43 a[X/H] = log[(X)]log[(X)] bGalactic values are from Welty et al. (1999) c[S/H] = 0.81 in the DLA system dComponents a and b; [S/H] 0.18
The column densities of different species, integrated over, respectively, the DLA system at = 1.9733 and the sub-DLA system at = 1.96753 are given in Table 2. For the sub-DLA system, we have considered that most of the neutral hydrogen is associated with the two molecular components a and b. The column densities indicated in Table 2 are therefore the sum of the column densities measured in these two components. Note that the measurements are obtained using transitions with little saturation (see Fig. 4). We use in the following the standard notation [X/H] = log[(X)]log[(X)] with (X) the metallicity of species X. Solar metallicities are from Savage & Sembach (1996).
Sulphur and zinc are not much depleted onto dust-grains in the ISM of our Galaxy and therefore are good indicators of metallicity. They have consistent metallicities, about 0.15 solar in the DLA system and 0.7 solar in the sub-DLA system. Phosphorus is slightly enhanced ( times) compared to Sulphur and Zinc in both cases. Iron, Chromium, Nickel and Manganese are underabundant with respect to Zinc probably because they are depleted onto dust-grains.
If we compare the measurements to what is seen in our Galaxy, it is interesting to note that the abundance pattern seen in the DLA system is close to that of warm halo gas whereas the pattern in the sub-DLA system is close to that of warm neutral gas in the disk (see however next Section). This is consistent with the conclusion by Petitjean et al. (2000) that the bulk of the DLA population is drawn from warm gas.
4.2 Dust depletion in the = 1.96822 component
Species [X/S] [X/S] (cm-2) Component Cold ISM Mg i 3.58 …. …. Mg ii 1.24 1.33 1.2 Fe ii 4.07 1.74 2.2 Zn ii 2.23 0.15 0.4 Si ii 3.51 0.85 1.3 S ii 1.30 0.00 0.0 O i …. …. N i …. …. P ii 0.06 …. Al ii 3.93 1.73 -2.4
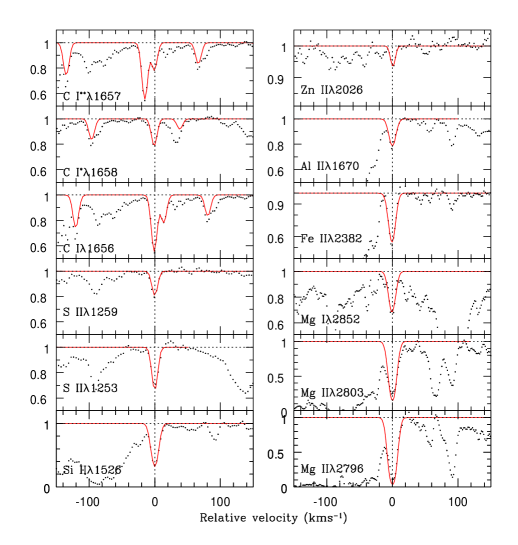
In contrast to what is seen for the system as a whole in which absorption by Fe ii is strong compared to absorption by Zn ii, it is stricking to note that in the = 1.96822 component (H2 component b), the absorption in the strongest iron transition Fe ii2382 has about the same strength as that in Zn ii2026 (see Fig. 5). In fact, all transitions from refractory elements are weak. Note that Si iii absorption is clearly absent (see Fig. 4), indicating negligible ionization correction. The results of Voigt profile fits to the available metal lines are given in Table 3. Abundances of Zn and S are similar. As can be seen from Table 3, Fe and Al are depleted compared to Zn by about two orders of magnitude; Mg and Si are depleted by an order of magnitude compared to S. This is the first time that such a large depletion, consistent with that observed in the cold interstellar medium of the Galactic disk, is observed in a DLA system.

4.3 Variations of dust-depletion within the system
We investigate here the variations of the abundance ratios among different well separated velocity components where ionization correction is negligible. This is the case for the components where H2 is detected. However, heavy element absorption from component a is blended with absorption due to a nearby high-ionization feature (see Fig 2). Thus we do not consider this component for the analysis. In addition, we consider the two components at and 195 km s-1 that account for 20 to 30% of the observed heavy element column densities (see Fig. 4).
We note that the [Zn/S] ratio is very close to solar (uncertainties are typically of the order of 0.1 dex) in all components. Si and Fe abundances with respect to S are plotted in Fig. 6 for different velocity components. Depletion of Si and Fe is apparent. All components, except the very special component b (at 480 km s-1 see previous Section), have similar abundance ratios (and therefore depletion factors), irrespective of whether H2 molecules are present or not. This has already been noted in the = 1.962 DLA system toward Q 0551366 (Ledoux et al. 2001b).
In Fig. 7, [Fe/S] is plotted as a function of [Si/S] as observed in the sub-components. It is apparent from the figure that there is a strong correlation between the two quantities. Note that the correlation is present (albeit with lower significance level) even if we do not consider the = 1.96822 component. This clearly demonstrates the existence of differential dust-depletion in a single DLA system. The depletion factors for three gaseous components of our Galaxy are overplotted on Fig. 7: cold and warm ISM and halo gas (Welty et al. 1999). It is clear that most of the velocity components have depletion patterns very close to that seen in warm and halo gas in our Galaxy. Only the = 1.96822 component has a pattern similar to that of the cold ISM phase.
It is important to note that the lowest depletion factor is recorded in component d (at 85 km s-1) that has high H2 content. In addition, components with similar dust-depletion factors can have very different H2 contents. This means that the presence of dust, though important to form H2 molecules at low temperature, is only one of the parameters, together with high particle density, low temperature and low UV-flux, that decide what is the molecular fraction in the gas.

5 Physical conditions in the gas
| (C i) | (C i∗) | (C i∗∗)a | (S ii) | ||||
| (10) | (10) | (10) | (km s-1) | (10) | (K) | ( | |
| Component a (H2)=2.39 cm-2 | |||||||
| 1.96679 | 11.61.00 | 5.230.58 | …. | 3.100.57 | 1.870.20 | 13.8 | 20-70 |
| 1.96691 | 7.290.45 | 3.560.59 | …. | 3.010.20 | …. | 14.5 | 20-80 |
| 1.96706 | 2.060.34 | 1.800.45 | …. | 4.931.44 | …. | …. | …. |
| Component b (H2)=3.46 cm-2 | |||||||
| 1.96822 | 10.90.03 | 12.60.06 | 5.830.30 | 4.300.20 | 1.440.06 | 20.0 | 170-200 |
| Component c (H2)=0.03 cm-2 | |||||||
| 1.97280 | 11.90.03 | 5.890.35 | …. | 5.980.28 | 1.420.18 | 13.0 | 40-60 |
| 1.97296 | 27.30.05 | 16.00.05 | 3.390.32 | 6.230.16 | 5.680.34 | 13.5 | 50-65 |
| 1.97316 | 4.560.34 | 2.130.46 | …. | 7.000.77 | 0.820.10 | 15.0 | 10-85 |
| Component d (H2)=0.02 cm-2 | |||||||
| 1.97365 | 2.100.24 | 1.30 | …. | 5.660.41 | 0.730.13 | 15.0 | |
| 1.97382 | 2.520.23 | 1.100.31 | …. | 4.520.42 | 1.320.15 | 15.5 | |
| 1.97399 | 0.810.23 | …. | …. | 7.301.02 | …. | …. | …. |
| 1.97417 | 0.310.16 | …. | …. | 0.370.27 | …. | …. | …. |
| Components with (H2) | |||||||
| 1.96737 | 8.150.63 | 5.910.79 | …. | 14.411.08 | 1.720.19 | 40-135 | |
| 1.96763 | 7.080.83 | 4.760.99 | …. | 27.143.38 | 1.33 | 20-180 | |
| 1.97109 | 1.900.12 | 1.30 | …. | 10.050.91 | ….. | ||
| 1.97144 | 9.100.62 | 8.050.60 | …. | 13.440.96 | …. | 18.5 | 65-160 |
| a The 2 upper limit is 1.51012 cm-2. | |||||||
C i is usually seen in components where H2 is detected (see however Srianand & Petitjean 1998) and it is possible to derive constraints on the particle density of the gas from the relative populations of the different levels of the C i ground term.
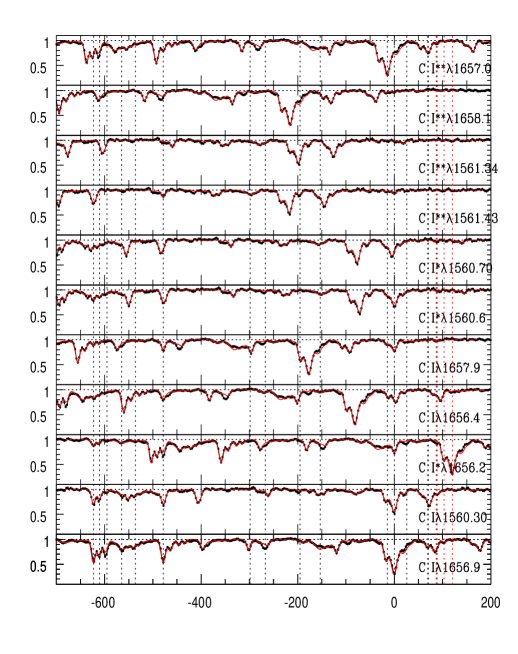
Absorption lines produced by C i and C i∗ are clearly seen in the four components of the DLA system toward Q 0013004 in which H2 is detected. However, C i∗∗ is seen only in two components at = 1.96822 and 1.97296. In addition, there are three components that show C i absorption without detectable H2 (, see also Srianand & Petitjean 2001). We perform simultaneous Voigt profile fits to the = 1560 and 1656 Å C i, C i∗ and C i∗∗ lines. The fit results are shown in Fig 8 and summarized in Table 4.
Upper limits on the Cosmic Microwave Background Radiation (hereafter CMBR) temperature, , are derived assuming that CMBR pumping is the only excitation mechanism. Results, given in column #7 of Table 4, are consistently larger than the value expected from standard hot big-bang model ( K, see Srianand et al. 2000). This is because other excitation processes are at play and in particular excitation by collisions. We estimate the particle density in the cloud assuming, = 8 K, = 100 K and neglecting fluorescence. The range given in column #8 of Table 4 are obtained using 2 uncertainties in the column density estimate.
As the ionization potential of C i is similar to the energy of photons in the molecular bands, it is expected that C i and H2 follow each other. It is therefore interesting to note that (C i) in component d is about a factor of 2 smaller than in component b whereas (H2) is at least a factor of ten larger. This is probably a consequence of much larger (H2)/(H i) ratio in component d. This conclusion is favored by the indication that the H i column density is probably of the same order of magnitude in both components as indicated by the S ii column densities (see Table 4).
C i, C i∗ and C i∗∗ are clearly detected in component b (see Fig 5). The excitation temperature of the = 1 H2 level is in the range 60-80 K. Assuming that the kinetic temperature has the same value and = 8 K, we derive that the particle density is in the range = 170-200 cm-3.
It is interesting to note that the components at = 1.96737, and 1.96763 have a large pressure. Considering the kinetic temperature to be 100 K implies = and cm-3K respectively. However, these components belong to the strong saturated absorption component at 600 km s-1 (see Fig. 2) with large O i and Si iii absorptions and no H2. It is most likely that the temperature of the gas is higher than what we use here (see Petitjean et al. 2000). For = 1000 K, we derive = 1075 cm-3 and 2854 cm-3, and = and respectively for the two components.
Such high pressures are seen in about one third of the C i gas in our galaxy (see Jenkins & Tripp 2001). This probably indicates that part of the gas in the system under consideration is subject to high compression due to either collapse, merging and/or supernovae explosions. The overall velocity structure of the system at = 1.9676 with the presence of molecular gas at and km s-1 from the center of the high-ionization gas strongly suggests the expansion of a spherical shell. In any case, intense star-formation activity is occuring in the vicinity of the gas.
6 Conclusion
The DLA system at = 1.973 toward Q 0013004 is peculiar in several aspects. Absorption lines from metal species are spread over about 1000 km s-1; in particular O i and C ii span 1050 km s-1. The velocity structure indicates the presence of two main sub-systems centered at 1.973 and 1.9674, separated by 550 km s-1 with, respectively, log (H i) = 20.83 and 19.4 and [S/H] = 0.81 and 0.18.
The low-ionization gas is conspicuous in the system. There is clear evidence that all species are at most twice ionized in the = 1.96822 component. This means that if photo-ionization dominates, there is probably very few photons with energy larger than 20 eV. More generally, (X+)/(X2+) 1 over the entire 1.973 system. This ionization state could reveal gas ionized by slow shocks. This idea is reinforced by the high pressure measured in a few components from C i absorptions.
H2 is detected in four main components, two very strong components (log (H2) 17) in the 1.973 system and two weaker components (log (H2) 16) in the 1.9674 system. The total column density is 17.8 log (H2) 20.0 and therefore the mean molecular fraction, = 2(H2)/(2(H2) + (H i)), is in the range 2.7 log 0.6 which is the highest molecular fraction observed in DLA systems.
The analysis of the (C i∗)/(C i) ratio in different components indicates that whenever H2 is detected, the particle density is high ( 30 cm-3). High density is also found for components without any H2 absorption detected. There is a hint for the depletion of metals within the components to be correlated to the (C i∗)/(C i) ratio. This suggests that depletion onto dust-grains could be larger for denser gas.
The component at = 1.96822 shows evidence for large depletion of iron and silicon relative to sulfur and zinc ([Fe/Zn] = 1.59, [Fe/S] = 1.74, [Zn/S] = 0.15, [Si/S] = 0.85) similar to what is observed in cold gas of the Galactic disk. The corresponding dust-extinction is small in this case because, although H2 is detected with log (H2) 16.5, the H i column density is small, log (H i) 19.4, in the component. This is direct evidence for a considerable fraction of heavy elements being locked into dust-grains, and, as a consequence, this supports the idea that the current sample of DLA systems might be biased against the presence of cold and dusty gas along the line of sight. Note that the rest of the gas shows a depletion pattern close to that of warm gas in the Galactic halo.
The overall kinematics of the system with the two strong sub-systems separated by 550 km s-1 suggests that the line of sight is passing through one or several objects in strong interaction. The velocity structure of the subsystem at = 1.9676 with the presence of molecular gas at and km s-1 from the center of the high-ionization absorptions strongly suggests the expansion of a spherical shell. All this, together with the strong inhomogeneity of the UV field, the high pressure in the gas and the high metallicities strongly suggests that intense star-formation activity is occuring in the vicinity of the system which should be revealed by deep imaging in the field.
acknowledgments
We gratefully acknowledge support from the Indo-French Centre for the Promotion of Advanced Research (Centre Franco-Indien pour la Promotion de la Recherche Avancée) under contract No. 1710-1. This work was supported in part by the European Communities RTN network ”The Physics of the Intergalactic Medium”. RS thanks the Institute of Astronomy in Cambridge and the Institut d’Astrophysique de Paris and PPJ thanks IUCAA for hospitality during the time part of this work was completed. CL acknowledges support from an ESO post-doctoral fellowship.
References
- [1] Abgrall, H., Le Bourlot, J., Pineau des Forêts, G., et al. 1992, A&A, 253, 525
- [2] Boissé, P., Le Brun, V., Bergeron, J., & Deharveng, J. M. 1998, A&A, 333, 841
- [3] Centurión, M., Bonifacio, P., Molaro, P., & Vladilo, G. 2000, ApJ, 536, 540
- [4] D’Odorico, S., Cristiani, S., Dekker, H., et al. 2000, Proc. SPIE Vol. 4005, p. 121
- [5] Ellison, S. L., Yan, L., Hook, I. M., Pettini, M., Wall, J. V., & Shaver, P. 2001, A&A 379, 393
- [6] Federman, S. R., Glassgold, A. E., Jenkins, E. B., & Shaya, E. J. 1980, ApJ, 242, 545
- [7] Ge, J., & Bechtold, J. 1997, ApJ, 477, L73
- [8] Ge, J., Bechtold, J., & Black, J. H. 1997, ApJ, 474, 67
- [9] Haehnelt, M. G., Steinmetz, M., & Rauch, M. 1998, ApJ, 495, 647
- [10] Hou, J. L., Boissier, S., & Prantzos, N. 2001, A&A 370, 23
- [11] Jenkins, E. B., & Tripp, T. M. 2001, ApJS, 137, 297
- [12] Ledoux, C., Bergeron, J., & Petitjean, P. 2001a, submitted
- [13] Ledoux, C., Srianand, R., & Petitjean, P. 2001b, submitted
- [14] Ledoux, C., Petitjean, P., Bergeron, J., Wampler, E. J., & Srianand, R. 1998, A&A, 337, 51
- [15] Lu, L., Sargent, W. L. W., Barlow, T. A., Churchill, C. W., & Vogt, S. S. 1996, ApJS, 107, 475
- [16] Morton, D.M. 1975, ApJ, 197, 85
- [17] Pei, Y. C., Fall, S. M., & Bechtold, J. 1991, ApJ, 378, 6
- [18] Petitjean, P., Srianand, R., & Ledoux, C. 2000, A&A 364, L26
- [19] Pettini, M., Smith, L.J., King, D. L., & Hunstead, R. W. 1997, ApJ, 486, 665
- [20] Prochaska, J. X., & Wolfe, A. M. 1997, ApJ, 474, 140
- [21] Prochaska, J. X., & Wolfe, A. M. 1999, ApJS, 121, 369
- [22] Savage, B. D., Bohlin, R. C., Drake, J. F., & Budich, W. 1977, ApJ, 216, 291
- [23] Savage, B. D., & Sembach, K. R., 1996, ARA&A, 34, 279
- [24] Srianand, R., & Petitjean, P. 1998, A&A, 335, 33
- [25] Srianand, R., & Petitjean, P. 2001, A&A, 373, 816
- [26] Srianand, R., Petitjean, P., & Ledoux, C. 2000, Nature, 408, 931
- [27] Varshalovich, D., Ivanchik, A., Petitjean, P., Srianand, R., & Ledoux, C. 2001, AstL, 27, 683
- [28] Vladilo, G. 1998, ApJ, 493, 583
- [29] Welty, D. E., Hobbs, L. M., Lauroesch, J. T., Morton, D. C., Spitzer, L., York, D. C., 1999, ApJS, 124, 465