Faraday Rotation Measures in the parsec scale jets
of the radio galaxies M87, 3C 111, and 3C 120
Abstract
Parsec scale Faraday rotation measure maps are presented for the radio galaxies M87, 3C 111, and 3C 120. These VLBA observations were made at 8, 12, and 15 GHz. M87 has an extreme RM distribution which varies from 4000 rad m-2 to more than 9000 rad m-2 across a projected distance of 0.3 parsecs in its jet. M87 has no polarized flux closer than 17 mas from the core. 3C 111 and 3C 120 both show polarized emission in their cores which is consistent with the expectations of unified schemes for these broad line radio galaxies. 3C 111 has an RM gradient which increases from rad m-2 4 mas from the core to rad m-2 on the side of the jet closest to the core. 3C 120 has a more moderate RM distribution in the jet of approximately 100 rad m-2 but this increases by an order of magnitude in the core.
1 Introduction
Several recent papers (Udomprasert et al. 1997, Cotton 1997 and Taylor 1998 & 2000) have demonstrated that extreme values of Faraday rotation of up to 40000 rad m-2 in the rest frame of quasars are possible. Zavala & Taylor (2001) showed that the Rotation Measure (RM) properties of quasars vary on both small spatial (parsec) scales and short timescales (1.53 years). These observations suggest that the observed RM distributions are intrinsic to the central few hundred parsecs of AGN and are not a foreground effect from the host galaxy ISM, the ICM, or the Milky Way. Hence, the observed Faraday rotation can serve as a probe of the magnetic field weighted by the electron density along the line of sight near the central engines of AGN. With the electron density supplied by spectral line diagnostics (e.g. Osterbrock 1989) an estimate of the magnetic field strength and orientation can be made provided one assumes a physically reasonable path length.
To date parsec-scale RM observations have only been made for quasars. Polarimetric observations of other classes of AGN are required in order to test the unified model for AGN (Antonucci, 1993) by looking for orientation effects in the RM distributions. In order to form a more complete picture of the parsec scale RM properties of AGN Taylor (2000) designed a sample of 40 quasars, BL Lacs, and radio galaxies for polarimetric observations. We have completed this survey with the VLBA and present here the first sub-parsec scale RM maps for radio galaxies.
We assume H km s-1 Mpc-1 and q0=0.5 throughout.
2 Observations and Data Reduction
The observations, performed on 2000 June 27 (2000.40), were carried out at seven widely separated frequencies between 8.1 and 15.2 GHz using the 10 element VLBA111The National Radio Astronomy Observatory is operated by Associated Universities, Inc., under cooperative agreement with the National Science Foundation.. Amplitude calibration and fringe-fitting were performed as in Taylor (2000). Feed polarizations of the antennas were determined using the AIPS task LPCAL. This calibration was performed twice, first using J0136478 with an accompanying CLEAN model for this polarized source. Plots of the real versus imaginary crosshand polarization data indicated that a satisfactory d-term solution was obtained. After this calibration was performed J2022616 was found to be unpolarized. The d-terms were solved for again using J2022616 as an unpolarized calibrator as a consistency check. Both sources produced nearly identical corrections for the d-terms, and J2022616 was used as the final d-term calibrator.
Absolute electric vector position angle (EVPA) calibration was determined by using the EVPA’s of J0854201, J0927390, J1310323 and J2202422 listed in the VLA Monitoring Program222http://www.aoc.nrao.edu/smyers/calibration/ (Taylor & Myers, 2000). The EVPA calibration at 8 GHz was readily obtained from the polarization calibration website. The observations were interpolated in time as necessary. Polarization monitoring observations at 8 and 22 GHz were interpolated to produce position angles at 12 and 15 GHz. Figure 1 shows calibrated position angle results for these four calibrators with the associated VLA data from the website. As a further test of our EVPA calibration we examined the rotation measure of component C4 of 3C 279 after the EVPA calibration was completed. In Zavala & Taylor (2001) C4 was shown to have a relatively low RM and at 8 GHz to at 15 GHz 2000 January 27. After the EVPA calibration for this experiment was completed we measured C4 and the EVPA was for all frequencies. Although C4 does vary its position angle and RM with time the agreement between the observations of 2000 January and 2000 July suggests that the polarization calibration was performed correctly.
To perform the rotation measure analysis data cubes in were constructed. There are four points across the 8 GHz band, and three points at 12.1, 12.5, and 15.17 GHz. This provides adequate short and long spacings in to properly recover RMs between 30000 rad m-2. The 12 and 15 GHz images used to produce the polarization angle maps were tapered to approximate the 8 GHz resolution, and a restoring beam matched to the 8 GHz beam was used.
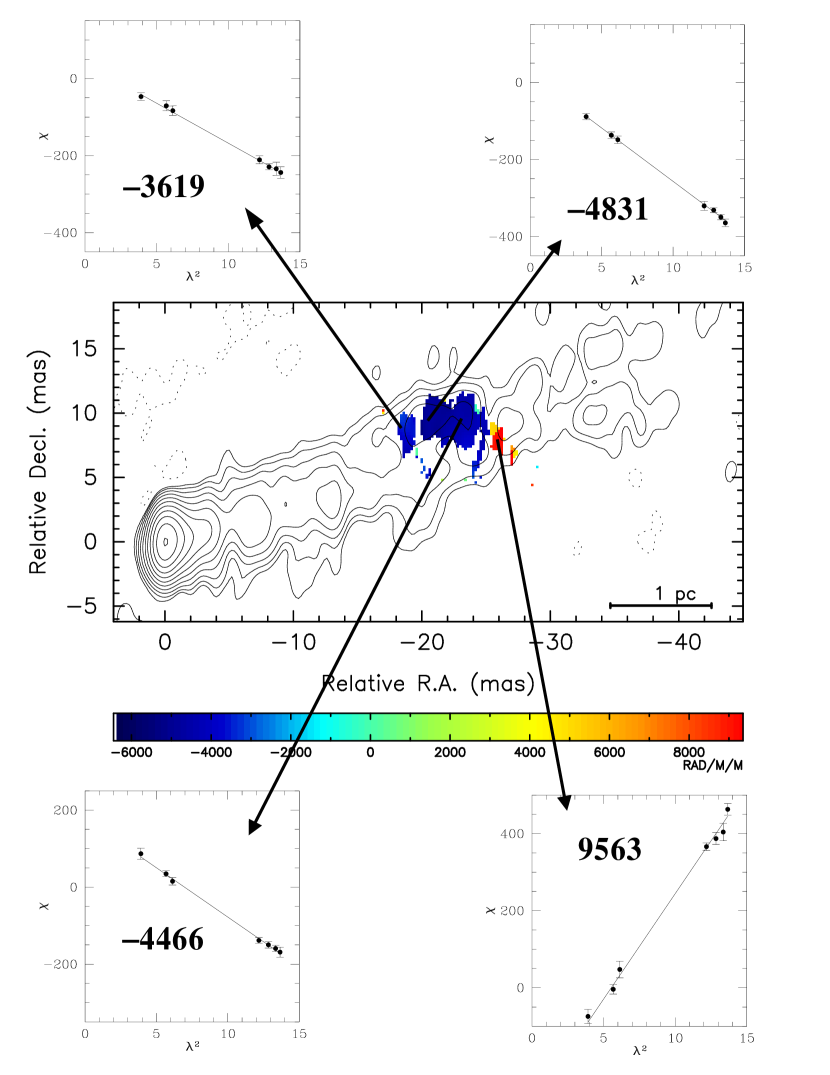
3 M87 Results
This well studied galaxy was shown by Junor et al. (2001) to have an average RM of rad m-2 which varied from to rad m-2. Our observations similarly show an extreme RM of to rad m-2 2224 mas from the core (Fig. 2). This RM distribution is coincident with a peak in total intensity which appears displaced northward from the inner 15 mas of the jet. The RMs are mostly between and with the exception of a patch where the RMs increase in magnitude by a factor two while changing sign to a positive slope. The sign change of the slope is significant, as it requires the magnetic field to change direction over a projected distance of 0.3 pc. Good agreement to the signature of Faraday rotation is seen as indicated by the inset plots in Figure 2.
Although the significant polarized flux at 8 GHz is limited to the region of the RM signal there is some (4.5 0.4 mJy) polarized emission at 15 GHz closer to the core. This occurs at 17 mas from the core, in a of total intensity (at 15 GHz) between the inner jet and the displaced peak in I at 2224 mas. The lack of corresponding polarized emission at 8 or 12 GHz is consistent with Faraday depolarization at lower frequencies if the RM gradient is greater than 2370 rad m-2 mas-1.
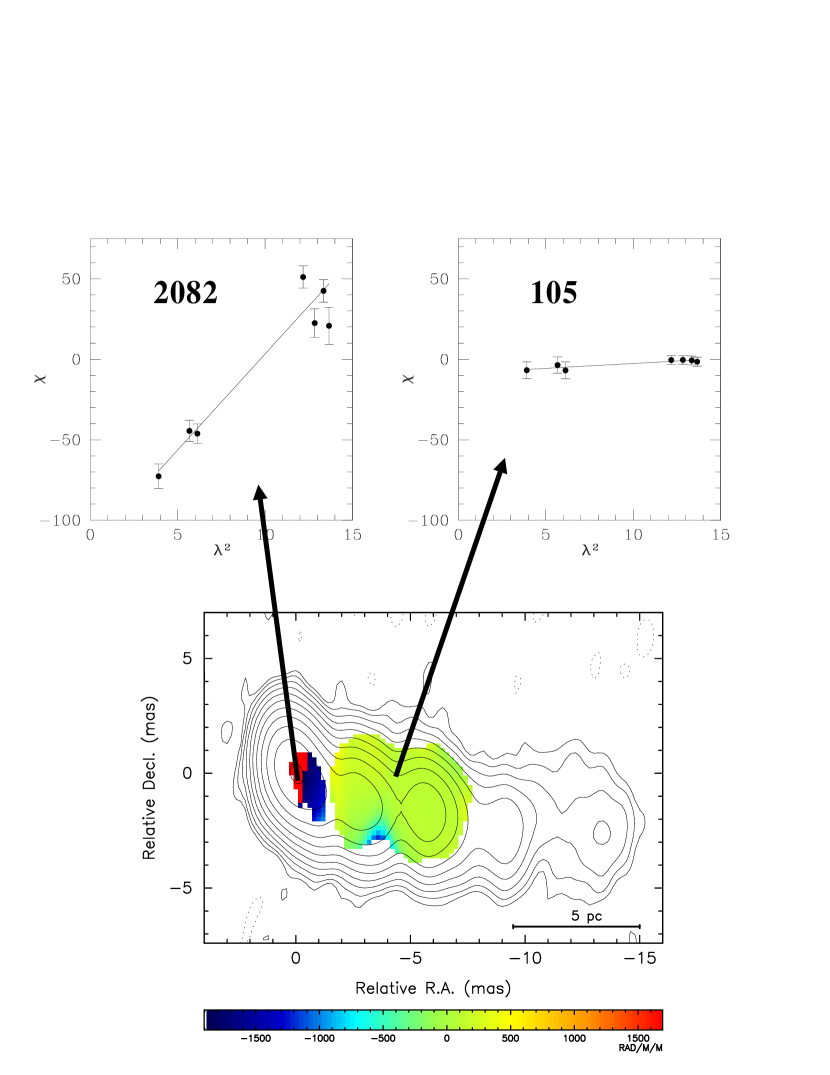
4 3C 111 Results
This broad line radio galaxy (BLRG) (Sargent, 1977) exhibits a gradient in RM towards the core. The RM changes from rad m-2 at 4 mas from the core to rad m-2 on the side of the jet closest to the core. As for M87, the polarized emission at 8 GHz for 3C 111 is limited to the region of the RM color overlay in Figure 3. However, significant polarized emission at 15 GHz (5.9 0.4 mJy) exists within 2 mas of the core in 3C 111. At the location of the left-hand insert in Figure 3 the percent polarization is 12 at 15 GHz. The percent polarization 1.3 mas NE of the core is 1.5 at the same frequency.
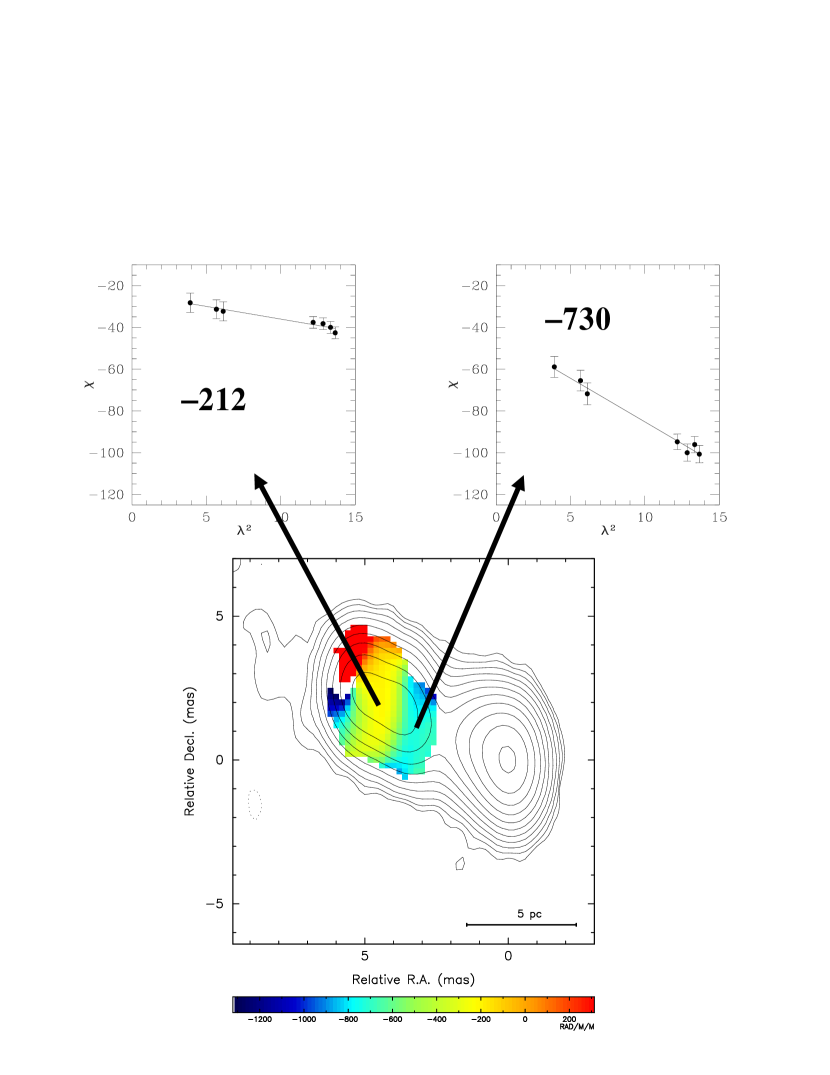
5 3C 120 Results
3C 120 is another BLRG (Tadhunter et al., 1993) and its polarization properties were monitored over 16 months with the VLBA by Gómez et al. (2000). Gómez et al. (2000) reported an RM in the jet of 3C 120 of rad m-2 based on measurements at 22 and 43 GHz. Our observation a little more than a year after Gómez et al. shows a much smaller RM distribution. In Figure 4 it is apparent that 3C 120 has the lowest jet RM distribution of the three radio galaxies presented here, rad m-2. The time variability of parsec scale RMs as seen in Zavala & Taylor (2001) is also present in 3C 120 (Gómez et al., 2000) and may account for the difference between our results and those of Gómez et al.
Contrary to M87 and 3C 111, 3C 120 has detectable polarized emission at all frequencies in the core and RMs of rad m-2 are present. As seen in Figure 4 the RM fits show considerable scatter at 8 GHz, and the reality of the sign change in the core RM distribution (from 2000 to 1000 rad m-2) is suspect as the negative slope area shows deviations from a law. The polarized flux within the core ranges from 4 0.6 mJy at 8 GHz to 0.6 mJy at 12 and 15 GHz. The range of (15GHz) in the jet reach maxima of 916, but within 1 mas from the center of the Stokes I image falls to 3 or less.
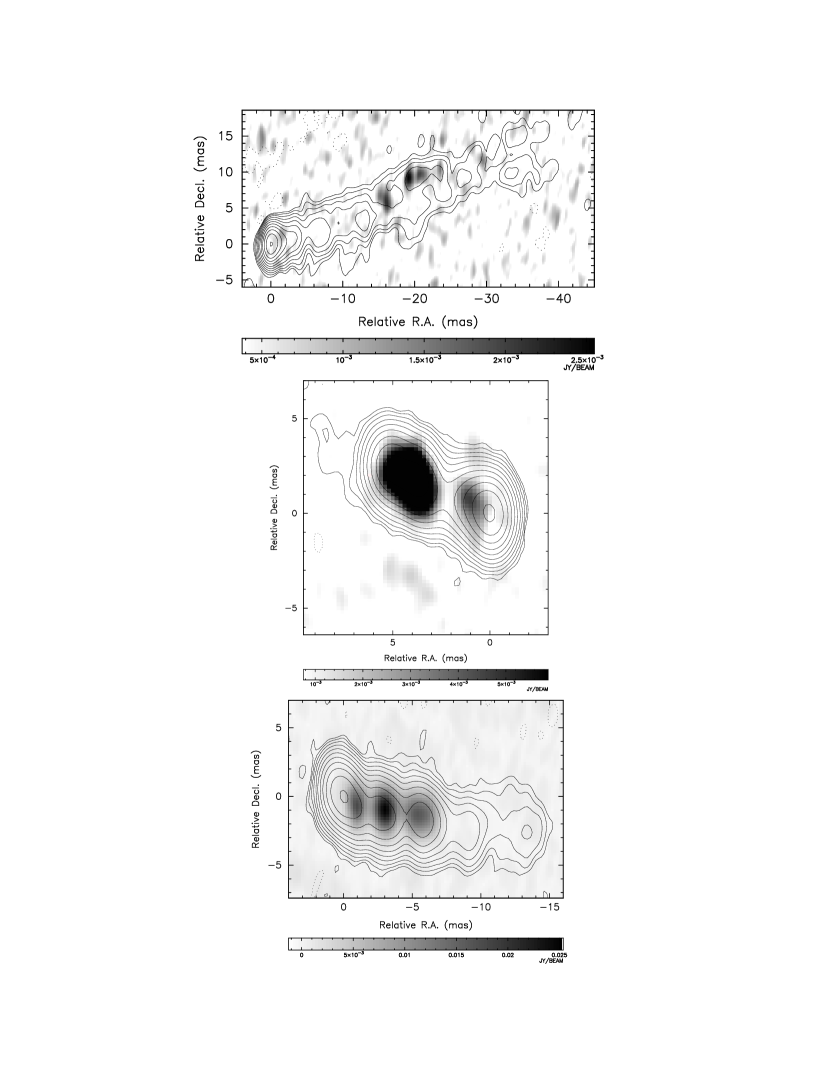
6 Implications for Unified Schemes
Unified models for AGN describe radio galaxies as substantially inclined to the line of sight. This scenario places the core of a radio galaxy behind a dense multi-phase obscuring disk. The disk is expected to produce a high enough RM that the radio galaxy core is essentially unpolarized. Such a picture appears reasonable for M87, which is classified as a narrow line radio galaxy (Stauffer & Spinrad, 1979). This picture is supported by the lack of any polarized emission from the core of M87 (Figure 5). The requisite disk was first reported by Harms et al. (1994), although recent IR observations of M87 failed to detect the expected dust torus (Perlman et al., 2001). Even if the thick dust torus is absent a mechanism which accounts for the lack of polarized flux less than 17 mas from the core is still required. Invoking a depolarizing Faraday screen requires such a screen to have a thickness of at least 3 parsecs. The RM data also require that the magnetic field be disordered on sub-parsec scales due to the sign change seen in the RM in Figure 2.
3C 111 and 3C 120 are classified as BLRGs and thus are expected to have jets more inclined towards the observer. Therefore, more polarized emission near the core might be expected as the central engine is uncovered by the obscuring torus. This is supported by the presence of polarized flux density at 15 GHz in the core for 3C 111 and at all three frequencies for 3C 120, consistent with their classification as BLRGs. Figure 5 illustrates this argument as both 3C 111 and 3C 120 have polarized emission at 15 GHz in their central regions.
Some caveats must be presented in this interpretation. Although M87 is classified as a NLRG, Sankrit, Sembach, & Canizares (1999) report that the Ly emission line has a width of 3000 km sec-1 which suggests that at least some of the broad line region (BLR) is indeed visible. Using a black hole mass of 2.4 M⊙ (Harms et al., 1994) a velocity of 1860 km sec-1 is achieved at an orbital radius of 3 parsecs. Thus, the RM distribution observed in M87 may be produced by the BLR itself. M87 is also a relatively low luminosity radio galaxy and may not provide a realistic comparison to more luminous objects. Lastly, the proximity of M87 also serves to expose details in its inner structure which may escape notice in 3C 111 and 3C 120 due to their greater distance.
7 Nature of the Faraday Screen
Given that Faraday rotation occurs, what part of the AGN plays the role of the Faraday screen? In Taylor (2000) this role was assigned to the narrow line region (NLR) itself, and the assumed properties of the NLR seemed consistent with the observed RMs. However, the NLR is assumed to have a low volume filling factor (Stauffer & Spinrad, 1979). Taking a typical value for of gives a covering factor of 0.01. Therefore, assuming a random distribution of NLR clouds, one should not expect the coherent RM distributions observed if only 1 percent of the beam is intersected by the screen. Alternatively, the screen may consist of clouds which are entrained by the jet, perhaps in a boundary layer. This would account for the observed covering factor of the screen. A similar idea is put forth by Gómez et al. (2000) who propose a cloud 0.4 pc across to explain the light curves and polarization properties of components in 3C 120.
To estimate a B field for a boundary layer screen in M87 we assume a scale size of 0.3 parsecs for clumps within the screen to match the scale size of the sign change of the RM slope. We use the electron density ne of 1100 cm-3 from Stauffer & Spinrad (1979) to obtain a magnetic field strength of 1634 Gauss. Such a field strength seems weak compared to Zeeman measurements in the center of our own galaxy of 0.5 mG (Crutcher et al., 1996) to 3 mG (Plante et al., 1995). If the magnetic field is in equilibrium with a gas at a temperature of 104K and using the electron density of Stauffer & Spinrad (1979) a magnetic field strength of 200Gauss is obtained.
The presence of broad Ly lines in M87 prompts consideration of the BLR as a Faraday screen. As discussed in §4 the observed Ly velocity could be found within 3 parsecs of the black hole, placing the Ly clouds along the line of sight to the jet in our VLBA images. However, at the expected density of ne 1010 cm-3 (Matthews & Capriotti, 1985) the BLR clouds are optically thick at 815 GHz (Marscher & Brown, 1975).
Lastly, we consider the hot, tenuous gas that is expected to confine the NLR clouds. Such a gas is expected to be disordered and radiation propagating through it should experience a random walk RM effect. This would produce an RM with a zero mean, Gaussian distribution. Such a distribution is definitely lacking for M87 and 3C 111, and possibly for 3C 120 as well. Without tighter constraints on the physical parameters it is not possible to discriminate between these, or other, Faraday screen scenarios.
References
- Antonucci (1993) Antonucci, R. 1993, ARA&A, 31, 473
- Cotton et al. (1997) Cotton, W. D., Dallacasa, D., Fanti, C., Fanti, R., Foley, A. R., Schilizzi, R. T., & Spencer, R. E. 1997, A&A, 325, 493
- Crutcher et al. (1996) Crutcher, R. M., Roberts, D. A., Mehringer, D. M., & Troland, T. H. 1996, ApJ, 462, L79
- Gómez et al. (2000) Gómez, J. L., Marscher, A. P., Alberdi, A., Jorstad, S. G., & García-Miró, C. 2000, Science, 289, 2317
- Harms et al. (1994) Harms, R. J. et al. 1994, ApJ, 435, L35
- Junor et al. (2001) Junor, W., Biretta, J. A., & Wardle, J. F. C. 2001, in IAU Symposium 205, Galaxies and their constituents at the highest angular resolutions, ed. R. T. Schilizzi, S. N. Vogel, F. Paresce & M. S. Elvis (San Francisco:ASP) 136
- Marscher & Brown (1975) Marscher, A. P. & Brown, R. L. 1975, ApJ, 200, 719
- Matthews & Capriotti (1985) Matthews, W. G. & Capriotti, E. R. 1985, in Astrophysics of active galaxies and quasi-stellar objects. ed. J. S. Miller (Mill Valley:University Science Books), 185
- Osterbrock (1989) Osterbrock, D. E. 1989, Astrophysics of Gaseous Nebulae and Active Galactic Nuclei (Mill Valley: University Science Books)
- Perlman et al. (2001) Perlman, E. S., Sparks, W. B., Radomski, J., Packham, C., Fisher, R. S., Piña, R., & Biretta, J. A. 2001, ApJ, 561, L51
- Plante et al. (1995) Plante. R. L., Lo, K. Y., & Crutcher, R. M. 1995, ApJ, 445, L113
- Sankrit, Sembach, & Canizares (1999) Sankrit, R., Sembach, K. R., & Canizares, C. R. 1999, ApJ, 527, 733
- Sargent (1977) Sargent, W. L. W. 1977, ApJ, 212, L105
- Stauffer & Spinrad (1979) Stauffer, J. & Spinrad, H. 1979, ApJ, 231, L51
- Tadhunter et al. (1993) Tadhunter, C. N., Morganti, R., di Serego-Alighieri, S., Fosbury, R. A. E., & Danziger, I. J. 1993, MNRAS, 263, 999
- Taylor (1998) Taylor, G. B. 1998, ApJ, 506, 637
- Taylor (2000) Taylor, G. B. 2000, ApJ, 533, 95
- Taylor & Myers (2000) Taylor, G. B. & Myers, S. T. 2000 VLBA Scientific Memo 26, National Radio Astronomy Observatory
- Udomprasert et al. (1997) Udomprasert, P. S., Taylor, G. B., Pearson, T. J., & Roberts, D. H. 1997, ApJ, 483, L9
- Zavala & Taylor (2001) Zavala, R. T. & Taylor, G. B. 2001, ApJ, 550, L147