Europium Isotopic Abundances in Very Metal-poor Stars11affiliation: Based on observations obtained with: (a) the Keck I Telescope of the W. M. Keck Observatory, which is operated by the California Association for Research In Astronomy (CARA, Inc) on behalf of the University of California and the California Institute of Technology: and (b) the H. J. Smith Telescope of McDonald Observatory, which is operated by the University of Texas at Austin.
Abstract
Europium isotopic abundance fractions are reported for the very metal-poor, neutron-capture-rich giant stars CS 22892-052, HD 115444, and BD +17∘3248. The abundance fractions, derived from analysis of several strong Eu II lines appearing in high-resolution spectra of these stars, are in excellent agreement with each other and with their values in the Solar System: fr(151Eu) fr(153Eu) 0.5. Detailed abundance studies of very metal-poor stars have previously shown that the total elemental abundances of stable atoms with atomic numbers z 56 typically match very closely those of a scaled solar-system -process abundance distribution. The present results for the first time extend this agreement to the isotopic level.
1 Introduction
Neutron bombardment reactions create all abundant isotopes of more than 60 elements of the periodic table. Neutron-capture (-capture) nucleosynthesis can occur slowly in the -process, in which decays have time to happen between successive neutron captures, or rapidly in the -process, in which enormous, but short-lived, neutron fluxes temporarily overwhelm -decay rates. After completion of an -capture event, the final isotopic abundance mix will be very different for the - and -processes. Detailed exploration of these -capture events can best be done with full knowledge of the isotopic abundances in stars over a large metallicity range. At present, this can be done for one star, the Sun, through the isotopic analysis of carbonaceous chondrite meteorites. Such analysis reveals a complex mix of - and -process contributions to Solar System -capture elements.
Meteoritic data can be obtained only for the Solar System, so -capture contents of other stars must be gleaned from their spectra. However, the isotopic wavelength shifts for transitions of almost all -capture elements are small compared to the thermal+turbulent line widths in stellar spectra. Thus isotopic abundance information is usually inaccessible, and confrontation of -capture predictions can only be done with total elemental abundances. In the most metal-poor stars, these abundances are very different than their total (- plus -process) Solar System values.
Neglecting the cases of anomalously carbon-rich stars, abundances of -capture elements with Z 56 in extremely metal-poor stars are consistent only with the -process component abundances in Solar-System material (e.g. McWilliam 1997; Burris et al. 2000; Sneden et al. 2000; Westin et al 2000; Cayrel et al. 2001). This agreement suggests that even though the -process is a very violent dynamical event that cannot be reproduced in the laboratory, and is very difficult to model theoretically, nature may be constrained to produce -process abundances in basically one fashion. But the case could be strengthened if the elemental abundances could be deconvolved into isotopic fractions. In this Letter we report a step in this direction, by demonstrating that abundance fractions of europium’s two stable isotopes are essentially equal in three -capture-rich halo stars, just as they are in the Solar System.
2 Observational Data and Isotopic Abundance Analysis
We consider three very metal-poor, but relatively -capture-rich, giant stars for which high-resolution (R = 45,000–60,000), high signal-to-noise (S/N 100 in the wavelength regions of interest) spectra have been employed in separate chemical composition analyses. The stars are: (a) CS 22892-052 (Keck I data, R 45,000; [Fe/H] –3.1 and [Eu/Fe] +1.6, Sneden et al. 2000); (b) HD 115444 (McDonald data, R 60,000; [Fe/H] –2.9 and [Eu/Fe] +0.8, Westin et al. 2000); and (c) BD +17∘3248 (Keck and McDonald data, [Fe/H] –2.1 and [Eu/Fe] +0.9, Cowan et al. 2001). We adopted the model atmosphere parameters and elemental abundances determined in these studies, which the reader should consult for detailed discussion of spectrum acquisition, data reduction, and overall abundance analysis.
In cool giant stars, europium exists almost exclusively in the Eu II species. About a half-dozen spectroscopically accessible strong transitions from low-lying excitation states of this ion can be studied. The Eu II energy levels have substantial hyperfine substructure, and the isotopic energy level shifts between stable isotopes 151Eu and 153Eu are also large, creating complex and broad absorption features. The ground-state configuration of Eu II is 4(8S)6, from which arise all of the strong blue-violet transitions that can be detected in stellar spectra. The unpaired 6 electron of this configuration produces large magnetic hyperfine splitting, making the blue-UV lines intrinsically broad. The 6 electron also produces the large isotope shift. The isotope shift is primarily a field shift due to the finite, and different, size of the two Eu nuclei.
Accurate new laboratory , hyperfine structure, and isotopic shift data for Eu II have been determined by Lawler, Bonvallet, & Sneden (2001). In their application of these data to the solar spectrum, Lawler et al. used synthetic spectrum computations to demonstrate (following the early work of Hauge 1972) that the Eu abundance fractions are essentially equal: fr(151Eu) fr(153Eu) 0.5, in good (and expected) agreement with the meteoritic values recommended by Anders & Grevesse (1989): fr(151Eu) = 0.478, fr(153Eu) = 0.522.
We adopted without change the line lists of Lawler et al. (2001), which include not only the Eu II hyperfine/isotopic components, but other atomic and molecular lines in small spectral regions surrounding the Eu lines of interest. Initial synthetic spectrum computations showed that the Eu II lines at 3819.67, 3907.11, 4129.72, and 4205.04 Å have the best combination of large isotopic splitting and relative freedom from contamination from other spectral absorption features. Then for each of these lines in each program star, we iteratively determined the best Eu isotopic fractions in the following manner. First, the line profiles over the whole synthesized wavelength region were used to determine the optimum spectral smoothing (a combination of spectrograph resolution and so-called stellar macroturbulent broadening). Next, as a trial we assumed that the meteoritic Eu isotopic fractions were correct, and determined the best Eu elemental abundance for the Eu II line (which always turned out to be within 0.03 dex of the mean Eu abundance for the star). Finally, the elemental abundance was fixed and the observed line profile was compared to synthetic profiles with different assumed isotopic fractions. This procedure was repeated until the spectral line shape was reproduced satisfactorily.
As one check of the isotopic fractions derived in this manner, we also determined the best overall synthetic/observed spectrum matches with simultaneous variations in elemental and isotopic abundances in producing the minimum residuals in the spectrum fits. However, the derived isotopic fractions proved to be essentially the same as those determined in the simpler procedure described in the previous paragraph.
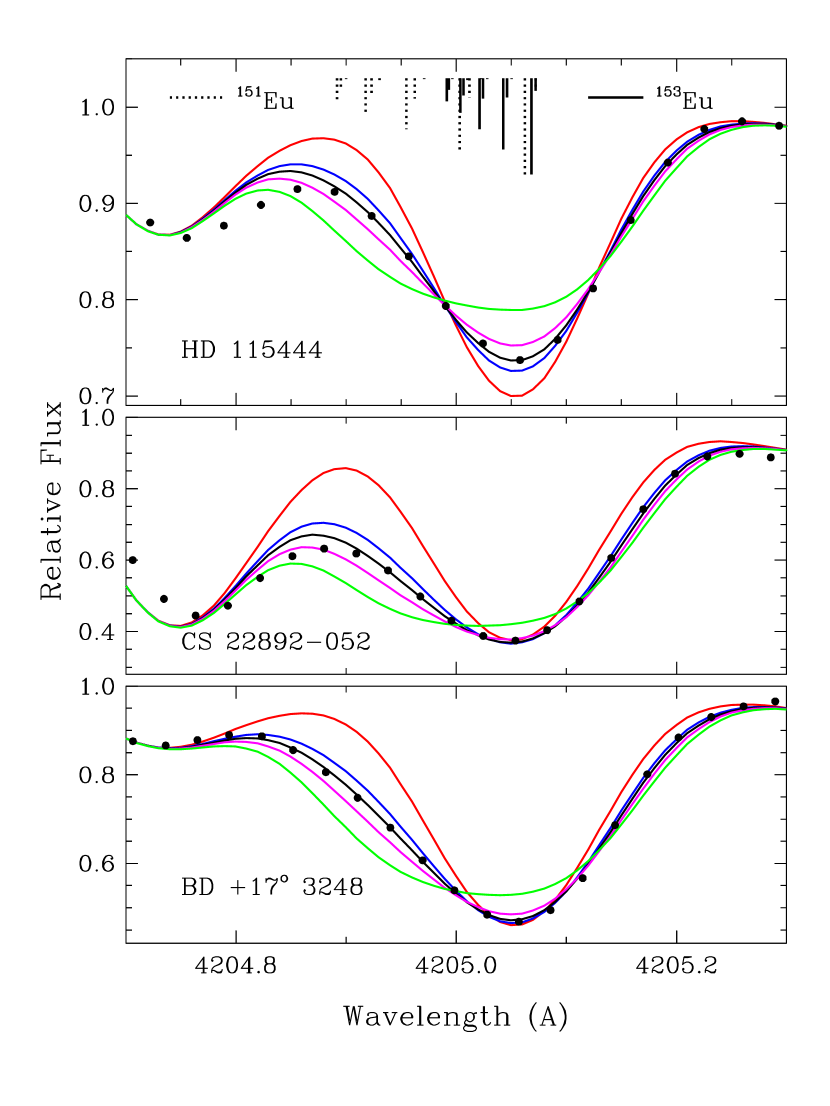
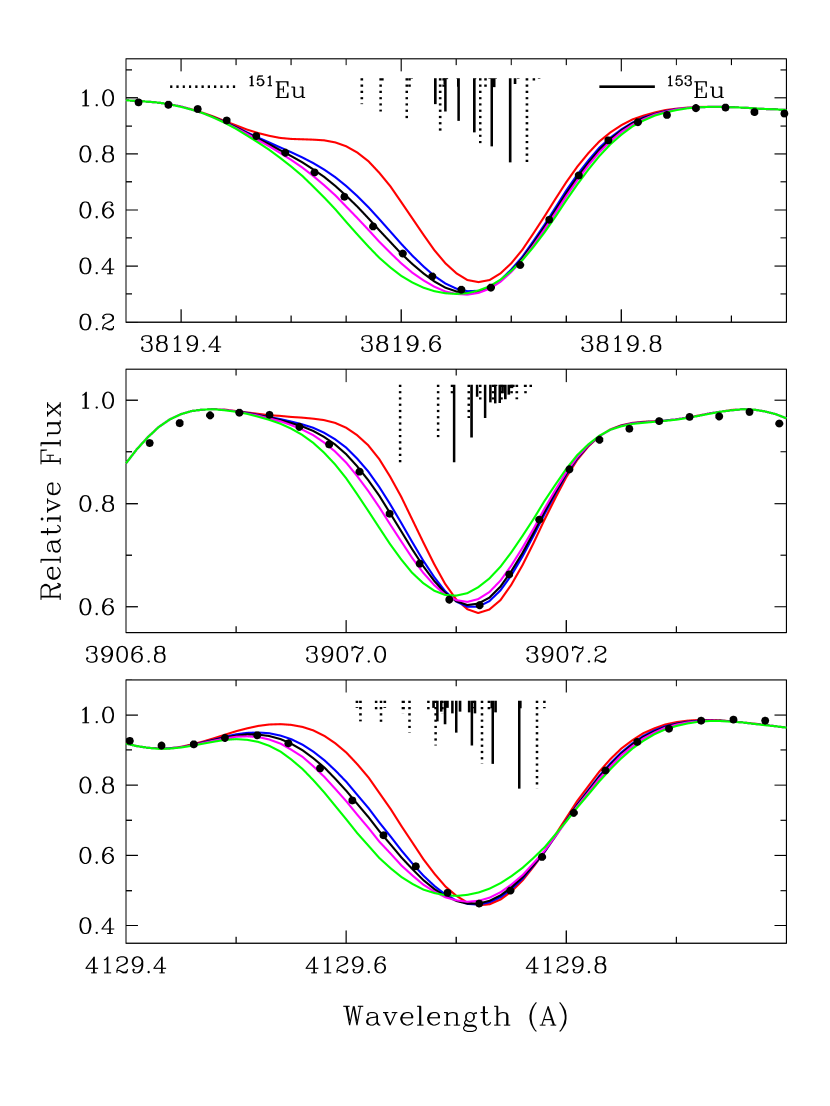
In Figure 1 we present synthetic and observed spectra of the Eu II 4205.04 Å line in each of the three program stars. In the top panel of this figure we have also marked vertical lines to indicate the wavelengths and relative strengths of the 151Eu and 151Eu subcomponents for the Eu II features. In Figure 2 the synthetic and observed spectra of BD +17∘3248 are shown for the other three Eu II lines that we employed in isotopic abundance derivations. In each panel of this figure the transition subcomponents are marked with vertical lines in the manner of Figure 1. Inspection of these component distributions reveals that the hyperfine pattern for 151Eu is much broader than that of 153Eu, in addition to being displaced blueward on average. These circumstances considerably aid the derivation of isotopic fractions. It is apparent from the Eu II line profiles shown in these figures that the assumption either of 151Eu or 153Eu dominance in the isotopic mix will not work, and in fact the observed profiles seem best matched by fr(151Eu) fr(153Eu) 0.5, just as in the solar photospheric spectrum.
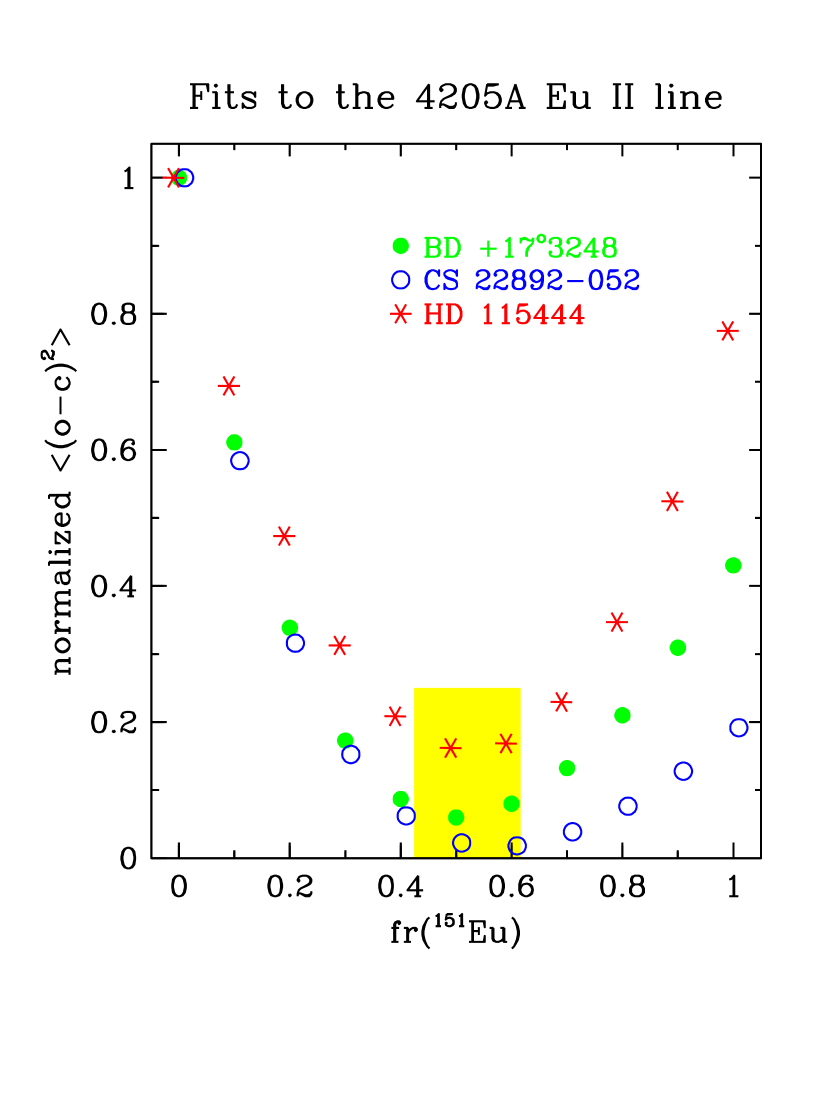
To obtain a more quantitative assessment of the isotopic fractions, we computed goodness-of-fit parameters for the observed 4205 Å line profiles under different isotopic fraction assumptions. Here an deviation has been computed at each of the observed spectrum points (refer back to the filled circles displayed in Figure 1) as the observed spectrum depth the computed depth. These mean deviations between observed and synthetic spectra are plotted in Figure 3, and they confirm the visual impressions from Figures 1 and 2. The analyses of each of the four Eu II lines in the three program stars yield essentially identical results, hence we suggest that in very-metal-poor -process-enhanced stars of the Galactic halo, fr(151Eu) = fr(153Eu) = 0.5 0.1. In short, we discern no deviation from the Eu isotopic mix in the Solar System.
3 Discussion and Conclusions
Both europium isotopes, 151Eu and 153Eu. are produced primarily by the r-process in Solar System material (see Käppeler et al. 1989), and thus this element has only a very small s-process contribution (Burris et al. 2000). These conclusions are based upon employing the classical or standard model for predicting s-process production and the associated r-process Solar System residuals. More complex models have been developed to predict s-process abundances in low- to intermediate-mass asymptotic giant branch (AGB) stars, the likely dominant site for this type of synthesis. However, even in these stellar models the calculated s-process abundances for 151Eu and 153Eu are small, and the abundance ratio remains solar (see Arlandini et al. 1999).
We can also rule out large amounts of -process contribution to the europium abundances of our program stars, either by past mass transfer from nearby AGB stars or from internal nucleosynthesis. Such events would yield large -process contributions to a number of elements, not just to europium. Consider, for example, the neighboring elements barium and lanthanum, whose synthesis in Solar System matter has been dominated by the -process. The mean observed abundance ratios of these elements with respect to europium for the program stars, from results of Sneden et al. (2000), Westin et al. (2000), and Cowan et al. (2001), are log (Ba/Eu) +1.0 and log (La/Eu) +0.2. But in the Solar System these (- plus -process) abundance ratios are +1.8 and +0.7, respectively (Burris et al. 2000). Moreover, -process computations by Malaney (1987) covering a large range of neutron exposure parameters yield values for the ratios of +2.5 and +1.3, respectively. It cannot be simultaneously argued that the europium abundances in our stars have significant -process components while their Ba/Eu and La/Eu elemental abundance ratios are more than an order of magnitude smaller than in the Solar System or in -process predictions.111 One abundance anomaly among the three target stars should be noted. The carbon abundance of CS 22892-052 is very large ([C/Fe] +1.0: McWilliam et al. 1995; Norris, Ryan, & Beers 1997) compared to that of the other two stars ([C/Fe] 0: Kraft et al. 1982; Westin et al. 2000; Cowan et al. 2001). Carbon overabundances in some very metal-poor stars usually are accompanied by significant -process abundance enhancements (e.g, Norris et al. 1997; Hill et al. 2000). However, some carbon-rich low metallicity stars are known to be -process-poor (Preston & Sneden 2001; Aoki et al. 2001). Probably the large carbon abundance and -capture enhancements of CS 22892-052 were generated in different nucleosynthesis events.
One further consideration would be whether the r-process itself might not always produce Solar System isotopic abundance ratios for europium. Those abundances are determined, for example, by the neutron number density and the corresponding flow “path” for this synthesis. However. such a variation would also affect other isotopes, producing non-solar elemental abundance ratios – something that is not observed in very metal-poor halo stars. Recent r-process models (e.g., Pfeiffer, Kratz, & Thielemann 1997; Cowan et al. 1999) that reproduce the observed solar r-process elemental abundances in these stars also replicate the Solar System isotopic ratios for elements such as europium.
The observed Solar System ratio of the europium isotopes in our sample of three low-metallicity, old halo stars suggests that successful r-process models will need to be those that match the Solar System r-process abundances, at least for the heaviest neutron-capture elements. Whether there is a narrow range of astrophysical and nuclear conditions (Cameron 2001), a narrow mass range for the sites of the r-process (Mathews et al. 1992; Wheeler et al. 1998), or some other constraining factors, there appears to be a uniformity in the production of these elements and, at least for europium, the isotopes. Several groups have high resolution and S/N data for other very metal-poor stars with enhanced rare-earth elemental abundances. Further Eu isotopic abundance analyses should be undertaken to determine if there are exceptions to the apparent equality of Eu isotopic fractions in low metallicity halo stars.
References
- Aoki et al. (2001) Aoki, W., Norris, J. E., Ryan, S. G., Beers, T. C., & Ando, H. 2001, ApJ, submitted.
- Anders & Grevesse (1989) Anders, E., & Grevesse, N. 1989, Geochim. Cosmochim. Acta, 53, 197
- Arlandini et al. (1999) Arlandini, C., Kappeler, F., Wisshak, K., Gallino, R., Lugaro, M., Busso, M., & Staniero, O. 1999, ApJ, 525, 886
- Burris et al. (2000) Burris, D. L., Pilachowski, C. A., Armandroff, T. A., Sneden, C., Cowan, J. J., & Roe, H. 2000, ApJ, 544, 302
- Cameron (2001) Cameron, A. G. W. 2001, ApJ, in press
- Cayrel et al. (2001) Cayrel, R., et al. 2001, Nature, 409, 691
- Cowan et al. (1999) Cowan, J. J., Pfeiffer, B., Kratz, K.-L., Thielemann, F.-K., Sneden, C., Burles, S., Tytler, D., & Beers, T. C. 1999, ApJ, 521, 194
- Cowan et al. (2001) Cowan, J. J., Sneden, C., Burles, S., Ivans, I. I., Beers, T. C., Truran, J. W., Lawler, J. E., Primas, F., Fuller, G. M., Pfeiffer, B., & Kratz, K.-L. 2001, ApJ, submitted
- Hauge (1972) Hauge, O. 1972, Sol. Phys., 27, 286
- Hill et al. (2000) Hill, V., Barbuy, B., Spite, M., Spite, F., Cayrel, R., Plez, B., Beers, T. C., Nortström, B., Nissen, P. E. A&A, 353, 557
- Käppeler et al. (1989) Käppeler, F., Beer, H., & Wisshak, K. 1989, Rep. Prog. Phys., 52, 945
- (12) Kraft, R., Suntzeff, N., Langer, G., Carbon, D., Trefzger, C., Friel, E., & Stone, R. 1982, PASP, 94, 55
- Lawler et al. (2001) Lawler, J. E., Bonvallet, G., & Sneden, C. 2001, ApJ, 556, 452
- Malaney (1987) Malaney, R. A. 1987, ApJ, 321, 832
- Mathews, Bazan, & Cowan (1992) Mathews, G. J., Bazan, G., & Cowan, J. J. 1992, ApJ, 391, 719
- McWilliam (1997) McWilliam, A. 1997, ARA&A, 35, 503
- McWilliam et al. (1995) McWilliam, A., Preston, G. W., Sneden, C., & Searle, L. 1995, AJ, 109, 2757
- (18) Norris, J. E., Ryan, S. G., & Beers, T. C., 1997, ApJ, 488, 350
- Pfeiffer et al. (1997) Pfeiffer, B., Kratz, K.-L., & Thielemann, F.-K. 1997, Z. Phys. A, 357, 235
- Preston & Sneden (2001) Preston, G. W., & Sneden, C. 2001, AJ, 122, 1545
- (21) Sneden, C., Cowan, J.J., Ivans, I. I., Fuller, G. M., Burles, S., Beers, T. C., & Lawler, J. E. 2000, ApJ, 533, L139.
- Westin et al. (2000) Westin, J., Sneden, C., Gustafsson, B., & Cowan, J.J. 2000, ApJ, 530, 783
- Wheeler et al. (1998) Wheeler, C., Cowan, J. J., & Hillebrandt, W. 1998, ApJ, 493, L101