Evidence for a developing gap in a 10 Myr old protoplanetary disk
Abstract
We have developed a physically self-consistent model of the disk around the nearby 10 Myr old star TW Hya which matches the observed spectral energy distribution and 7mm images of the disk. The model requires both significant dust size evolution and a partially-evacuated inner disk region, as predicted by theories of planet formation. The outer disk, which extends to at least 140 AU in radius, is very optically thick at infrared wavelengths and quite massive () for the relatively advanced age of this T Tauri star. This implies long viscous and dust evolution timescales, although dust must have grown to sizes of order cm to explain the sub-mm and mm spectral slopes. In contrast, the negligible near-infrared excess emission of this system requires that the disk be optically thin inside 4 AU. This inner region cannot be completely evacuated; we need 0.5 lunar mass of 1 m particles remaining to produce the observed m silicate emission. Our model requires a distinct transition in disk properties at AU, separating the inner and outer disk. The inner edge of the optically-thick outer disk must be heated almost frontally by the star to account for the excess flux at mid-infrared wavelengths. We speculate that this truncation of the outer disk may be the signpost of a developing gap due to the effects of a growing protoplanet; the gap is still presumably evolving because material still resides in it, as indicated by the silicate emission, the molecular hydrogen emission, and by the continued accretion onto the central star (albeit at a much lower rate than typical of younger T Tauri stars). TW Hya thus may become the Rosetta stone for our understanding of the evolution and dissipation of protoplanetary disks.
1 Introduction
The discovery of extrasolar planets (Marcy & Butler 1998 and references therein) has opened up a new era in the study of planetary systems. While many important clues to the processes of planet formation can be obtained from studies of older systems, the best tests of formation scenarios will require the direct detection of actively planet-forming systems.
It is thought that the formation of giant planets involves the sweeping up of material in a wide annulus in the circumstellar disk, resulting in the development of a gap (Lin & Papaloizou 1986, 1993; Bryden et al. 1999). Material inside the planet-driven gap can continue to accrete onto the central star; if the planet can prevent material from accreting across the gap into the inner disk, the eventual result would be the evacuation of the region interior to the planet. In the case of the Solar System, the formation of Jupiter might have prevented outer disk gas from reaching the inner solar system; the inner gas disk accreted into the Sun, while solid planetesimals remaining behind eventually formed the terrestrial planets.
The above scenario suggests that the signature of a forming giant planet would be the presence of a gap that is not entirely evacuated. In this case dusty emission from the inner disk might still be observable. In addition, giant planet formation requires the prior consolidation of large solid bodies to serve as cores for subsequent gas accretion; while such bodies would be invisible with current techniques, one would expect to see evidence for substantial growth in dust particles. Finally, if the inner disk has not been completely evacuated by the forming planet, one might expect to observe continued accretion onto the central star, as all T Tauri systems with inner disks as detected from near-infrared disk emission are also accreting (Hartigan et al. 1990).
In this article we propose that the relatively young low-mass star TW Hya has a developing gap in its inner disk qualitatively similar to that expected from planet formation. The evidence supporting this this proposal is: (1) reduced (optically-thin) emission from the inner disk; (2) mm-wave spectra which seem to require grain growth; (3) extra emission from the edge of the outer disk; and (4) continued accretion onto the central star, albeit at a rate substantially lower than that observed from most T Tauri stars. TW Hya has an age of 10 Myr and so according to current theories it is quite likely to be close to the epoch of planet formation. It is also part of an association of young stars of similar age, but it stands out in that it is the only system still accreting at a substantial rate (Muzerolle et al. 2000). The (outer) disk of TW Hya is quite massive, so that there is likely to be more than enough material available to form giant planet(s). TW Hya is also the closest known such system, and so it will be a prime target for following studies to confirm our model.
2 Observations
The observations used to constrain our disk model are taken from the literature. In addition, we have obtained a narrow-band L (3.55-3.63 microns) measurement of TW Hya on June 14th, 2000 with the Australian National University 2.3-m telescope at Siding Spring, using the near infrared camera CASPIR (Cryogenic Array Spectrometer Imager; McGregor et al. 1994). CASPIR contains a 256x256 InSb array. TW Hya was imaged at L with a pixel scale of 0.25 arcseconds and an on-source integration time of 236 seconds. The standard star BS4638 (magnitude 4.50 at L) was observed at a similar airmass to TW Hya and was used to calibrate the magnitude of TW Hya. The L magnitude we obtained was 7.12, equivalent to 0.39Jy.
This measurement is important in constraining the amount of near-infrared excess in the system. Using K=7.37 (Webb et al. 1999), K-L = 0.25. The K-L color for a K7V star is 0.11 (Kenyon & Hartmann 1995), which would yield an infrared excess of 0.14. However, such small infrared excess does not necessarily imply emission from disk material (Wolk & Walter 1996). For example, the non-accreting stars in Taurus (spectral types K7 to M2) have K-L between -0.05 and 0.25, while 95% of the accreting stars in Taurus have K-L between 0.35 and 1.2 (Meyer, Calvet, & Hillenbrand 1997). This small value of K-L is consistent with the simultaneous flux measurements of Sitko et al. (2000) indicating little if any hot dust emission at wavelengths m, though it is difficult to rule out completely any excess.
3 Model assumptions
We assume that the heating of the disk is due to stellar irradiation and viscous dissipation, and calculate self-consistently the disk heights and temperatures following the methods we have applied to interpret young 1 Myr old disks (D’Alessio et al. 1998 = Paper I, 1999 = Paper II, 2000 = Paper III.) We adopt , and K for the stellar mass, radius, and effective temperature (Webb et al. 1999), and a mass accretion rate of as derived by Muzerolle et al. (2000), which we take as constant through the whole disk. The inclination of the disk axis to the line of sight is , in agreement with the nearly symmetric HST images (Krist et al. 2000), and we adopt the Hipparcos distance of 55 pc (Wichmann et al. 1998).
With the assumption of steady accretion, the disk surface density scales as , with is the midplane temperature (see Paper II). The temperature does not vary much between acceptable models, partly because it is mostly determined by irradiation heating, not viscous energy dissipation. The disk mass therefore is roughly constant for constant . Moreover, for long wavelengths where much of the disk is optically thin, the emergent fluxes also tend to scale in the same way. For the purposes of fitting, we vary the parameter as the dust opacities are varied, but note that varying is equivalent to varying the disk mass, because is fixed. To first order, however, choices with constant are acceptable.
We use a dust mixture consisting of silicates, refractory organics, troilite and water ice, following Pollack et al. (1994 = P94). The dust size distribution is taken to be , with , between given and . Optical properties for the compounds are taken from Jäger et al. (1994), P94, Begemann et al. (1994; also see Henning et al. 1999), and Warren (1984). We consider the grains to be compact segregated spheres, and calculate the opacity using a Mie scattering code (Wiscombe 1979). Sublimation temperatures for the different grain types are taken from P94.
4 Disk model
The spectral energy distribution (SED) of TW Hya is shown in Figure 1. References for the observational data are given in the figure caption. Note that our narrow-band L observation overlaps with Sitko et al. (2000) fluxes.
In Figure 1, we compare the SED with the median SED for Myr-old T Tauri stars in the Taurus molecular cloud (Paper II), normalized to the TW Hya stellar photosphere at (m), thus compensating for the differing distances and stellar luminosities. Even though the fluxes of TW Hya are relatively high compared with the median Taurus SED at m, there is a large flux deficit in TW Hya below 10 microns (Jayawardhana et al. 1999); in particular, fluxes are essentially photospheric below m (Sitko et al. 2000). The flux deficit below 10 m has lead to inferences of disk clearing inside a few AU from the central star (Jayawardhana et al. 1999), but since the disk is still accreting mass onto the star (Muzerolle et al. 2000), it has to extend all the way into the corotation radius at least, so the inner disk radius has to be 0.03 AU (inferred from the 2 day photometric period [Mekkaden 1998]).
We show below that models with a uniform dust well-mixed with the gas throughout the disk extending all the way onto the inner radius cannot explain these features of the SED. The observations are much better understood if the disk is divided into two regions: the outer disk, which is more nearly comparable to the structure inferred for typical T Tauri disks (Paper III), and the inner disk, which is much more optically thin than in typical T Tauri disk models.
4.1 Outer disk
As discussed in Paper II, ISM dust mixtures (with small ) cannot explain the far-IR and mm-wave fluxes of T Tauri stars. The similarity between the median Taurus SED and that of TW Hya at wavelengths m suggests disk models of the type explored in Paper III, in which we allow for growth to large particles, can in principle explain the observations.
Figure 2 shows results for flared, irradiated disk models calculated with the methods of Paper III. The model SEDs shown are for = 1 mm (which fits the median SED in Taurus; Paper III), 1 cm, and 10 cm, calculated with abundances in the dust mixture usually assumed for protoplanetary disks (P94), which yield a dust-to-gas ratio of 0.013. It can be seen that models where grains have grown to cm provide a much better fit to the long-wavelength SED than the mm model, requiring no or very little additional emission from a wind or non-thermal sources. Models with mm fail to reproduce either the sub-mm and mm spectral slopes or the total flux levels for reasonable disk masses.
Assuming an outer disk radius of AU, comparable to the radius at which Krist et al. (2000) find a rapid decline in disk density, the disk mass is , 0.06, and for the mm, 1 cm, and 10 cm models, or , and , respectively. The cm model has a Toomre parameter at its outer edge and so is near the limit expected for gravitational stability. The high mass values are due to the opacity at 7 mm, which decreases as (for , see Paper III), so higher masses are needed to account for the flux for larger grain mixtures. For example, for the = 10 cm mixture, the opacity at 7 mm is a factor of 3 lower than the frequently assumed law (Beckwith & Sargent 1991) and the slope is slightly flatter, (cf. Paper III, Figure 2).
Our total disk mass estimates, using the dust-to-gas ratio of 0.013, are much higher than the gas mass obtained by Kastner et al. (1997) from 12CO emission, . This discrepancy may be attributed to a large degree of molecular depletion or to the fact that optical depth effects may not have been properly included (Beckwith & Sargent 1993); it could also be due to molecules existing in the gas phase only in the hot upper atmospheric layers of the disk where only a small amount of mass resides (Willacy & Langer 2000). An alternative to high disk masses, not considered in this work, is to have larger opacities at 7 mm than we obtain; porous aggregates, specially for amorphous carbon particles, may result in such larger opacities (Stognienko, Henning & Ossenkopf 1995). Our results for grain growth are not unique. However, within the assumptions we have made concerning dust opacities, we cannot reproduce the mm-wave fluxes and spectral slope without including dust particles much larger than those of a “standard ISM” mixture (see Paper III). Beckwith & Sargent (1991) noted that optical depth effects could make the mm-wave spectral slope flatter, and thus reduce or eliminate the need for grain growth. However, we are unable to make TW Hya disk sufficiently optically thick over its large radial extent.
4.2 Edge of the outer disk
The well-mixed grain-growth models of Figure 2, with self-consistently calculated temperature structures, exhibit too little emission in the m wavelength region in comparison with observations. In principle, disk models with more small particles could have higher fluxes. However, it is apparent that these models also predict far too much flux at wavelengths m, because they are too optically thick in the inner regions; this suggest that some clearing has occurred in the inner disk. Moreover, it suggest that the outer disk should have an optically-thick edge in which extra heating could be important.
In the case of irradiation of an optically thick disk with a smoothly-varying thickness, the stellar flux captured by the disk (and thus the disk heating per unit area) depends on the cosine of the angle between the direction of incidence of the stellar beam and the normal to the disk surface (Kenyon & Hartmann 1987). In general, stellar radiation penetrates the disk very obliquely, so is fairly small, (cf. D’Alessio 1996). However, if the disk had an inner edge, this portion of the disk would be illuminated by the star more directly, increasing dramatically and thus increasing the amount of irradiation heating. We propose that the outer regions of the TW Hya disk can be described as in §4.1, but that it is truncated at a few AU by a steep, optically thick region, where most of the mid-IR flux excess arises (Figure 3). Inside this region lies the inner optically thin disk, which produces negligible continuum flux.
To calculate the emission of the disk edge, we have assumed that its irradiation surface, that is the surface where most of the stellar energy is deposited, has a shape given by , where is the height of irradiation surface of the outer disk at radius and is a characteristic width of the edge. The edge continuum emission is produced in the photosphere, which for simplicity we take as the irradiation surface; above this layer, there is a hotter optically thin region, the atmosphere, which we take as isothermal (cf. Chiang & Goldreich 1997). We think that a more detailed treatment of the structure of this region is not necessary given the exploratory nature of this study. The temperature of the edge photosphere, assuming that half of the intercepted flux reaches the photosphere, is given by
| (1) |
where is obtained from . The flux is evaluated as
| (2) |
where is a the radius where the disk becomes optically thin, and .
The location of the outer disk edge and its width, characterized by and , are fairly well restricted by the mid-infrared excess, although the actual shape is not so well constrained as long as most of it faces the star. In general we find 0.5 AU, because the shape of the excess is fairly narrow and thus cannot be produced by a region with a large range of temperatures. In addition, if is much smaller than 4 AU, then the edge is too hot and there is too much excess below 10 m. Similarly, if is much larger, there is too little flux. With 4 AU and 0.5 AU, varies from at = 3 AU to at = 4 AU, and varies from 80 to 100 in this range. The resulting continuum flux is shown in detail in the lower panel of Figure 4, while the upper panel shows the fit to the SED of the composite disk model.
The temperature of the optically thin atmosphere of the edge is given by
| (3) |
where is the geometrical dilution factor, , for , and and are Planck mean opacities calculated at the stellar and local radiation fields, respectively (cf. Paper I, Paper II, Paper II). The contribution to the flux from this region is given by eq. (2), with and , where and are the optical depth and extinction coefficient at the characteristic wavelength of the stellar radiation. We follow Natta et al. (2000) taking , but in this work we include the effect of scattering at the wavelengths at which the stellar radiation is absorbed. The neglect of scattering in the calculation of leads to artificially large values of and thus of , and would be only appropriate if scattering was completely forward. However, the asymmetry parameter , with the scattering angle, is in general , and this approximation is not valid. We have included the effect of scattering using , where , , are the absorption and scattering coefficients and the asymmetry parameter for the assumed dust mixture, all evaluated at the characteristic wavelength of the stellar radiation.
We assume that the atmosphere of the edge has small grains so it can produce emission in the silicate feature. We considered different glassy and crystalline pyroxenes and olivines (with optical properties from Laor & Draine 1993, Jäger et al. 1994, and Dorschner et al. 1995). We find that glassy pyroxene has one of the highest ratios as required for producing a strong band (see also Natta et al. 2000). However, even with the increasing heating at the disk edge, the conspicuous silicate emission feature seen in the SED of TW Hya cannot be explained by emission from the atmospheric layers of the edge. This is due in part to the inclusion of scattering of stellar light in the calculation of , as discussed above, and in part to the adopted dust mixture; organics dominate the opacity at the stellar wavelength (Paper III, Figure 2), yielding . Note that the atmosphere of the optically thick outer disk, which is irradiated less frontally by the star and is thus cooler than the atmosphere of the edge, cannot produce significant silicate emission either.
4.3 Inner disk
Since the region inside the outer disk edge is not empty because material is still accreting onto the star (Muzerolle et al. 2000), we have explored the possibility that a small amount of particles coexists with the accreting gas of the inner disk, giving rise to silicate feature emission, while on the other hand still resulting in negligible continuum flux.
We assume that the temperature of the dust in this region is given by equation (3). The emergent intensity is calculated as m), where , the optical depth at m, is a parameter. This region extends to AU, the radius where grains sublimate. We find that we can fit the silicate feature with , see Figure 4, lower panel; this optical depth is small enough for the disk continuum emission in the near infrared to be negligible. The best fit to the profile is achieved with glassy pyroxene, in agreement with the fact that the profile is closer to that in young stars than in comets (Sitko et al. 2000). The grain sizes are in the range m and m. Smaller grains have much higher temperatures and produce too much emission at short wavelengths, resulting in a narrower silicate profile than observed. Bigger grains produce too little emission.
From , we get a column density for the m dust of , which implies a mass inside 4 AU of g 0.5 lunar masses. A strong lower limit to the mass of gas in the inner disk can be obtained from the observed rate of gas accretion onto the star assuming that the material in the inner disk is in free-fall towards the star, . Inside 4 AU, we obtain . Another lower limit can be obtained from , assuming a normal dust-to-gas ratio, yielding and a mass earth masses. If solid material is hidden into large bodies, then the mass in gas could be much higher than this value. From this limit, nonetheless, we can get an upper limit for the radial velocity of the gas at 1 AU, , so the gas probably drifts inwards slowly, following nearly Keplerian orbits in the inner disk.
Weintraub, Kastner, and Bary (2000) have detected a flux of in the 1-0 S(1) line of towards TW Hya. Using Tiné et al. (1997) models, we can estimate a flux in this line at 55 pc, , where is the emissivity per molecule. For a gas temperature of 1000K and a ionization rate of , estimated with typical parameters and an X-ray luminosity (Kastner et al. 1997) using the Glassgold, Najita, & Igea (1997) corrected expression, is for densities (because the line becomes thermalized; S. Lepp, personal communication). Assuming a disk height of 0.05 AU, we estimate inside 4 AU, so from the mass limit estimated above, we see that the observed very likely arises in the inner disk. Firmer conclusions require a determination of the gas temperature in the inner disk, which is left for future work.
4.4 Model tests: comparison with VLA 7 mm Data
In principle, observations of disk surface brightness distributions can be used to test our physically self-consistent models based on SED fitting. The optical and near-infrared scattered light distributions presented by Krist et al. (2000) and Trilling et al. (2001) do not have sufficient resolution to probe our inner disk region; however, they do provide constraints on our outer disk structure. We find that the scattered light fluxes predicted by the cm model presented above matches the observations of Krist et al. (2000) reasonably well, although Krist et al. find evidence for structure that cannot be reproduced in detail with disk properties smoothly-varying with radius, as assumed here. This work will be reported in a forthcoming paper (D’Alessio et al. 2001).
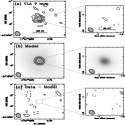
The high angular resolution data at 7 mm from the Very Large Array (Wilner et al. 2000) begin to approach the resolution needed to probe the inner disk, as well as constrain the thermal dust emission of the outer disk instead of simply the scattering surface, and thus provide an additional test of our model. Moreover, the imaging data provide an independent test, since the model was constructed only to match the SED. The value of sets an upper limit to the opacity at m, so the inner disk should not contribute significantly to the emission at 7 mm. We have calculated the intensity profile of the disk, assuming different values for the brightness temperature of the edge between 3 and 4 AU, since we do not know the properties of its interior. An upper limit for is the surface temperature, 100K, but it could be lower if it was optically thin at 7 mm, so we have varied between 60K and 100K.
Figure 5a shows the 7 mm images at two angular resolutions. The “low” resolution image (, about 35 AU) emphasizes extended low brightness emission, and the “high” resolution (, about 6 AU) shows the smallest size scales where emission remains detectable with the available sensitivity. Figure 5b shows the result of imaging the model brightness distribution at these two angular resolutions using the same visibility sampling as the observations. For a more quantitative comparison, Figure 5c shows the residual images obtained by subtracting the model visibilities from the 7 mm data, and then imaging the difference with the standard algorithms.
The low resolution model image, with the centrally peaked dust emission ( 60K), compares very favorably with the 7 mm images of Figure 5a; unfortunately, the higher resolution is still not adequate to resolve directly the presence of the inner hole. But in both cases, the residual images show only noise. The agreement between the model and observations confirms the insightful parametric modeling of Wilner et al. (2000), who fitted the observations with radial power laws for the temperature and surface density. This was to be expected, since Wilner et al. adopted powers that were consistent with the predictions of irradiated accretion disk models at large radii. However, since our models are constructed from first principles, by solving the disk structure equations in the presence of stellar irradiation subject to the constraint of steady accretion, we are able to predict and confirm not only the radial dependences of the physical quantities (which are not exactly power laws), but also their absolute values. The free parameters of our model are essentially the disk mass (or equivalently, the parameter , see §3) and the dust mixture. The models were constructed primarily to fit the SED, but they can also fit the radial brightness distribution, as the good agreement between the observations and the model indicate. On the other hand, although there is no guarantee that the outer disk is completely steady, or has a constant , or ours is the correct prescription for the dust mixture, these assumptions seem to provide a good description of the physical situation in the disk of TW Hya.
5 Discussion
The lack of infrared flux excess at wavelengths below 10 microns could be easily understood if the inner disk was evacuated inside a few AU. However, the fact that material is still being transfered onto the star, as evidenced by the broad emission line profiles and the ultraviolet excess emission (Muzerolle et al. 2000), indicates that gas still exists in the inner disk. However, this material must be optically thin to explain the flux deficit in the near infrared. If the outer disk extended inwards to the magnetospheric radius, then the surface density at 2 AU would be , implying a surface density in solids of (for a dust to gas mass ratio of 0.01). To obtain an optical depth at the near-infrared of with this amount of dust, the opacity should be of order . If we assume that the grains are large enough that the opacity per gram of grain is , with the extinction cross section and the grain density, both or order 1, then . Using this estimate, we find that the original solids should have grown to sizes cm to account for the low optical depth in the near infrared. While this estimate is very rough, it suggests that very significant grain growth has probably already taken place in the inner disk of TW Hya, especially if the solid to gas ratio has increased significantly from solid matter left behind as gas flows onto the star. This inside-out coagulation and settling is consistent with the evolution of solid particles predicted in solar nebula theories. Dust grains are expected to coagulate by sticking collisions at a rate and reach a maximum size at the midplane in a few , where is the Keplerian angular velocity and P the orbital period (Safronov 1972; Goldreich & Ward 1973; Weidenschilling 1997; Nakagawa 1981). Since yrs, coagulation and settling are expected to occur first in the inner disk.
In the outer disk, a dust mixture where grains have reached 1 cm and dust and gas are well mixed can explain the observations, within the framework of our assumptions. This interpretation is consistent with the Weidenschilling’s (2000) argument that grain growth to at least 1 cm is necessary before particles start settling to the midplane, because smaller grains get stirred around by turbulence, and we suggest that turbulence plays an important role in the evolution of dust in protoplanetary disks. Grains in the upper layers can absorb stellar radiation and efficiently heat the disk and make it flare, resulting in the large far infrared and millimeter fluxes observed. Nonetheless, grains in the outer disk have grown significantly from mm, the size that characterizes the median SED of Taurus (Paper III). To get high mm fluxes for such large grains, the disk mass has to be high, , since the opacity at 7 mm decreases as grains grow (cf. Paper III, §2). This high value for the mass is surprising; it is similar or higher than values typically found for disks around 1 Myr old T Tauri stars (Beckwith et al. 1990), and comparable to that of objects emerging from the embedded phase (D’Alessio, Calvet, & Hartmann 1997). On the other hand, as we discussed in Paper III, disk masses may have been underestimated if the standard power law opacity is applied indiscriminately to disks where significant grain growth may have taken place.
It may be possible that the 3.6 cm data point contains a significant contribution from hot (ionized) stellar plasma. This contribution is unlikely to come from a wind. If the flux emitted by the wind is proportional to the mass loss rate, then scaling down from the wind/jet contribution in the case of HL Tau, which has to the case of TW Hya, and assuming a ratio of mass loss rate to mass accretion rate of (Calvet 1998), we find that this contribution at 3.6 cm should be mJy, too low to be important. A non-thermal contribution due to stellar surface activity is still possible, given the high X-ray flux of TW Hya (Kastner et al. 1997). Second epoch observations should resolve this question, because any non-thermal contribution should be highly time-dependent. In any event, the high flux at 7 mm, at which a non-thermal plasma contribution is much less likely, indicates that the grain mixture must contain grains that have grown at least to 1 cm, otherwise the opacity would already turn to the optical limit and drop, as is apparent in Figure 2 (cf. Paper III, Figure 2).
The peculiarities of the disk of TW Hya suggest an advanced state of evolution of the dust. In addition, the presence of a steep transition between the inner and outer disk suggest the action of an agent other than dust settling to the midplane, which in first approximation would be expected to produce effects that vary monotonically with radius. We speculate that we may be seeing the outer edge of a gap opened by the tidal action of a growing protoplanet. Numerical models of gap formation in disks result in a sharp drop of the surface density at the gap and enhancements near the edges, as disk material is pulled away from the protoplanet and into the outer disk (Bryden et al. 2000; Nelson et al. 2000). The edge of the gap would be facing the star, and if it was optically thick, would result in excess emission similar to that modeled schematically by our truncation region. The situation could be comparable to the one considered by Syer & Clarke (1995), who studied the evolution of the disk spectrum under the presence of a planet formed in the disk, in the case in which the mass of the protoplanet was larger than the mass of the disk at the planet location. In this case, the disk cannot push the planet inwards at the local viscous time-scale and material forms a reservoir upstream of the gap (Lin & Papaloizou 1986). The surface density enhancement at the edge could make it optically thick, so the midplane temperature would not increase as much as the surface temperature; the scale height, in this case, would not increase significantly, justifying our assumption of similar heights for the edge region and outer disk and the neglect of the effects of shadowing. The details of the structure of this region, in any event, are of necessity very schematic. The extrapolated mass of the disk inside 4 AU is 1 Jupiter mass, so this mechanism would work if a giant planet were forming in this region of the disk.
Finally, we address the question of what TW Hya tells us about protoplanetary disk evolution. Although we do not have direct measurements of the gas mass of the outer disk, it would be very surprising if the gas were strongly depleted there, as suggested by Zuckerman et al. (1995). Both the SED and the scattered light emission as a function of radius follow the predictions of models in which the dust is well-suspended in the gas, producing finite scale heights of the dust disk. Based on this inference, we suggest that the existence of the (fairly massive) TW Hya disk is evidence that neither UV radiation nor stellar winds can efficiently remove gas at radii AU over timescales of 10 Myr for stars formed in dispersed, isolated environments.
The survival of disk material at 10 Myr also places constraints on viscous timescales. The surface density of an accretion disk evolves with time, as viscous dissipation makes the disk transfer mass onto the star and expand to conserve angular momentum in a viscous time-scale given by , where is a characteristic radius and the viscosity (cf. Pringle 1981). Here we use the similarity solutions for disk evolution of Hartmann et al. (1998), which assume temperature and surface density distributions comparable to our outer disk models. The viscous time-scale in these solutions is yrs, where is the radius that contains 60 % of the initial mass (at ), and the viscosity is expressed in terms of the standard Shakura-Sunyaev (1973) parameterization.
Adopting and AU, then yrs. In the similarity model, the mass of the disk falls in time as , where . Thus, if the total disk mass at 10 Myr is , then the initial disk mass must have been , comparable to that of objects still surrounded by infalling envelopes, like HL Tau (D’Alessio, Calvet, & Hartmann 1997). The surface density drops below a power-law by a factor of at a distance AU, close to the AU transition in midplane density found in Krist et al. (2000). With these values of disk mass and radius, the value of the Toomre parameter remains close to unity and so gravitational instabilities (which could transfer angular momentum rapidly and thus invalidate the purely viscous evolution model) need not arise.
The mass accretion rate for this constant- model 111Note that a factor () is missing in expression (39) of Hartmann et al. (1998). at an age of 1 Myr is , near the lowest values observed in accreting T Tauri stars of this age (Gullbring et al. 1998; Hartmann et al. 1998). The mass accretion rate at 10 Myr is then , which is slightly higher than estimated by Muzerolle et al. (2000). It would not be surprising if accretion is being halted in the inner disk, and that inner and outer disk are becoming decoupled. If material is prevented from reaching the inner disk, the material inside the gap would drain onto the central star on a viscous time at 4AU, which with , would be yrs. Such a short timescale suggests that the probability of observing a system in this stage is very low, but still possible.
Instead of the adopted above, Hartmann et al. (1998) estimated a typical value of for T Tauri disks based on mm-wave disk mass estimates and assuming that these disks expand to AU in Myr. If the TW Hya disk (the region containing most of the mass) is not much larger than 200 AU in radius, then cannot be this large. A smaller viscosity could be consistent with the typical T Tauri data if disk masses are a few times larger than typically estimated, as suggested by D’Alessio et al. (2000).
One remaining question is why TW Hya’s disk evolution has been so much slower than that of other members of the association with presumably similar ages. In part, this must be due to the presence of binary (or multiple) stellar companions in several other systems (e.g., HD 98800; Soderblom et al. 1998) which can disrupt disks. In addition, we conjecture that TW Hya may simply have had a larger initial disk radius (equivalent to a large in terms of the similarity solution above), and thus a lower average surface density, than other systems. A larger radius would lead to slower viscous evolution for a given . Also, in contrast to timescales for dust coagulation and sedimentation, which depend mostly on orbital period (see above), theoretical models of the runaway growth of giant planets indicate that the timescale for such growth is a very sensitive function of surface density (Pollack et at. 1996). The lower surface density of the disk around TW Hya would imply a slower growth of giant planets. This would imply, in turn, that the final clearing of disks is due to sweeping-up of material by large bodies.
6 Conclusions
The disk of TW Hya seems to be in advanced state of dust evolution. A planet or other large perturbing body may have already formed, opening a gap with outer edge around 4 AU, and although there is still material in the inner disk, it is rapidly dissipating. In the outer disk, grains may be reaching the size necessary to start settling towards the midplane. This interpretation can consistently explain the large degree of activity of TW Hya, the lack of disk emission at near-IR wavelengths and the large fluxes beyond 10 m, as well as the 7 mm images.
Evacuated regions in the disks are also known to result from the effects of companion stars (GG Tau), and in some cases disk accretion can still occur, especially if the binary has an eccentric orbit (DQ Tau). Indeed, HD98800, another member of the TW Hya association, shows evidence for an inner disk hole; because this system is quadruple, it is quite likely that the inner disk regions have been evacuated by the companion stars. Although we cannot rule out such a possibility in TW Hya, the fact that accretion still occurs onto the central star, which is not the case in HD 98800, suggests that the companion body responsible for the gap is much less massive than a typical companion star, and thus much less effective in clearing out the disk. Interferometric imaging should be attempted to constrain the mass of any companion object, expected to have a separation of order 2-3 AU (0.04 - 0.06 arcsec at 55 pc).
Acknowledgments. We gratefully acknowledge discussions with Edwin Bergin and Stephen Lepp. This work has been supported by NASA Origins of Solar Systems grants NAG5-9670 and NAG5-9475. P.D. has been supported by Conacyt grant J27748E and a fellowship from DGAPA-UNAM, México.
References
- (1)
- (2) Allard, F. & Hauschildt, P. H. 1995, ApJ, 445, 433
- (3)
- (4) Begemann, B., Dorschner, J., Henning, T., Mutschke, H., & Thamm, E. 1994, ApJ, 423, 71
- (5)
- (6) Beckwith, S.V.W., & Sargent, A.I. 1991 ApJ, 381, 250
- (7)
- (8) Beckwith, S. V. W. & Sargent, A. I. 1993, ApJ, 402, 280
- (9)
- (10) Beckwith, S.V.W., Sargent, A.I., Chini, R. S., & Guesten, R. 1990, AJ, 99, 1024 (BSCG)
- (11)
- (12) Bryden, G., Chen, X., Lin, D. N. C., Nelson, R. P., & Papaloizou, J. C. B. 1999, ApJ, 514, 344
- (13)
- (14) Bryden, G., Różyczka, M., Lin, D. N. C., & Bodenheimer, P. 2000, ApJ, 540, 1091
- (15)
- (16) Calvet, N. 1998, Accretion Processes in Astrophysical Systems: Some Like it Hot!, 495
- (17)
- (18) Chiang, E. I. & Goldreich, P. 1997, ApJ, 490, 368
- (19)
- (20) D’Alessio, P. 1996, Ph.D. Thesis, Universidad Nacional Autónoma de México, Méxic
- (21) D’Alessio, P., Calvet, N., & Hartmann, L. 1997, ApJ, 474, 397
- (22)
- (23) D’Alessio, P., Cantó, J., Calvet, N., & Lizano, S. 1998, ApJ, 500, 411 (Paper I)
- (24)
- (25) D’Alessio, P., Calvet, N., Hartmann, L., Lizano, S. and Cantó, J. 1999, ApJ, 527, 893 (Paper II)
- (26)
- (27) D’Alessio, P., Calvet, N., & Hartmann, L. 2000, ApJ (in press) (Paper III)
- (28)
- (29) de La Reza, R., Torres, C. A. O., Quast, G., Castilho, B. V., & Vieira, G. L. 1989, ApJ, 343, L61
- (30)
- (31) Dorschner, J., Begemann, B., Henning, T., Jaeger, C., & Mutschke, H. 1995, A&A, 300, 503
- (32)
- (33) Glassgold, A. E., Najita, J., & Igea, J. 1997, ApJ, 485, 920
- (34)
- (35) Goldreich, P. & Ward, W. R. 1973, ApJ, 183, 1051
- (36)
- (37) Gregorio-Hetem, J. Lepine, J. R. D., Quast, G. R., Torres, C. A. O., & de la Reza, R. 1992, AJ, 103, 549
- (38)
- (39) Gullbring, E., Hartmann, L., Briceño, C., & Calvet, N., 1998, ApJ, 492, 323
- (40)
- (41) Hartigan, P., Hartmann, L., Kenyon, S. J., Strom, S. E., & Skrutskie, M. F. 1990, ApJ, 354, L25
- (42)
- (43) Hartmann, L., Calvet, N., Gullbring, E., D’Alessio, P., 1998, ApJ, 495, 385
- (44)
- (45) Henning, Th., Il’In, V. B., Krivova, N. A., Michel, B., & Voshchinnikov, N. V. 1999, A&AS, 136, 4
- (46)
- (47) Jayawardhana, R., Hartmann, L., Fazio, G., Fisher, R. S., Telesco, C. M., & Piña, R. K. 1999, ApJ, 521, L129
- (48)
- (49) Jäger, C., Mutschke, H., Begemann, B., Dorschner, J., & Henning, T. 1994, A&A, 292, 641
- (50)
- (51) Kastner, J. H., Zuckerman, B., Weintraub, D. A. & Forveille, T. 1997, Science, 277, 67
- (52)
- (53) Kenyon, S.J., & Hartmann, L. 1987, ApJ, 323, 714
- (54)
- (55) Kenyon, S. J. & Hartmann, L. 1995, ApJS, 101, 117
- (56)
- (57) Krist, J. E., Stapelfeldt, K. R., Ménard, F. , Padgett, D. L., & Burrows, C. J. 2000, ApJ, 538, 793
- (58)
- (59) Laor, A. & Draine, B. T. 1993, ApJ, 402, 441
- (60)
- (61) Lin, D. N. C. & Papaloizou, J. 1986, ApJ, 309, 846
- (62)
- (63) Lin, D. N. C. & Papaloizou, J. C. B. 1993, in Protostars and Planets III, eds. E.H. Levy & J.L. Lunine (Tucson:Univ. Arizona Press), 749
- (64)
- (65) Marcy, G. W. & Butler, R. P. 1998, ARA&A, 36, 57
- (66)
- (67) McGregor P., Hart J., Downing M., Hoadley D., Bloxham G., 1994, Experimental Astronomy, vol 3, p139
- (68)
- (69) Meyer, M. R., Calvet, N., & Hillenbrand, L. A. 1997, AJ, 114, 288
- (70)
- (71) Mekkaden, M. V. 1998, A&A, 340, 135
- (72)
- (73) Muzerolle, J., Calvet, N., Briceño, C., Hartmann, L., & Hillenbrand, L. 2000, ApJ, 535, L47
- (74)
- (75) Nakagawa, Y., Nakazawa, K., & Hayashi, C. 1981, Icarus, 45, 517
- (76)
- (77) Natta, A., Meyer, M. R., & Beckwith, S. V. W. 2000, ApJ, 534, 838
- (78)
- (79) Nelson, R. P., Papaloizou, J. C. B., Masset, F. ;. ;., & Kley, W. 2000, MNRAS, 318, 18
- (80)
- (81) Pollack, J. B., Hollenbach, D., Beckwith, S., Simonelli, D. P., Roush, T. & Fong, W. 1994, ApJ, 421, 615 (P94)
- (82)
- (83) Pollack, J. B., Hubickyj, O., Bodenheimer, P., Lissauer, J. J., Podolak, M., & Greenzweig, Y. 1996, Icarus, 124, 62
- (84)
- (85) Pringle, J. E. 1981, ARA&A, 19, 137
- (86)
- (87) Rucinski, S. M. & Krautter, J. 1983, A&A, 121, 217
- (88)
- (89) Safronov, V.S. 1972, in Evolution of the Protoplanetary Cloud and Formation of the Earth and Planets (Moscow: Nauke Press)
- (90)
- (91) Shakura, N.I., & Sunyaev, R.A. 1973, A&A, 24, 337
- (92)
- (93) Sitko, M. L., Lynch, D. K., & Russell, R. W. 2000, AJ, 120, 2609
- (94)
- (95) Soderblom, D. R. et al. 1998, ApJ, 498, 385
- (96)
- (97) Stognienko, R., Henning, T., & Ossenkopf, V. 1995, A&A, 296, 797
- (98)
- (99) Syer, D. & Clarke, C. J. 1995, MNRAS, 277, 758
- (100)
- (101) Tiné, S., Lepp, S., Gredel, R., & Dalgarno, A. 1997, ApJ, 481, 282
- (102)
- (103) Trilling, D. E., Koerner, D. W., Barnes, J. W., Ftaclas, C., & Brown, R. H. 2001, ApJ, 552, L151
- (104)
- (105) Warren, S.G., 1984, Applied Optics, vol. 23, p. 1206
- (106)
- (107) Webb, R. A., Zuckerman, B., Platais, I., Patience, J., White, R. J., Schwartz, M. J. & McCarthy, C. 1999, ApJ, 512, L63
- (108)
- (109) Weidenschilling, S.J. 1997, Icarus, 127, 290
- (110)
- (111) Weidenschilling, S.J. 2000, Space Science Reviews, 92, 295
- (112)
- (113) Weintraub, D. A., Sandell, G., & Duncan, W. D. 1989, ApJ, 340, L69
- (114)
- (115) Weintraub, D. A., Kastner, J. H., & Bary, J. S. 2000, ApJ, 541, 767
- (116)
- (117) Wichmann, R., Bastian, U., Krautter, J., Jankovics, I. & Rucinski, S. M. 1998, MNRAS, 301, L39
- (118)
- (119) Willacy, K. & Langer, W. D. 2000, ApJ, 544, 903
- (120)
- (121) Wilner, D. J., Ho, P. T. P., Kastner, J. H., & Rodríguez, L. F. 2000, ApJ, 534, L101
- (122)
- (123) Wilner, D. J. 2001, to appear in ”Young Stars Near Earth: Progress and Prospects”, eds. R. Jayawardhana and T. Greene, ASP Conference Series.
- (124)
- (125) Wiscombe, W.J., 1979, Mie scattering calculations: advances in technique and fast, vector-speed computer codes, NCAR/TN-140 + STR, National Center for Atmospheric Research, Boulder, Colorado
- (126)
- (127) Wolk, S. J. & Walter, F. M. 1996, AJ, 111, 2066
- (128)
- (129) Zuckerman, B., Forveille, T., & Kastner, J. H. 1995, Nature, 373, 494
- (130)