Inner-shell 1s - 2p Soft X-ray Absorption Lines
Abstract
The HULLAC atomic code is used to compute wavelengths and oscillator strengths for the 1s - p inner-shell absorption lines in Li-like to F-like ions of neon, magnesium, aluminum, silicon, sulfur, argon, calcium, and iron. Many of these lines are expected to be observed in Chandra and XMM-Newton high-resolution X-ray spectra of active galaxies. The new atomic data are incorporated in the ION code for spectral modeling of photoionized plasmas. The calculated spectra are subsequently compared with the spectrum of NGC 3783 and show very good agreement. The usefulness of these lines as diagnostics for the ionization state, column densities, and velocities in line-of-sight photoionized gas is called attention to.
1 INTRODUCTION
The launch of the Chandra and XMM-Newton observatories along with the grating spectrometers on board has generated great interest in high resolution X-ray spectroscopy of a wide variety of astrophysical X-ray sources, in particular active galactic nuclei (AGN). The high resolution grating observations of a handful of AGN, e.g. NGC 5548 (Kaastra et al., 2000), NGC 3783 (Kaspi et al., 2000, 2001), MCG–6-30-15 (Branduardi-Raymont et al., 2001; Lee et al., 2001), and IRAS 13349+2438 (Sako et al., 2001), clearly show the presence of dozens of strong X-ray absorption lines originating from highly charged gas along the line of sight. While many of the absorption lines are due to transitions in H-like and He-like ions, some are clearly due to inner-shell transitions in lower ionization species. Perhaps the most prominent feature of this kind is the unresolved transition array (UTA) of inner-shell = 2 to 3 (mainly 2p - 3d) lines pertaining to various M-shell Fe ions identified in IRAS 13349+2438 (Sako et al., 2001). The atomic data needed to model this UTA feature have recently been published in Behar, Sako, & Kahn (2001). Another example is the inner-shell 1s - 2p feature of Li-like Si11+ in NGC 3783 reported by Kaspi et al. (2001). The analogous 1s - 2p lines for Li-like O5+ have been calculated by Pradhan (2000) using the R-matrix method and identified in MCG–6-30-15 by Lee et al. (2001). Sako et al. (2002) have found evidence for additional 1s - p lines arising from lower charge states of oxygen (O4+ and O3+) in MCG–6-30-15. Recently, Nahar, Pradhan, & Zhang (2001) published results for Li-like C3+, O5+, and Fe23+ obtained using the same method as Pradhan (2000).
Models like those presented in Kaspi et al. (2001) predict that inner-shell transitions from the ground level of many more L-shell ions (Li-like to F-like) are indeed expected for X-ray illuminated photoionized plasmas. However, the available atomic data are few. The present paper aims at providing comprehensive results for the resonant 1s - p transitions in Li-like through F-like ions of neon, magnesium, aluminum, silicon, sulfur, argon, calcium, and iron. For that purpose, we employ the HULLAC code, which uses the parametric potential approximation. This method is by far more efficient than the previously used methods. For the present case of inner-shell transitions in highly charged ions, it is also expected to be very accurate. In the following, §2 describes the method of calculation and the new atomic data and §3 shows theoretical models for AGN spectra and a comparison with the spectrum of NGC 3783 obtained with the HETGS spectrometer on board Chandra.
2 ATOMIC CALCULATIONS
In order to calculate the wavelengths and oscillator strengths of interest, we use the multi-configuration, relativistic HULLAC (Hebrew University Lawrence Livermore Atomic Code) computer package (Bar-Shalom, Klapisch, & Oreg, 2001). The level energies in HULLAC are calculated using the relativistic version of the Parametric Potential (PP) method by Klapisch et al. (1977). This relativistic approach is perfectly adequate for the high-energy inner-shell excitations calculated in the present work. The high efficiency of HULLAC allows us to calculate the numerous transitions involved relatively quickly. Unlike some other atomic methods, the PP approach is hardly hampered by the considerable complexity of the electronic structure in the ions considered. Calculations are carried out for 1s - p () transitions in the L-shell ions (Li-like to F-like) of Ne, Mg, Al, Si, S, Ar, Ca, and Fe. The atomic structure calculations include the ground configurations 1s22 ( = 1 to 7). For each ion, all of the 1s - p photoexcitation transitions from the ground level are calculated, among which the 1s - 2p are the strongest by far. Electric and magnetic dipole and quadrupole transitions are computed. The contributions, however, of excitations other than electric-dipole are negligible.
The calculated 1s - p wavelengths () and oscillator strengths () for the strongest absorption lines in the He I to F I isoelectronic sequences are listed in Table 1. Only lines with , or the strongest line for a given ion, are included in the table. These lines represent the major part (70%, and in most cases 90%) of the absorption effect for the respective transitions. Thus, they should be sufficient for the analysis of most astrophysical spectra. We note, however, that the ION code, for which results are shown below does include more lines than those presented in Table 1. The strong lines are predominantly 1s - 2p lines, but also 1s - 3p lines in the He I and Be I sequences (see table). More specifically, the strongest lines usually arise for 1s - 2p3/2 transitions. The Einstein coefficient () as well as the total rate for depletion of the inner-shell excited level , which includes both radiative decay () and autoionization () rates, are also given in Table 1. The total depletion rate is needed to compute the fluorescence yield and natural width associated with each absorption line.
As can be seen in Table 1, and as expected, the oscillator strength depends only very weakly on the element and is much more contingent upon the isoelectronic sequence. Table 1 shows that for each element, the oscillator strength generally increases with the ionic charge, as more vacancies become available in the 2p subshell. This trend appears to be violated by the lines of the Be-like ions, which feature a 1s - 2p line that is stronger than the lines of the Li-like ions. However, the total oscillator strength, summed over all of the 1s - 2p excitations for Li-like and Be-like species is in fact comparable, as expected for these systems, both of which have the maximum possible six vacancies in the 2p subshell. The apparent dominance of the Be I sequence is only due to the fact that for the Be-like ions, the entire oscillator strength is concentrated in one 1s - 2p3/2 line. The same stands for the 1s - 3p3/2 transition (as well as for higher ), which explains why those transitions in Be-like ions are strong enough () to make it into the table. Conversely, for the Li-like ions the total 1s - 2p3/2 line strength is distributed among several lines.
The accuracy of all of the data presented here is expected to be very high, but owing to the relativistic method in HULLAC, the data become increasingly accurate for higher charge states. In order to give a rough idea of the uncertainties that could be expected from these atomic values, we include in Table 1, in addition to the new inner-shell excited lines, the leading lines for the He-like ions, for which all of the data are available in the literature. The HULLAC wavelengths and oscillator strengths for the 1s - p ( = 2, 3) excitations in He-like ions are compared in the table with the published values, which were calculated with perhaps more rigorous methods. For this comparison we use primarily the compilation by Verner, Verner, & Ferland (1996) as well as values from the NIST database, in cases where these are available (see Table 1). It is seen in Table 1 that the present wavelengths agree with the published values to within a few mÅ and that the oscillator strengths agree to within 10% (except for Fe in Verner, Verner, & Ferland (1996)). Similar comparisons for the inner-shell excitations in Table 1 would, of course, be even more desirable. Unfortunately, calculations for these transitions have been previously published only for Li-like Fe23+. Nahar, Pradhan, & Zhang (2001) obtain for the two strongest lines of Fe23+ 1.860 Å and 1.864 Å, to be compared with the present values of 1.861 Å and 1.864 Å. The corresponding oscillator strengths in Nahar, Pradhan, & Zhang (2001) are 0.491 and 0.146, to be compared with the present values of 0.469 and 0.147. In order to check whether this excellent agreement is sustained for less ionized species, we have specifically calculated the 1s - 2p lines for the Li-like ion O5+, which is beyond the scope of this work and therefore not included in Table 1. Our calculations show that the two strongest 1s - 2p lines of O5+ overlap at 22.01 Å and have oscillator strengths of 0.351 and 0.174. These values compare favorably with Nahar, Pradhan, & Zhang (2001), who find the lines (overlapping) at 22.05 Å, and the oscillator strengths to be 0.384 and 0.192. The agreement between the autoionization rates obtained with the two methods is of the same order as that for the oscillator strengths. In other words, even for the O5+ case, which could be considered an extreme upper limit to the uncertainty expected from the present values for the higher-Z elements, the discrepancies with the results obtained with the more rigorous R-matrix code are not more than 0.2% for the wavelengths and 10% for the oscillator strengths and autoionization rates. The accuracy of most of the present data is, however, expected to be much higher as indicated by the comparisons for the He-like ions and for Fe23+. Having gone through this extensive comparison, it is important to stress that for an ultimate assessment of the accuracy of the atomic data, a comparison between calculations may not be sufficient. Actual measurements need to be carried out.
With the exception of maybe Fe, the lines from each ion are adequately separated in wavelength space and are readily resolvable with the gratings on board Chandra and XMM-Newton. The uncertainties associated with the wavelengths calculated with HULLAC are considerably smaller than the typical differences in wavelength. This enables an unambiguous identification of lines and, consequently, a precise measurement of the ionization state of the absorbing plasma. We note that although the inner-shell Fe lines are within the wavelength band of the HETGS spectrometer on board Chandra they are difficult to resolve with HETGS. These lines will be much better detected and resolved with the microcalorimeter spectrometer (Richard et al., 1999), which is planned to fly on board ASTRO-E2.
For most of the inner-shell excited levels considered in this work, the total autoionization rate is much higher than the radiative decay rate, especially for the low- elements. The fact that the inner-shell photoexcitation processes are by and large followed by autoionization rather than X-ray re-emission is manifested in the generally low fluorescence yield, which gradually increases with the ion charge. For example, for Si and Fe, respectively, the -weighted averages of the fluorescence yield rise gradually from 0.04 and 0.25 for the F-like ion to 0.27 and 0.93 for the Li-like ion. The low fluorescence yield can be associated with several important effects. First, autoionization following photoexcitation can alter the ionization balance towards higher charge states. This effect is included in ION and can be important (see §3). Another direct result of the low fluorescence yield is that dielectronic recombination via these channels is inefficient and does not compensate for the photoexcitation-autoionization effect on the ionization balance. It further implies that these transitions are much harder to detect in emission than they are in absorption. Another consequence of the high autoionization rates is the broadening of the natural widths of the inner-shell absorption lines. At high column densities, the natural width of the line becomes important for determining the total flux absorbed.
3 SPECTRAL MODELING
We have carried out detailed spectral modeling in order to illustrate the expected intensity of the inner-shell transitions and their use as diagnostics for photoionized plasma. The calculations are performed with ION2001, the 2001 version of the photoionization code ION lately described in Netzer (2001), Kaspi et al. (2001), and Netzer (1996). The ION code computes a self-consistent model of the ionization and thermal structure of a steady-state ionized gas exposed to an external radiation source. Atomic data include the most recent cross sections for the more abundant elements and all of their strong lines. Also included are -values calculated with HULLAC for a large number of iron L-shell lines (see Kaspi et al. (2001)) and dozens of M-shell iron transitions (Behar, Sako, & Kahn, 2001). The new inner-shell transitions calculated in the present work are fully incorporated into the model, including their effect on the individual level population and on the level of ionization of the various elements due to photoexcitation-autoionization.
We have calculated a series of AGN-type models with a column density of 1022 , gas density of 108 , and a range of ionization parameters similar to the one observed in many Seyfert galaxies. The local ionizing field is defined by the spectral energy distribution (SED) of the ionizing sources, taken here to be a single power-law of photon slope between 0.1 to 50 keV, and by the oxygen ionization parameter, , defined over the 0.538 – 10 keV range (Netzer, 2001). Guided by recent high-resolution Chandra observations, we have assumed a turbulent velocity of 300 km/s for the absorbing gas. Solar elemental composition is assumed in all cases.
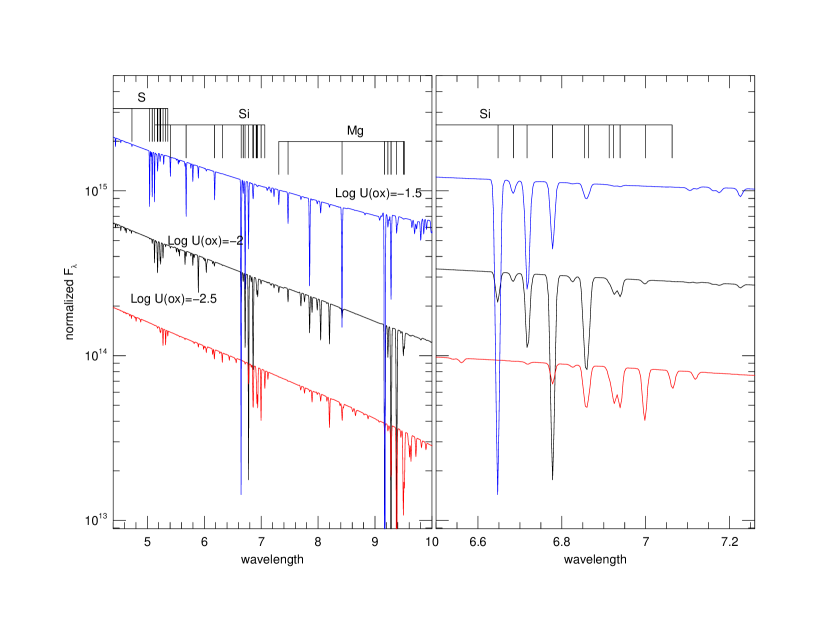
Fig. 1 shows the 4.7 – 10 Å wavelength range for three pure-absorption theoretical spectra calculated for : 10-1.5, 10-2, and 10-2.5. The largest optical-depth transitions for each of the H-like to F-like ions are marked above the plots. As evident from this example, a relatively small change in incidence flux makes a large change in the level of ionization and, consequently, in the spectral line structure. The 1s - 2p inner-shell lines of at least 2 - 4 L-shell ions arise for a single ionization parameter, and therefore are likely to be detected in many AGN absorption spectra. This, in combination with the observed H-like and He-like lines, provides a powerful diagnostic tool for determining very precisely the level of ionization and the elemental abundances in the absorbing gas. The strongest lines in all cases have typical equivalent widths of several mÅ and are, thus, easily detected in typical AGN spectra. The ample separation between lines from different charge states and the very few blends allow the identification and reliable curve-of-growth analysis for all of these lines. Thus, in addition to the ionization state, the present atomic data enable accurate column density and velocity broadening measurements with these intrinsically narrow features. In fact, the major remaining limitation on velocity measurements is the resolution of contemporary airborne, X-ray spectrometers (typically, a few 100 km/s).
The effect of the autoionization transitions following photoexcitation on the level of ionization has been tested for the =10-2 case by running ION models with and without the inner-shell lines. We find a noticeable change in the level of ionization near the illuminated face of the cloud, where most of the absorption is expected. For example, including the inner-shell transitions changes the fractional abundance of Si10+ from 0.21 to 0.17, that of Si11+ from 0.27 to 0.25, and that of Si12+ from 0.35 to 0.43, i.e., silicon becomes appreciably more ionized when photoexcitation-autoionizaion is included in the model. However, the effect on the mean level of ionization deeper in the cloud would be smaller, since the strong 1s - 2p lines saturate, which results in photoexcitation being less efficient.
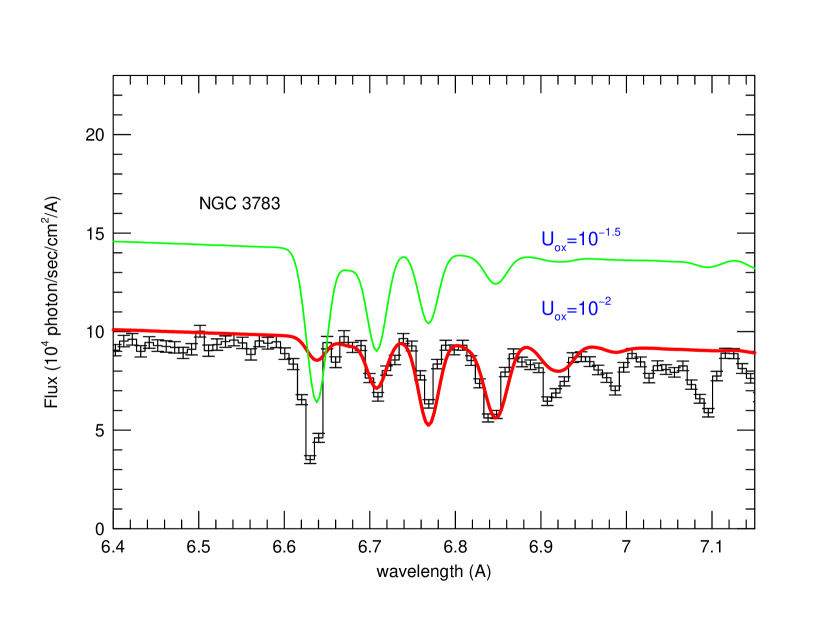
The present calculations can be compared with recently obtained spectra of active galaxies. In particular, the Kaspi et al. (2001) observation of NGC 3783 is a good example of a photoionized line-of-sight gas with a line-rich absorption spectrum and with properties that are similar to the ones investigated here. In Kaspi et al. (2001), we tentatively identified features near 6.8 Å to be due to inner-shell absorption in Si. However, the atomic data available at that time did not allow for a conclusive identification. Using the newly calculated atomic data, together with our spectral code, we now revisit the Kaspi et al. (2001) observation. In particular, the present model is compared with the data in the wavelength region suspected for showing inner-shell Si lines. The results are shown in Fig. 2 for two representing ionization parameters. Each absorption trough in the spectrum is attributed for the most part to a single charge state. Absorption lines of He-like Si12+ to N-like Si7+ are clearly identified in the spectrum of NGC 3783. It can be seen that the =10-2 model reproduces the Si8+ - Si11+ lines fairly well; both the wavelengths and the equivalent widths. Fig. 2 also confirms the Kaspi et al. (2001) finding that the data require a range of ionization parameters. In particular, a component with is required to explain the Si12+ line at 6.65 Å, and one with might be needed to account for the Si7+ feature at 7.00 Å. We are currently working on a more detailed fit, including lines from all of the other cosmically abundant elements to fit the new 900 ks Chandra HETGS data set obtained recently (Kaspi et al., 2002; George et al., 2002).
4 CONCLUSIONS
A complete set of wavelengths and oscillator strengths for inner-shell absorption lines are calculated for the entire L-shell of Ne, Mg, Al, Si, S, Ar, Ca, and Fe. This is a continuation of our ongoing study of inner-shell absorption features in AGN spectra. The usefulness of these atomic data for plasma diagnostics is demonstrated by comparison of spectral models with the HETGS line-rich spectrum of NGC 3783. Good agreement is found between the model and the data, although for a full account of the X-ray absorber in NGC 3783, the HETGS data clearly require a multi ionization-parameter model, which will be published separately.
References
- Bar-Shalom, Klapisch, & Oreg (2001) Bar-Shalom, A., Klapisch, M., & Oreg, J. 2001, J. Quant. Spectr. Radiat. Transfer, 71, 169
- Behar, Sako, & Kahn (2001) Behar, E., Sako, M., & Kahn, S. M. 2001 ApJ, 563, 497
- Branduardi-Raymont et al. (2001) Branduardi-Raymont, G., Sako, M., Kahn, S.M., Brinkman, A.C., Kaastra, J.S., & Page, M.J. 2001, A&A, 365, 162
- George et al. (2002) George, I.M., et al. 2002, ApJ (submitted)
- Kaastra et al. (2000) Kaastra, J.S., Mewe, R., Liedahl, D.A., Komossa, S., & Brinkman, A.C. 2000, A&A, 354, 83
- Kaspi et al. (2000) Kaspi, S., Brandt, W.N., Netzer, H., Sambruna, R., Chartas, G., Garmire, G.P., & Nousek, J. 2000, ApJ, 535, L17
- Kaspi et al. (2001) Kaspi, S., et al. 2001, ApJ, 554, 216
- Kaspi et al. (2002) Kaspi, S., et al. 2002, ApJ (submitted)
- Richard et al. (1999) Richard, K.L., et al. 1999 SPIE, 3765, 114
- Klapisch et al. (1977) Klapisch, M., Schwob, J.L., Fraenkel, B., & Oreg, J. 1977, J. Opt. Soc. Am. 67, 148
- Lee et al. (2001) Lee, J.L., Ogle, P.M, Canizares, C.R., Marshall, H.L., Schulz, N.S., Morales, R., Fabian, A.C., & Iwasawa, K. 2001, ApJ, 554, L13
- Nahar, Pradhan, & Zhang (2001) Nahar, S.N., Pradhan, A.K., & Zhang, H.L. 2001 Phys. Rev. A, 63, 060701(R)
- Netzer (1996) Netzer, H. 1996, ApJ, 473, 781
- Netzer (2001) Netzer, H. 2001, in The Starburst-AGN Connection, (Eds. I. Aretxaga, D. Kunth & R. Mujica), World Scientific, p117
- Pradhan (2000) Pradhan, A.K. 2000 ApJ, 545, L165
- Sako et al. (2001) Sako, M. et al. 2001, A&A, 365, L168
- Sako et al. (2002) Sako, M. et al. 2002, submitted to ApJ (astro-ph/0112436)
- Verner, Verner, & Ferland (1996) Verner, D.A., Verner, E.M., & Ferland, G.J. 1996, Atomic Data and Nuclear Data Tables, 64, 1
| Element | Isoelectronic | (Å) | |||||
|---|---|---|---|---|---|---|---|
| Sequence | present | previousaa Primarily Verner, Verner, & Ferland (1996) | present | previousaa Primarily Verner, Verner, & Ferland (1996) | (1013 s-1) | (1013 s-1) | |
| Ne | He I | 13.448 | 13.447 | 0.657 | 0.724 | 0.81 | 0.81 |
| 11.553 bb 1s - 3p transitions | 11.547 | 0.159 | 0.149 | 0.27 | 0.28 | ||
| Li I | 13.646 | 0.381 | 0.68 | 1.30 | |||
| 13.648 | 0.187 | 0.67 | 1.43 | ||||
| Be I | 13.814 | 0.595 | 0.69 | 8.25 | |||
| 12.175 bb 1s - 3p transitions | 0.126 | 0.19 | 0.21 | ||||
| B I | 14.020 | 0.190 | 0.64 | 3.55 | |||
| 14.047 | 0.166 | 0.28 | 18.4 | ||||
| C I | 14.239 | 0.147 | 0.16 | 24.9 | |||
| 14.202 | 0.124 | 0.14 | 5.76 | ||||
| N I | 14.371 | 0.119 | 0.26 | 27.3 | |||
| O I | 14.526 | 0.106 | 0.34 | 25.5 | |||
| F I | 14.631 | 0.062 | 0.39 | 0.58 | |||
| Mg | He I | 9.170 | 9.169 | 0.691 | 0.742, 0.745 cc NIST database (http://physics.nist.gov/cgi-bin/AtData/main_asd); quoted only where available and different from Verner, Verner, & Ferland (1996) | 1.81 | 1.81 |
| 7.854 bb 1s - 3p transitions | 7.851 | 0.159 | 0.151, 0.152 cc NIST database (http://physics.nist.gov/cgi-bin/AtData/main_asd); quoted only where available and different from Verner, Verner, & Ferland (1996) | 0.57 | 0.61 | ||
| Li I | 9.281 | 0.402 | 1.56 | 2.12 | |||
| 9.283 | 0.194 | 1.50 | 2.36 | ||||
| Be I | 9.378 | 0.631 | 1.60 | 9.67 | |||
| 8.201 bb 1s - 3p transitions | 0.132 | 0.44 | 0.46 | ||||
| B I | 9.498 | 0.207 | 1.53 | 5.08 | |||
| 9.514 | 0.188 | 0.69 | 20.8 | ||||
| C I | 9.631 | 0.166 | 0.40 | 29.1 | |||
| 9.607 | 0.143 | 0.34 | 7.95 | ||||
| N I | 9.718 | 0.132 | 0.62 | 32.5 | |||
| O I | 9.816 | 0.125 | 0.86 | 35.7 | |||
| F I | 9.895 | 0.076 | 1.04 | 41.1 | |||
| Al | He I | 7.757 | 7.757 | 0.693 | 0.750 | 2.56 | 2.56 |
| 6.637 bb 1s - 3p transitions | 6.635 | 0.159 | 0.152, 0.153 cc NIST database (http://physics.nist.gov/cgi-bin/AtData/main_asd); quoted only where available and different from Verner, Verner, & Ferland (1996) | 0.80 | 0.85 | ||
| Li I | 7.844 | 0.410 | 2.22 | 2.76 | |||
| 7.486 | 0.196 | 2.12 | 3.05 | ||||
| Be I | 7.921 | 0.645 | 2.28 | 10.6 | |||
| 6.907 bb 1s - 3p transitions | 0.134 | 6.25 | 0.64 | ||||
| B I | 8.016 | 0.214 | 2.22 | 6.19 | |||
| 8.029 | 0.198 | 1.03 | 21.9 | ||||
| C I | 8.121 | 0.176 | 0.59 | 30.8 | |||
| 8.101 | 0.152 | 0.52 | 9.58 | ||||
| N I | 8.193 | 0.137 | 0.91 | 34.8 | |||
| O I | 8.272 | 0.131 | 1.28 | 40.2 | |||
| F I | 8.337 | 0.082 | 1.57 | 47.7 | |||
| Si | He I | 6.648 | 6.648 | 0.701 | 0.757 | 3.53 | 3.53 |
| 5.682 bb 1s - 3p transitions | 5.681 | 0.159 | 0.152 | 1.09 | 1.16 | ||
| Li I | 6.717 | 0.418 | 3.09 | 19.9 | |||
| 6.719 | 0.197 | 2.90 | 5.51 | ||||
| Be I | 6.778 | 0.656 | 3.17 | 29.6 | |||
| 5.896 bb 1s - 3p transitions | 0.136 | 0.87 | 4.41 | ||||
| B I | 6.854 | 0.221 | 3.14 | 26.8 | |||
| 6.864 | 0.209 | 1.48 | 27.6 | ||||
| C I | 6.939 | 0.185 | 0.86 | 33.0 | |||
| 6.923 | 0.161 | 0.75 | 37.2 | ||||
| N I | 6.999 | 0.141 | 1.28 | 30.8 | |||
| O I | 7.063 | 0.137 | 1.83 | 43.9 | |||
| F I | 7.119 | 0.086 | 2.26 | 58.1 | |||
| S | He I | 5.039 | 5.039 | 0.711 | 0.767 | 6.23 | 6.23 |
| 4.300 bb 1s - 3p transitions | 4.299 | 0.158 | 0.153 | 1.90 | 2.01 | ||
| Li I | 5.084 | 0.432 | 5.57 | 22.7 | |||
| 5.086 | 0.196 | 5.05 | 7.68 | ||||
| Be I | 5.126 | 0.672 | 5.68 | 14.5 | |||
| 4.441 bb 1s - 3p transitions | 0.139 | 1.56 | 15.8 | ||||
| B I | 5.176 | 0.234 | 5.82 | 11.4 | |||
| 5.183 | 0.230 | 2.86 | 25.1 | ||||
| C I | 5.234 | 0.208 | 1.69 | 35.7 | |||
| 5.222 | 0.175 | 1.42 | 17.0 | ||||
| N I | 5.276 | 0.148 | 2.36 | 41.2 | |||
| O I | 5.320 | 0.145 | 3.42 | 52.8 | |||
| F I | 5.359 | 0.093 | 4.30 | 65.5 | |||
| Ar | He I | 3.949 | 3.949 | 0.717 | 0.775 | 10.2 | 10.2 |
| 3.366 bb 1s - 3p transitions | 3.365 | 0.156 | 0.155 | 3.06 | 3.25 | ||
| Li I | 3.981 | 0.444 | 9.34 | 9.69 | |||
| 3.983 | 0.192 | 8.06 | 9.66 | ||||
| Be I | 4.010 | 0.681 | 9.42 | 18.5 | |||
| 3.464 bb 1s - 3p transitions | 0.140 | 2.59 | 2.62 | ||||
| B I | 4.050 | 0.250 | 5.08 | 27.7 | |||
| 4.045 | 0.244 | 9.95 | 16.9 | ||||
| C I | 4.086 | 0.236 | 3.15 | 39.2 | |||
| 4.078 | 0.175 | 2.34 | 24.6 | ||||
| N I | 4.117 | 0.153 | 4.01 | 45.4 | |||
| 4.115 | 0.103 | 4.06 | 45.4 | ||||
| O I | 4.148 | 0.151 | 5.84 | 61.1 | |||
| F I | 4.176 | 0.098 | 7.46 | 77.4 | |||
| Ca | He I | 3.177 | 3.177 | 0.717 | 0.782 | 15.8 | 15.8 |
| 2.706 bb 1s - 3p transitions | 2.705 | 0.154 | 0.155 | 4.68 | 4.97 | ||
| Li I | 3.200 | 0.454 | 14.8 | 15.0 | |||
| 3.202 | 0.184 | 12.0 | 14.0 | ||||
| Be I | 3.221 | 0.685 | 14.7 | 24.1 | |||
| 2.776 bb 1s - 3p transitions | 0.140 | 4.03 | 4.08 | ||||
| B I | 3.250 | 0.267 | 8.43 | 31.1 | |||
| 3.247 | 0.252 | 16.0 | 24.7 | ||||
| C I | 3.276 | 0.273 | 5.65 | 43.0 | |||
| 3.270 | 0.158 | 3.29 | 34.6 | ||||
| N I | 3.301 | 0.156 | 6.38 | 50.1 | |||
| 3.299 | 0.106 | 6.51 | 50.1 | ||||
| O I | 3.323 | 0.154 | 9.28 | 70.0 | |||
| F I | 3.344 | 0.102 | 12.1 | 90.5 | |||
| Fe | He I | 1.850 | 1.851 | 0.689 | 0.798, 0.704 cc NIST database (http://physics.nist.gov/cgi-bin/AtData/main_asd); quoted only where available and different from Verner, Verner, & Ferland (1996) | 44.7 | 44.7 |
| 1.573 bb 1s - 3p transitions | 1.575, 1.573 cc NIST database (http://physics.nist.gov/cgi-bin/AtData/main_asd); quoted only where available and different from Verner, Verner, & Ferland (1996) | 0.144 | 0.156, 0.138 cc NIST database (http://physics.nist.gov/cgi-bin/AtData/main_asd); quoted only where available and different from Verner, Verner, & Ferland (1996) | 13.0 | 13.8 | ||
| Li I | 1.861 | 1.860 dd Nahar, Pradhan, & Zhang (2001) | 0.469 | 0.491 dd Nahar, Pradhan, & Zhang (2001) | 45.1 | 45.2 | |
| 1.864 | 1.864 dd Nahar, Pradhan, & Zhang (2001) | 0.147 | 0.146 dd Nahar, Pradhan, & Zhang (2001) | 28.3 | 32.4 | ||
| Be I | 1.870 | 0.666 | 42.3 | 52.6 | |||
| 1.605 bb 1s - 3p transitions | 0.134 | 11.6 | 11.8 | ||||
| B I | 1.883 | 0.300 | 28.2 | 52.6 | |||
| 1.883 | 0.259 | 48.7 | 65.2 | ||||
| C I | 1.895 | 0.397 | 24.6 | 64.4 | |||
| N I | 1.908 | 0.154 | 18.8 | 69.7 | |||
| 1.906 | 0.119 | 21.8 | 72.1 | ||||
| O I | 1.918 | 0.151 | 27.4 | 106.2 | |||
| F I | 1.927 | 0.109 | 21.2 | 144.0 | |||