fig
The bulk of the cosmic infrared background resolved by ISOCAM
Abstract
Deep extragalactic surveys with ISOCAM revealed the presence of a large density of faint mid-infrared (MIR) sources. We have computed the 15 m integrated galaxy light produced by these galaxies above a sensitivity limit of 50 Jy. It sets a lower limit to the 15 m extragalactic background light of (2.4 0.5) nW m-2 Hz-1.
The redshift distribution of the ISOCAM galaxies is inferred from the spectroscopically complete sample of galaxies in the Hubble Deep Field North (HDFN). It peaks around 0.8 in agreement with studies in other fields. The rest-frame 15 m and bolometric infrared (8-1000 m) luminosities of ISOCAM galaxies are computed using the correlations that we establish between the 6.75, 12, 15 m and infrared (IR) luminosities of local galaxies. The resulting IR luminosities were double-checked using radio (1.4 GHz) flux densities from the ultra-deep VLA and WSRT surveys of the HDFN on a sample of 24 galaxies as well as on a sample of 109 local galaxies in common between ISOCAM and the NRAO VLA Sky Survey (NVSS). This comparison shows for the first time that MIR and radio luminosities correlate up to 1. This result validates the bolometric IR luminosities derived from MIR luminosities unless both the radio-far infrared (FIR) and the MIR-FIR correlations become invalid around 1.
The fraction of IR light produced by active nuclei was computed from the cross-correlation with the deepest X-ray surveys from the Chandra and XMM-Newton observatories in the HDFN and Lockman Hole respectively. We find that at most 20 of the 15 m integrated galaxy light is due to active galactic nuclei (AGNs) unless a large population of AGNs was missed by Chandra and XMM-Newton.
About 75 of the ISOCAM galaxies are found to belong to the class of luminous infrared galaxies ( ). They exhibit star formation rates of the order of 100 . The comoving density of infrared light due to these luminous IR galaxies was more than 40 times larger at 1 than today.
The contribution of ISOCAM galaxies to the peak of the cosmic infrared background (CIRB) at 140 m was computed from the MIR-FIR correlations for star forming galaxies and from the spectral energy distribution of the Seyfert 2, NGC 1068, for AGNs. We find that the galaxies unveiled by ISOCAM surveys are responsible for the bulk of the CIRB, i.e (16 5) nW m-2 Hz-1 as compared to the (25 7) nW m-2 Hz-1 measured with the COBE satellite, with less than 10 due to AGNs. Since the CIRB contains most of the light radiated over the history of star formation in the universe, this means that a large fraction of present-day stars must have formed during a dusty starburst event similar to those revealed by ISOCAM.
Key Words.:
Galaxies: evolution – Infrared: galaxies – Galaxies: starburst – Galaxies: Seyfert1 Introduction
The extragalactic background light (EBL) is a measurement of the sum of the light produced by all extragalactic sources over cosmic time. When it is integrated over the full spectral range, the so-called cosmic background is a fossil record of the overall activity of all galaxies from their birth until now. It can be considered as the global energetic budget available for any model aiming at simulating the birth and fate of galaxies during the Hubble time. However the physical origin of this light will remain unknown until we have pinpointed the individual sources responsible for it. The goal of the present paper is to demonstrate that an important new result has come from the combination of a series of deep extragalactic surveys performed in the mid-infrared (MIR) at 15 m with the ISOCAM camera (Cesarsky et al. 1996a) onboard the Infrared Space Observatory (ISO, Kessler et al. 1996): we suggest here that the galaxies detected in these surveys, which median redshift of was measured from a sub-sample of ISOCAM galaxies, contribute dominantly to the cosmic infrared background (CIRB), i.e. the EBL integrated over all wavelengths within = 5 to 1000 m.
The CIRB was recently detected and measured thanks to the cosmic background explorer (COBE) instruments FIRAS (Far Infrared Absolute Spectrometer) and DIRBE (Diffuse Infrared Background Experiment) (Puget et al. 1996, Fixsen et al. 1998, Lagache et al. 1999, 2000, Hauser et al. 1998, Dwek et al. 1998, Finkbeiner et al. 2000) from 100 m to 1 mm. It peaks around 140 m and was found to represent at least half and maybe two thirds of the overall cosmic background (see Gispert, Lagache & Puget 2000). Hence the CIRB reflects the bulk of the star formation that took place over the history of the universe. By resolving it into individual galaxies, we would therefore pinpoint the times and places where most stars seen in the local universe were formed. Two physical processes were considered for its origin: nucleosynthesis, i.e. stellar radiation in star forming galaxies, and accretion around a black hole, i.e. active galactic nuclei. In both cases, the light is not directly coming from its physical source but is reprocessed by dust, i.e. absorbed and re-radiated thermally by the “warm” dust. Both processes are probably related (see Genzel et al. 1998), but energetic considerations, based on the presence of massive black holes and on the amount of heavy elements in local galaxies, suggest that star formation should by far dominate in the CIRB over AGN activity (Madau & Pozzetti 2000, Franceschini et al. 2001). However, until the individual galaxies responsible for the CIRB are found and studied in detail, this result will remain theoretical.
The spectral energy distribution (SED) in the IR of local galaxies peaks above 60 m and typically around 80 20 m (see Sanders & Mirabel 1996). As a result, the distant galaxies responsible for the peak of the CIRB detected by COBE around 140 m should be located below 1.3 and present a redshift distribution peaked around 0.8, if their SEDs do not strongly differ from those of local galaxies. As we will see this is also the redshift range of the galaxies detected at 15 m with ISOCAM.
The ISOCAM extragalactic surveys were performed with two filters, LW2 (5-8.5 m) and LW3 (12-18 m), centered at 6.75 and 15 m respectively. The 6.75 m sample of sources is strongly contaminated by galactic stars, whereas stars are rather easily distinguished from galaxies at 15 m using optical-MIR colour-colour plots. As a consequence, we are only concerned here by the 15 m galaxies. Moreover, the observed 6.75 m light is no more produced by dust emission for galaxies more distant than 0.4 because of k-correction (redshifted stellar light dominates the 6.75 m band above this redshift), whereas the observed 15 m light is mostly due to dust emission for galaxies up to 2.
About 1000 galaxies detected in the 15 m surveys were used to produce number counts (i.e. surface density of galaxies as a function of flux density; see Elbaz et al. 1999). The steep slope of the 15 m counts below mJy indicates the presence of an excess of faint sources by one order of magnitude in comparison with predictions assuming no evolution of the 15 m luminosity function with redshift. The presence of broad emission features in the MIR spectrum of galaxies alone cannot explain the shape of the number counts and a strong evolution of either the whole luminosity function (Xu 2000, Chary & Elbaz 2001) or preferentially of a sub-population of starburst galaxies evolving both in luminosity and density (Franceschini et al. 2001, Chary & Elbaz 2001, Xu et al. 2001) is required in order to fit the ISOCAM 15 m counts. In the present paper, we suggest that these ISOCAM galaxies are in fact dusty starbursts responsible for the bulk of the CIRB.
In Sect. 2, we compare the sensitivity of different extragalactic surveys in several wavelength ranges to detect the galaxies responsible for the CIRB. It is suggested that MIR is presently the most efficient technique to detect dusty starbursts up to 1.3.
In Sect. 3, we calculate the 15 m integrated galaxy light (IGL) due to ISOCAM galaxies. The 15 m IGL is the sum of the 15 m fluxes from individual galaxies, down to a given sensitivity limit, per unit area. It represents a lower limit to the 15 m EBL, which remains unknown. Once the redshift distribution and SED of these galaxies is determined, it becomes possible to estimate their contribution to the CIRB.
In Sect. 4, we demonstrate that MIR luminosities at 6.75, 12 and 15 m are strongly correlated with the bolometric IR luminosity (from 8 to 1000 m) for local galaxies. The correlations presented in Chary & Elbaz (2001) are confirmed here with a larger sample of galaxies.
Before spectroscopic redshifts are obtained for the full sample of ISOCAM galaxies used to produce these number counts, the redshift distribution of these galaxies can be inferred from a few sub-samples: HDFN (Aussel et al. 1999, 2001), CFRS-14 (Flores et al. 1999, 2002), CFRS-03 (Flores et al. 2002). The ultra-deep ISOCAM survey of the HDFN samples a flux density range where most of the evolution observed in the number counts takes place and where the bulk of the 15 m IGL is produced. This field is complete in spectroscopic redshifts, so it is used to estimate the bolometric IR luminosities and star formation rates of the ISOCAM galaxies in Sect. 5.
This result relies on two assumptions:
- that the main source for the MIR light in ISOCAM galaxies is
star formation and not accretion around a black hole.
- that the correlations found in the local universe between the
MIR and bolometric IR luminosity of galaxies remain valid up to
1.
The first assumption is discussed and justified in Sect. 5.2, where soft and hard X-ray data from the Chandra and XMM-Newton X-ray observatories are combined with ISOCAM data on galaxies in the HDFN and Lockman Hole regions respectively.
The issue of the robustness of the MIR-FIR correlations in the distant universe is addressed in Sect. 5.5, where IR luminosities are also computed from radio (1.4 GHz) flux densities for a sub-sample of 24 distant and 109 local ISOCAM galaxies.
In Sect. 5.6, we compute the cosmic density of IR light due to luminous IR galaxies () at 1. In Sect. 6, we evaluate the contribution of the ISOCAM galaxies to the CIRB, more precisely to its peak emission around 140 m. Finally, the nature of ISOCAM galaxies is discussed in the conclusions (Sect. 7).
In the following, we will use the terms ULIG for galaxies with an IR luminosity , LIG, when and luminous IR galaxies for both (). Throughout this paper, we will assume Ho= 75 km s-1 Mpc-1, = 0.3 and .
2 How to resolve the CIRB into individual galaxies ?

2.1 Contribution of IRAS galaxies
One of the major results from the IRAS satellite was to demonstrate that the bolometric luminosity of galaxies more luminous than was underestimated by more than one order of magnitude before the IR luminosity was accounted for (Soifer et al. 1987). These luminous IR galaxies are not typical of the local galaxy population, since local galaxies radiate only about 30 of their bolometric luminosity in the dust regime from 8 to 1000 m and only 2 of the local bolometric luminosity density is due to luminous IR galaxies. If we convert the IR luminosity into a star formation rate (SFR) using the formula of Kennicutt (1998),
| (1) |
we find that luminous IR galaxies () form stars at a rate larger than 20 yr-1. Eq. (1) assumes continuous bursts lasting 10-100 Myr, solar abundance and a Salpeter IMF (Kennicutt 1998).
IRAS surveyed about 95 of the sky down to a completeness limit of 0.5 mJy at 60 m ( 1.5 Jy at 100 m) and the differential counts are well fitted by an Euclidean slope, (Soifer et al. 1987). The fluxes of all galaxies detected down to this sensitivity limit by IRAS add up to a 60 m IGL of 0.15 nW m-2 sr-1. This is less than 1 of the value of the CIRB measured by COBE at 140 m, = (257) nW m-2 sr-1.
2.2 Contribution of ISOPHOT galaxies
Deeper FIR extragalactic surveys were performed with ISOPHOT (Lemke et al. 1996) onboard ISO at 170 m. At this depth, the differential counts are no more fitted by an Euclidean slope, expected in the case of no evolution of galaxies with redshift, but instead a strong excess of faint sources was found. At the confusion limit of ISOPHOT of about 120 mJy, less than 10 of the value of the CIRB at 170 m is resolved into individual galaxies (Dole et al. 2001). A preliminary follow-up of the ISOPHOT galaxies suggests that a large fraction of these galaxies are located at low redshift.

2.3 Contribution of SCUBA galaxies
In the sub-millimeter range, the SCUBA bolometer array on the James Clerk Maxwell Telescope (JCMT) has produced deep images at 450 and 850 m. Number counts at both wavelengths present a steep slope compatible with a strong evolution as compared to the local universe (see Smail et al. 2001 and references therein).
At 450 m, a depth of 10 mJy is reached and the combined fluxes of all SCUBA galaxies produce about 15 of the CIRB measured by COBE-FIRAS at this wavelength (Smail et al. 2001).
At 850 m, SCUBA is confusion limited at 2 mJy (Hughes et al. 1998, Barger, Cowie & Sanders 1999, Eales et al. 2000, Smail et al. 2001), because of its large point spread function (PSF) of 15 full width half maximum (FWHM). About 20 of the value of the CIRB measured by COBE-FIRAS at 850 m (the 850 m EBL) is resolved into galaxies at this depth. However, using gravitational lensing this limit can be lowered to 1 mJy, where 60 of the CIRB is resolved (Smail et al. 2001, Blain et al. 1999a).
The 850 m EBL measured by COBE-FIRAS ( 0.50.2 nW m-2 sr-1) is 50 times lower than the peak value of the CIRB at 140 m. In order to compute the contribution of SCUBA galaxies to the peak of the CIRB it is therefore necessary to determine their redshift distribution and SED. Until now, very few redshifts have been obtained due to the large PSF of SCUBA and optical faintness of these galaxies. Hence the fraction of the CIRB resolved into individual galaxies by SCUBA remains highly uncertain.
2.4 Comparison with the MIR and radio
The deepest ISOCAM surveys reach a completeness limit of 100 Jy at 15 m (without lensing, but this limit goes down to 30-50 Jy including lensing, see Sect. 3). For a given galaxy SED and redshift, this flux density can be converted into a bolometric IR luminosity ([8-1000 m]). Any galaxy more luminous than this will be detected in the survey. In order to compare the sensitivity to distant luminous IR galaxies of ISOCAM, ISOPHOT and SCUBA, we have calculated corresponding to their sensitivity limits for a given redshift between =0 and 3. On one hand, we used the SED of M 82 (Fig. 1a) for galaxies of all luminosities. On the other hand, we used a library of template SEDs from Chary & Elbaz (2001). In the following, we will call it the “multi-template” technique. This library of 105 SEDs was constructed under the constraint that it reproduces the correlations observed between the 6.75, 12, 15, 60, 100 and 850 m luminosities of local galaxies. The SEDs were interpolated from a sample of observed SEDs, including MIR spectra obtained with the ISOCAM CVF. They cover the luminosity range = 8.5 to 13.5 (see Fig. 1b).
We did not use Arp 220’s SED in Fig. 1a, because this galaxy presents a large FIR over MIR luminosity ratio, which is not representative of galaxies within the same luminosity range (see Figs.5c,d).
The radio continuum (= 21 cm, = 1.4 GHz) is also a tracer of because of the tight correlation between both luminosities in the local universe (see Yun, Reddy & Condon 2001 and references therein). If this correlation remains valid in the distant universe then we can translate the sensitivity limit of the deepest radio surveys into a minimum accessible at a given redshift assuming a radio SED. The correlation between the radio and FIR luminosities is usually described by the “” parameter (Condon et al. 1991):
| (2) |
where is the monochromatic luminosity at 1.4 GHz and is the FIR luminosity between 40 and 120 m, as defined by Helou et al. (1988),
| (3) |
where and are the IRAS flux densities at 60 and 100 m in Jy. The relationship between [40-120 m] and [8-1000 m] was computed with the sample of 300 galaxies from the Bright Galaxy Sample (BGS, Soifer et al. 1987) detected in the four IRAS bands (12, 25, 60 and 100 m):
| (4) |
is defined as (Sanders & Mirabel 1996):
|
(5) |
where and are the IRAS flux densities at 12 and 25 m in Jy. Yun, Reddy & Condon (2001) measured a value of = 2.340.01 from a flux limited ( 2 Jy) sample of 1809 IRAS galaxies.
The deepest radio surveys presently available were performed in the HDFN by Richards (2000) and Garrett et al. (2000) with the VLA and WSRT respectively. Both surveys reach the same sensitivity limit of 40 Jy at 1.4 GHz (5-). In order to convert this flux density into a for a given redshift, we used a power index of = 0.80.15 (), as suggested by Yun, Reddy & Condon (2001) for starburst galaxies.
Fig. 2 presents the sensitivity of the deepest MIR, FIR, sub-millimeter and radio surveys in the form of LIR (or SFR) as a function of redshift. The sensitivity limits used for ISOCAM, ISOPHOT and SCUBA are taken from the deepest existing surveys at these wavelengths, as previously described. Fig. 2a (with M 82) and Fig. 2b (“multi-template” technique) both clearly show that the faintest IR galaxies are best detected at 15 m up to 1.3. The right axis of the plots shows the corresponding minimum SFR that a galaxy must harbor to be detected at a given redshift in the surveys. At 1, ISOCAM (plain line) detects all LIGs while SCUBA (dot-dashed line) detects only ULIGs. The difference in sensitivity between ISOCAM and the deepest radio surveys is about a factor 2. ISOPHOT (dotted line) is only sensitive to ULIGs above 0.5. In Fig. 2b, where we used the library of template SEDs from Chary & Elbaz (2001), the plain line corresponding to ISOCAM rises faster above 1 than in Fig. 2a, where we used M 82’s SED. This different behavior comes from the fact that at these redshifts ISOCAM measures fluxes at about 7 m in the rest-frame of the galaxy and we will show that / increases with (Sect. 4).
Above z2, the sub-millimeter becomes the most efficient technique, although only galaxies more luminous than a few 1012 L☉ can be detected above a sensitivity limit of 2 mJy at 850 m. Hence the unlensed ISOCAM and SCUBA surveys are not sampling the same redshift and luminosity ranges. This statement is confirmed observationally in the HDFN itself where none of the ISOCAM sources are detected by SCUBA (Hughes et al. 1998) and over a larger scale in the Canada France Redshift Survey 14 (CFRS-14, Eales et al. 2000). In this latter field of 50, only the two brightest 15 m ISOCAM sources are detected at 850 m, among a sample of 50 ISOCAM (Flores et al. 1999) and 19 SCUBA sources. This confirms that both instruments detect different sets of objects. More common objects between ISOCAM and SCUBA are expected if they are gravitationally lensed, since the sensitivity limits of both instruments are then decreased by a factor of about two. Indeed in the clusters A 370 and A 2390, three of the four lensed SCUBA galaxies (Smail et al. 2001) are also detected with ISOCAM (Altieri et al. 1999, Metcalfe 2000).
3 The 15 m extragalactic background light

Above the Earth’s atmosphere, the 15 m light is strongly dominated by the zodiacal emission from interplanetary dust and it has not yet been possible to make a direct measurement of the 15 m background, or EBL. Individual galaxies contribute to this background and a lower limit to the 15 m EBL can be obtained by adding up the fluxes of all ISOCAM galaxies detected per unit area down to a given flux limit. The resulting value is called the 15 m integrated galaxy light (IGL).
The statistical reliability with which the surface density of MIR sources is computed depends on their flux: large and shallow fields are required for bright sources which are less numerous, whereas faint sources require smaller and deeper fields. The optimization is obtained by observing similar volumes of the sky but in pencil beams for faint sources and in wide surveys for bright sources, instead of one large and deep survey which would be unnecessarily time consuming. Together with the need to account for cosmic variance, this explains why we have combined a set of 10 surveys located in 7 regions of the northern and southern hemispheres, in order to estimate the 15 m IGL. These surveys cover five orders of magnitude in flux density from Jy to Jy (including IRAS counts at 12 m). The number counts presented in Elbaz et al. (1999) are converted here into a differential contribution to the 15 m IGL as a function of flux density, estimated from the following formula:
| (6) |
where (sr-1) is the surface density of sources with a flux density [15 m] (mJy) over a flux density bin (mJy) (1 mJy= 10-20 nW m-2 Hz-1) and (Hz) is the frequency of the 15 m photons.
Below 3 mJy, about 600 galaxies were used to produce the points with errors bars in Fig. 3a. Fig. 3b shows the 15 m IGL as a function of depth. It corresponds to the integral of Fig. 3a, where the data below 3 mJy were fitted with a polynomial of degree 3 and the 1- error bars on were obtained from the polynomial fit to the upper and lower limits of the data points. The 15 m IGL does not converge above a sensitivity limit of 50 Jy, but the flattening of the curve below mJy suggests that most of the 15 m EBL should arise from the galaxies already unveiled by ISOCAM.
Above the completeness limit of Jy, we computed an IGL of:
| (7) |
where the error bar corresponds to the 68 confidence level (i.e. 1-). The error bar combines the uncertainty on the measurements for each individual survey with cosmic variance. Each flux bin is covered by two to three independent surveys. ISOCAM number counts are only complete above 100 Jy, but Aussel et al. (1999) computed number counts down to Jy after correcting for incompleteness and a consistent result is obtained by Altieri et al. (1999) after correcting for lensing magnification a sample of galaxies in the field of the galaxy cluster Abell 2390.
Only 9 sources are detected below Jy by Altieri et al. (1999), where the flux determination and correction for completeness are less robust and are not confirmed by another survey. A tentative value of 3.3 1.3 nW m-2 sr-1 was quoted in Altieri et al. (1999), above = 30 Jy. This value may be slightly overestimated if we consider that the models of Franceschini et al. (2001) and Chary & Elbaz (2001), which reproduce the number counts from ISOCAM at 15 m, from ISOPHOT at 90 and 170 m and from SCUBA at 850 m, as well as the shape of the CIRB from 100 to 1000 m, consistently predict a 15 m EBL of:
| (8) |
If this prediction from the models is correct then about of the 15 m EBL is resolved into individual galaxies by the ISOCAM surveys.
This result is consistent with the upper limit on the 15 m EBL estimated by Stanev & Franceschini (1998) of:
| (9) |
This upper limit was computed from the 1997 -ray outburst of the blazar Mkn 501 ( 0.034) as a result of the opacity of MIR photons to -ray photons, which annihilate with them through pair production. It was recently confirmed by Renault et al. (2001), who found an upper limit of 4.7 nW m-2 sr-1 from 5 to 15 m.
Finally, the 15 m background (EBL) must be contained between the following limits:
| (10) |
| Field | F(mJy) | Ref. | |
|---|---|---|---|
| A2390,HDFN | [ 0.05, 0.1 ] | 23 | (1,2) |
| IGTES | [ 0.1, 0.5 ] | 48 | (2,3) |
| IGTES | [ 0.5, 3 ] | 23 | (3) |
| ELAIS | [ 3, 32 ] | 4.5 | (4) |
| Interpolation | [ 32,300 ] | 1 | (5) |
| IRAS | [ 300,4000 ] | 0.5 | (6) |
In Table 1, we give the relative contribution to the 15 m IGL from sources within a given flux density range. Nearly all the IGL is produced by sources fainter than 3 mJy (94 ) and about 70 by sources fainter than 0.5 mJy. This means that the nature and redshift distribution of the galaxies producing the bulk of the 15 m IGL can be determined by studying these faint galaxies only. We will therefore assume in the following that the spectroscopically complete sample of 15 m galaxies detected in the HDFN below 0.5 mJy (Aussel et al. 1999, 2001) is representative of the population of dusty galaxies producing the bulk of the 15 m IGL.
4 MIR, as a tracer of the bolometric IR luminosity
4.1 SED of galaxies in the IR

Above a bolometric luminosity of a few , the SED of a galaxy is dominated by dust radiation with respect to direct stellar emission. Stellar light is absorbed by dust and re-radiated in the IR regime above 5 m. The full SEDs, from the UV to the radio, of the starburst galaxy, M 82, and of the ULIG, Arp 220, are plotted in the Fig. 1a. A zoom on the 5-2000 m wavelength range of the SEDs is shown in the Fig.4, together with three other galaxies: a starburst, Arp 244, and two Seyfert 2 galaxies, NGC 1068 and NGC 6240. Arp 244, also known as the “Antennae” galaxy, is a system of two interacting spiral galaxies (Vigroux et al. 1996, Mirabel et al. 1998). The optical, MIR and FIR luminosities of these five galaxies are given in the Table 2. Note the increase of the MIR luminosity together with , or , from M 82 to Arp 244 to NGC 6240. This correlation will be statistically established in Sect. 4.2.2.
The FIR over MIR luminosity ratio of Arp 220 is larger than for galaxies of equivalent luminosity (see Fig. 5 in Sect. 4.2.2). The flat FIR over MIR ratio for NGC 1068 is typical of the hot dust continuum from AGNs. NGC 1068 is the closest Seyfert 2 (). On one hand, its MIR spectrum is completely dominated by a continuum due to the hot dust heated by the central AGN, which produces about 75 of the MIR luminosity (Le Floc’h et al. 2001). On the other hand, the bulk of its FIR luminosity originates from the diffuse region surrounding the nucleus as shown by the SCUBA image at 450 m, which is associated with star formation (Le Floc’h et al. 2001). As a result, the FIR over MIR luminosity ratio is much lower for NGC 1068 than for starbursts (see Fig.4). This galaxy is a perfect illustration of the close connection between star formation and AGN activity.
| M 82 | Arp244 | Arp220 | N1068 | N6240 | |
| 3.25 | 22.0 | 78.4 | 14.4 | 99.6 | |
| 10.2 | 10.2 | 10.6 | 10.5 | 10.5 | |
| 10.6 | 10.8 | 12.2 | 11.2 | 11.8 | |
| 10.4 | 10.7 | 12.1 | 10.8 | 11.7 | |
| 9.8 | 10.0 | 10.6 | 10.8 | 10.7 | |
| 9.9 | 10.1 | 10.3 | 10.6 | 10.5 | |
| / | 2 | 3 | 39 | 5 | 18 |
| / | 15 | 7 | 41 | 5 | 10 |
| / | 4 | 4 | 87 | 4 | 22 |
The MIR (5-40 m) and FIR (40-1000 m) emission of a galaxy combine three major components (see Fig.4):
- broad emission features and their associated underlying continuum, which dominate in the 5-10 m domain, and up to 20 m for galaxies with moderate star formation. These bands located at 6.2, 7.7, 8.6, 11.3 and 12.7 m, are usually quoted as PAHs (polycyclic aromatic hydrocarbons, Léger Puget 1984, Puget Léger 1989, Allamandola et al. 1989), although their exact nature remains uncertain, e.g. Jones & d’Hendecourt (2000).
- the “warm” dust continuum produced by very small dust grains (VSGs, smaller than 0.01 m, Andriesse 1978, Désert, Boulanger & Puget 1990) heated at temperatures larger than 200 K without reaching thermal equilibrium. This component dominates the SED between 10-20 to 40 m for luminous galaxies.
- the “cold” dust continuum produced by big dust grains (“big grains”, of size m) in the thermal equilibrium at cool temperatures (below 60-70 K typically). This component is responsible for the bulk of the FIR light where the SED peaks.

4.2 The MIR-FIR correlation
4.2.1 The database
We have compiled a database containing MIR and FIR fluxes for a sample of 157 galaxies detected with ISOCAM and IRAS: 50 galaxies from Boselli et al. (1998), 44 galaxies from Roussel et al. (2001), 19 galaxies from Laurent et al. (1999, 2000), 41 galaxies from Dale et al. (2001), plus M 82, Arp 244 and NGC 1068 (from Figs. 4). Fig. 5 shows that the 6.75, 12, 15 and bolometric IR (8-1000 m) luminosities () of these galaxies are tightly correlated with each other. is calculated following Eq. (5). At 15 m (LW3 filter), we completed our sample with the NEPR sample of IRAS galaxies observed with ISOCAM-LW3 (Aussel et al. 2000). We converted the 60 m luminosities of the NEPR galaxies into by fitting the IR versus 60 m correlation obtained with the BGS (Soifer et al. 1987). In order to complete our sample in the high luminosity range at 6.75 m (LW2 filter), we used a sample of 40 ULIGs observed with the spectrometer of ISOPHOT, PHOT-S (from Rigopoulou et al. 1999: the conversion into LW2 flux densities was computed as in Chary & Elbaz 2001). We also used four ULIGs observed with the ISOCAM CVF from Tran et al. (2001). We conservatively selected these star forming galaxies with respect to AGNs from their line over continuum ratioas suggested in Tran et al. (2001). The ISOCAM-CVF spectra were converted into LW2 flux densities using the transmission curve of the LW2 filter.
4.2.2 Correlations
The 6.75, 12 and 15 m luminosities of local galaxies are tightly correlated with each other (see Fig. 5a,b) following the formulae:
|
(11) |
|
(12) |
These correlations can be used to estimate the rest-frame 15 m luminosity for galaxies located around 0.3 and 1. At these redshifts, 15 m observed corresponds to about 12 and 7 m in the rest-frame.
The MIR luminosity of galaxies is a good tracer of as seen in Figs. 5c,d, where is correlated with at 15 and 6.75 m following the formulae:
|
(13) |
|
(14) |
The formulae used in these four correlations are consistent with Chary & Elbaz (2001), although slightly more data were used here. The change of slope in Fig. 5d and Eq. (14) from a slope of 1 to a slope larger than 1 statistically establishes what was suggested by Fig. 4: /[6.75 m] increases with for galaxies with 210.
The position of the five templates from Fig. 4 are indicated with open squares on Fig. 5. Two galaxies do not fit the correlations: Arp 220 and NGC 1068. Arp 220 presents a very large FIR over MIR ratio, which was interpreted as being due to extinction in the MIR by Haas et al. (2001), while the IR SED of the Seyfert 2 NGC 1068 is flat, which is typical of AGNs. In this sense NGC 6240 is quite atypical, since it falls perfectly on the correlation followed by star forming galaxies. The presence of an active nucleus in NGC 6240 was revealed by its strong X-ray luminosity and Ikebe et al. (2000) suggested that a large fraction of the IR luminosity of this galaxy could originate from its AGN. However, the presence of strong MIR features (Genzel et al. 1998), the absence of a strong continuum emission below 6 m (Laurent et al. 2000), together with a FIR over MIR ratio typical of star forming galaxies, suggest that the bulk of its IR luminosity may still be due to star formation.

5 IR luminosities and star formation rates of ISOCAM galaxies
In this Section, we compute the IR luminosity and star formation rate of the galaxies with 0.1 mJy located in the Hubble Deep Field North plus its flanking fields, hereafter called ISOCAM-HDFN galaxies (Aussel et al. 1999, 2001). This field presents the advantage of being spectroscopically complete and deep enough to cover a flux density range ( 0.5 mJy) where more than 70 of the 15 m IGL is produced. Moreover, the redshift distribution of the ISOCAM-HDFN galaxies ( 0.8) is similar to the one measured in the CFRS fields CFRS-14 (Flores et al. 1999, 2002) and CFRS-03 (Flores et al. 2002). Together, these fields of 100 each, possess 81 galaxies with 0.35 mJy. The redshift distribution of 70 of the CFRS galaxies, for which a spectroscopic redshift was measured, is very similar to the one presented below for the ISOCAM-HDFN galaxies and peaks around 0.7.
5.1 Redshift distribution of the ISOCAM-HDFN galaxies
The list of ISOCAM-HDFN sources used in the following comes from a revised version of the list published in Aussel et al. (1999). In this version (Aussel et al. 2001), 4 ISOCAM sources were deblended using PSF deconvolution based on the position of the optical counterparts and the flux density of 10 other galaxies were re-evaluated. With a PSF FWHM of 4.6 at 15 m (Okumura 1998), optical counterparts are easily identified for ISOCAM galaxies and all of them are found within 3 of the PSF centroid. This can also be seen is the crowded field of the nearby galaxy cluster Abell 1689 (Fadda et al. 2000). More than 90 of the ISOCAM galaxies present an optical counterpart brighter than I(Kron-Cousins)=22.5, which is natural since ISOCAM is mostly sensitive to galaxies closer than 1.3 (see Fig. 2). It results from a combination of sensitivity limit and k-correction: dust emission becomes negligible below m (except for bright AGNs which can be detected further away).
A total of 41 ISOCAM-HDFN galaxies have 15 m flux densities between 0.1 and 0.5 mJy (see Fig.6a) over a field of 25.8′2 (HDFN+FF). Monte-Carlo simulations give a completeness of 90 in this flux density range (Aussel et al. 1999, 2001). All but one galaxy (HDF_PS3_6a) possess a spectroscopic redshift (98 complete). Their mean and median redshift is 0.8. Except for one galaxy located at z=2.01 (HDF_PM3_5, classified as an AGN, see Sect. 5.2) and four galaxies closer than z=0.15, all ISOCAM galaxies have a redshift between 0.4 and 1.3 (see Fig.6b), as expected from the Fig. 2.

5.2 Fraction of AGN galaxies
Cohen et al. (2000) classified the optical spectra of 2/3 of the ISOCAM galaxies and found only two galaxies presenting broad emission lines typical of AGNs:
HDFPM36 (C363671346, 0.960),
HDFPM320 (C364631404, 0.962).
However, dusty AGNs may not be easily identified in the optical.
The best technique at present for the identification of dusty AGNs is offered by hard X-ray observations, which are much less affected by extinction. The deepest soft plus hard X-ray observation currently available was performed with the Chandra X-ray Observatory in the HDFN by Hornschemeier et al. (2001) and Brandt et al. (2001,2002). The Chandra and ISOCAM catalogs were cross-correlated by Fadda et al. (2001). A total of 16 ISOCAM-HDFN ( 0.1 mJy) are detected in the 1 Msec Chandra image at the depth of [0.5-2 keV] 310-17 erg cm-2 s-1 and [2-8 keV] 210-16 erg cm-2 s-1. They represent 39 of the ISOCAM-HDFN galaxies. However, the Chandra image is so deep that it is able to detect starburst galaxies up to large redshifts and among the 16 ISOCAM galaxies in common with Chandra sources, only 5 are classified as being AGNs or AGN dominated by Fadda et al. (2001). These 5 sources include the two galaxies previously identified as AGNs from their optical spectra and the following 3 galaxies:
HDFPM35 (J123635.6621424, 2.010),
HDFPS310 (J123642.1621545, 0.857),
HDFPM321 (J123646.4621529, 0.851).
Galaxies detected in the ultra-hard X-ray band (4-8 keV) or with 1043 erg s-1 were classified as AGNs. Galaxies with 1040 erg s-1 or which could be fitted with the SED of M 82 or Arp 220 were classified in the starburst category.
Finally only (125) (5/41 galaxies, poissonian error bar) of the ISOCAM-HDFN galaxies are found to be powered by an active nucleus. These AGNs contribute to (187) of the sum of the flux densities (the IGL) of all 41 ISOCAM-HDFN galaxies. Since the active nuclei in these galaxies may not be responsible for the totality of the IR emission, this result suggests that at most (187) of the 15 m IGL due to galaxies with = 0.1-0.5 mJy is produced by AGN activity.
The = 0.5–3 mJy flux density range is covered by the ISOCAM image of the Lockman Hole, where Fadda et al. (2001) cross-correlated ISOCAM with the XMM-Newton X-ray observatory catalog of sources brighter than [2-10 keV] 1.410-15 erg cm-2 s-1 and [5-10 keV] 2.410-15 erg cm-2 s-1 (Hasinger et al. 2001). Among 103 ISOCAM sources with a flux density ranging from 0.5 to 3 mJy, 13 sources were found to be AGN dominated by Fadda et al. (2001), i.e. (134) . Such galaxies could be fitted by the SEDs of either type-I or type-II AGNs by Franceschini et al. (2002). These AGNs contribute to (155) of the 15 m IGL due to galaxies in the 0.5–3 mJy flux range.
The combination of the HDFN and Lockman Hole cover a flux density range of 0.1-3 mJy where 70 of the 15 m IGL is measured. In this range, these two fields suggest that AGNs contribute to at most (176) . It must be noted that the XMM-Newton and Chandra experiments were limited to energies below 10 keV. Some harder X-ray AGNs may not have been detected by these instruments yet and may be common with our ISOCAM source list. The presence of such objects will remain will highly uncertain until the launch of the next generation X-ray experiments (XEUS, Constellation X). We will assume in the following that the AGN fraction computed in the HDFN (which is larger than in the Lockman Hole) applyies for the 15 m IGL as a whole.
| Type | Nb | |||||
| () | () | () | ||||
| ULIGs | 1.2 | 11.3 0.1 | 12.3 0.2 | 332148 | 6 | 17 |
| LIGs | 0.8 | 10.5 0.1 | 11.5 0.2 | 5626 | 20 | 44 |
| Starbursts | 0.5 | 9.8 0.1 | 10.7 0.2 | 94 | 5 | 9 |
| Normal | 0.1 | 8.3 0.1 | 9.4 0.2 | 0.40.2 | 4 | 11 |
| AGNs | 0.9 | 11.1 0.7 | 11.5 0.7 | - | 5 | 19 |
| Median | 0.8 | 10.4 0.1 | 11.4 0.2 | 4119 | 35 | 100 |
| Mean | 0.8 | 10.8 0.1 | 11.8 0.2 | 10951 | 35 | 100 |
5.3 Rest-frame 15 m luminosity of ISOCAM galaxies
In this section, we compare three different techniques to estimate the rest-frame 15 m luminosity of ISOCAM galaxies. The first and simplest technique consists in using a single template SED to compute the k-correction. We chose the SED of M 82 (Fig. 1a) which falls on the correlations plotted in the Fig. 5 (crosses in Fig. 7b). As in Sect. 2, we decided not to use the SED of Arp 220 (Fig. 1a) because it is well outside the correlations found for galaxies of similar luminosities with its large FIR over MIR luminosity ratio.
In a second technique, that we will call “closest filter”, we use directly the correlations described in Sect. 4 (Eq. (11) and Eq. (12)) between the rest-frame 15 m and 6.75 or 12 m luminosities. We first calculate the rest-frame wavelength =15/(1+) m and find which of the three filters ISOCAM-LW3, ISOCAM-LW2 and IRAS-12 has its central wavelength the closest to (see Fig. 7a). Then we apply the formula given in the Sect. 4.2.2 for this “closest filter” to compute the rest-frame 15 m luminosity (filled dots in Fig. 7b). Since most ISOCAM-HDFN galaxies are located around the median redshift 0.8, the correlation between LW3 and LW2 (Fig. 5d, Eq. (11) is most often used.
The third technique is the multi-template technique already used in Sect. 2.4, where we use the library of 105 template SEDs from Chary & Elbaz (2001). For a given galaxy of flux density located at a given redshift , we have computed for each one of the 105 template SED if it were located at the same redshift . The template for which the computed was the closest to the observed was then used to compute the rest-frame 15 m luminosity, [15 m] (open circles in Fig. 7b), after a normalization by a factor /.
The rest-frame 15 m luminosities estimated using the three techniques for the ISOCAM-HDFN galaxies are consistent within 20 (1-, see Fig.7b). Above , the first technique, which makes use of the SED of M 82, systematically underestimates [15 m], as compared to the other two techniques. This was to be expected since M 82 is a moderately luminous IR galaxy with a lower FIR over 6.75 m luminosity ratio than more luminous galaxies (see Fig. 5d).
In the following, we will use the multi-template technique to estimate the IR luminosity and SFR of galaxies, because it is consistent with the correlations between MIR and FIR luminosities and provides a continuous interpolation between the 6.75, 12,15 m and FIR luminosities based on observed spectra. Since the templates fit the correlation between and [15 m], it is equivalent to compute [15 m] first and then use Eq. (13) which links and [15 m] or to estimate directly with the best template SED.
5.4 Luminosities and star formation rates

In this section, we use the multi-template technique to directly estimate the and SFR of the ISOCAM-HDFN galaxies. The results are shown in the Fig. 8 and Table 3. The 1- error bars in Fig. 8 were computed from the dispersion measured in the correlations of the Fig. 5. For example, for a galaxy located at 1, since is close to 7 m, the error bar on is the quadratic sum of the error bar on Eq. (11), which gives from , and of the error bar on Eq. (13), which gives from .

The dashed line on Fig. 8 corresponds to the sensitivity limit of = 0.1 mJy converted into a as in the Fig. 2. Table 3 summarizes the properties of the ISOCAM galaxies in each of these four galaxy categories plus the AGN category.
About 75 of the galaxies dominated by star formation are either LIGs or ULIGs, while the remaining 25 are nearly equally distributed among either “starbursts” () or “normal” galaxies ( 10). The contribution of each galaxy type to the 15 m IGL () is given in the last column of the Table 3. Luminous IR galaxies are responsible for about 60 of while AGNs contribute to about 20 , the remaining 20 being due to the normal and starburst galaxy types. This repartition will be used in Sect. 6 to compute the 140 m IGL () from ISOCAM galaxies.
The mean IR luminosity of the ISOCAM-HDFN galaxies is 61011 . It corresponds to a 100 M☉ yr-1 (from Eq. (1)). In the following section, we evaluate the robustness of this result with an independent estimator of the IR luminosity: the radio luminosity.
5.5 The radio-MIR correlation
The radio continuum is also a tracer of the bolometric IR luminosity of star forming galaxies as a result of the tight correlation between IR and 1.4 GHz radio continuum in local galaxies (Condon 1992, Yun, Reddy & Condon 2001; see Sect. 2.4). The origin of this correlation remains unclear, but it is generally assumed that massive stars are both responsible for the UV photons that heat dust before it radiates in the IR and for the synchrotron acceleration of electrons, producing the radio continuum, when they explode as supernovae.
In Fig. 9a, we have plotted the 1.4 GHz and 15 m luminosities of the 109 local galaxies (small filled dots) from the ISOCAM sample described in Sect. 4.2.1, which were detected in the NRAO VLA Sky Survey (NVSS, Condon et al. 1998). As expected both luminosities are correlated with each other since both the 1.4 GHz and 15 m luminosities are correlated with .
Half of the 35 star forming HDFN-ISOCAM galaxies with spectroscopic redshift (AGNs excluded) present flux densities larger than 40 Jy at 1.4 GHz (5-) in the VLA and WSRT catalogs from Richards (2000) and Garrett et al. (2000) respectively. Their rest-frame 15 m luminosities were computed in the Sect. 5.3. Their rest-frame 1.4 GHz luminosities were computed assuming a power-law as in Sect. 2.4: , where = 0.80.15 as suggested for star forming galaxies in Yun, Reddy & Condon (2001). The rest-frame 15 m and 1.4 GHz luminosities of these 17 HDFN-ISOCAM galaxies are plotted as filled dots with error bars in the Fig. 9a. The error bars on [1.4 GHz] were computed from the quadratic sum of the error bars on the measurement of the radio flux densities plus the error bar on . Nine galaxies common in both catalogs from Richards (2000) and Garrett et al. (2000) present up to 40 differences in their radio flux densities. For these galaxies, we used the mean value and included the difference between both measurements in the error bars.
We have also included 7 galaxies from the CFRS-14 field (Flores et al. 1999), which rest-frame luminosities were computed with the same techniques (open dots).
The MIR and radio luminosities of this sample of 24 distant dusty galaxies ( 0.8) are also strongly correlated with each other. This is the first time that such correlation is found at these redshifts. The plain line in the Fig. 9a is a power-law fit to this correlation. For comparison, we have plotted in dashed line the correlation that one would expect from the combination of Eq. (13) ( from ) and the radio “” parameter (see Sect. 2.4). The slope of the correlation observed for distant galaxies is marginally steeper than this dashed line. It is also slightly steeper than the correlation found for local galaxies (small filled dots), but the difference is too marginal with respect to the number of galaxies at high luminosities for detailed interpretation.
In Fig. 9b, the “” parameter for the 24 ISOCAM-HDFN and CFRS-14 galaxies is plotted as a function of redshift. The “” parameter is the logarithm of the ratio of over (1.4 GHz) (see Eq. (2)). was estimated as described in Sect. 5.4, then converted into from Eq. (4). The median value of the “” parameter for the 24 galaxies is: = 2.3 (plain and dotted lines in Fig. 9b), in perfect agreement with the local value of = 2.340.01 (Yun, Reddy & Condon 2001, dashed line in Fig. 9b).
This study shows that the IR luminosities estimated from the ISOCAM 15 m flux densities using the MIR-FIR correlations are perfectly consistent with those estimated from the radio. Although it is not clear whether the radio versus IR correlation also applyies up to 1, this result independently validates our estimate of the bolometric IR luminosity of the ISOCAM galaxies.
5.6 Evolution of the infrared volume emissivity with redshift
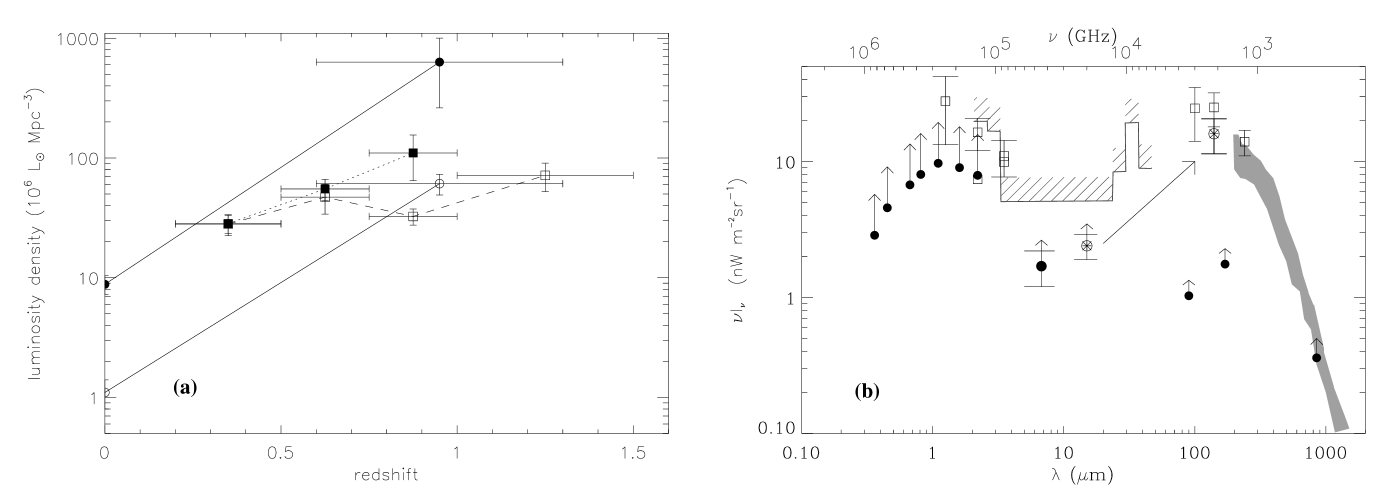
We have seen that the excess of faint MIR sources in number counts was due to the presence of distant ( 1) luminous IR galaxies. As a consequence, the amount of star formation per comoving volume hidden by dust must have rapidly decreased from z1 to 0. Indeed, the ISOCAM-HDFN galaxies with 0.6 1.3 and 10 (LIGs and ULIGs; AGNs excluded) produce a 15 m luminosity density of Mpc-3, while in the local universe luminous IR galaxies only make Mpc-3 (see Table 4). The comoving luminosity density produced by luminous IR galaxies at 15 m was therefore about 55 times larger at 1 than in the local universe. The 15 m luminosity densities at 0 were calculated using the local luminosity function (LLF) from Xu et al. (1998). In order to estimate the contribution of luminous IR galaxies, we used the Eq.(13) to convert the IR luminosity cut-off of into a 15 m luminosity cut-off of . The 15 m luminosity density that we have computed is consistent with the one measured at 12 m from IRAS, Mpc-3, converted to 15 m using Eq.(12).
If we now consider the bolometric IR luminosity (from 8 to 1000 m) of ISOCAM galaxies, as estimated in the Sect. 5, we find that the comoving density of IR luminosity radiated by dusty starbursts was about (70 35) times larger at 1 than today (computed from the LLF of Soifer et al. 1987). Since the IR luminosity is directly proportional to the extincted star formation rate of a galaxy, this means that the comoving density of star formation taking place in luminous IR galaxies was about (70 35) times larger at 1 than today. In case of a pure density evolution proportional to (1+)n, this would translate into a value of 6. However, we want to emphasize that we are only considering here the galaxies detected by ISOCAM, not the full luminosity function. For comparison, the -band (0.44 m) luminosity density was only about three times larger at 1 than today.
The redshift evolution of the comoving density of IR luminosity is compared to the UV (2800Å) one in Fig. 10a. Both wavelengths exhibit similar luminosity densities at low redshift but the IR rises faster than the UV and reaches a larger value at 1, implying that a much larger fraction of star formation was hidden by dust at 1 than today.
Finally, we note that the projected density of galaxies detected in the -band in the HDFN (529 galaxies/ with 29, Pozzetti et al. 1998) is 330 times greater than the projected density of ISOCAM galaxies (1.6 sources/, with 0.1 mJy or (15 m) 18.9). However the ISOCAM galaxies produce a 15 m IGL which is only twice lower than the -band IGL ( nW m-2 sr-1, Madau & Pozzetti 2000). This confirms that the very luminous galaxies detected in the MIR radiate mostly in the IR.
| 15 m | 8-1000 m | 0.44 m | |||
|---|---|---|---|---|---|
| All | LIGs | All | LIGs | All | |
| 0 | 7.51.6 | 1.10.3 | 12030 | 8.81.6 | 822 |
| 1 | - | 6112 | - | 632291 | 240100 |
6 Contribution of ISOCAM galaxies to the cosmic infrared background
Fig. 10b summarizes the current estimates of the cosmic background for 0.1 to 1500 m. Lower limits to the EBL (filled dots) come from integrating galaxy fluxes (IGL), while direct measurements of the EBL come from the COBE experiments DIRBE (open squares) and FIRAS (grey area, 200 m, Lagache et al. 1999). Table 5 gives the origin of the data used in Fig.10b. Three independent studies obtain the same FIR to sub-millimeter EBL above m. We did not consider here the EBL at m (Finkbeiner, Davis & Schlegel 2000) because it strongly depends on the remains controversial (see Puget & Lagache 2001).
| Filter | AB | Ref | ||||
| m | mag | |||||
| U | 0.36 | 2.87 | [0.58,0.42] | 0.023 | 28 | 1 |
| B | 0.45 | 4.57 | [0.73,0.47] | 0.009 | 29 | 1 |
| V | 0.67 | 6.74 | [1.25,0.94] | 0.002 | 30.5 | 1 |
| I | 0.81 | 8.04 | [1.62,0.92] | 0.009 | 29 | 1 |
| J | 1.1 | 9.71 | [3.00,1.90] | 0.009 | 29 | 1 |
| H | 1.6 | 9.02 | [2.62,1.68] | 0.009 | 29 | 1 |
| K | 2.2 | 7.92 | [2.04,1.21] | 0.23 | 25.5 | 1 |
| LW2 | 6.75 | 1.7 | 0.5 | 0.03 | 20.2 | 2 |
| LW3 | 15 | 2.4 | 0.5 | 0.05 | 19.7 | |
| PHOT | 90 | 1.03 | 1.5e3 | 11 | 3 | |
| PHOT | 170 | 0.88 | 1.5e3 | 11 | 3 | |
| PHOT | 170 | 1.76 | 1.2e3 | 11 | 4 | |
| SCUBA | 850 | 0.36 | 2 | 15.6 | 5 | |
| SCUBA(l) | 850 | 0.5 | 0.2 | 0.5 | 17.2 | 6 |
| 1.25 | 27.8 | 14.5 | 7 | |||
| 1.25 | 22.9 | 7.0 | 8 | |||
| 2.2 | 20.4 | 4.9 | 8 | |||
| K | 2.2 | 7.4 | 6.9 | 9 | ||
| K | 2.2 | 16.4 | 4.4 | 10 | ||
| 3.5 | 7.4 | 6.9 | 9 | |||
| 3.5 | 11.0 | 3.3 | 8 | |||
| DIRBE | 60 | 28.1 | 8.8(b) | 11 | ||
| DIRBE | 100 | 24.6 | 10.5(c) | 11 | ||
| DIRBE | 100 | 23.4 | 6.3 | 12 | ||
| DIRBE | 140 | 25.0 | 7.0 | 11 | ||
| DIRBE | 140 | 24.2 | 11.6 | 12 | ||
| DIRBE | 240 | 14.0 | 3.0 | 11 | ||
| DIRBE | 240 | 11.0 | 6.9 | 12 | ||
| FIRAS | 850 | 0.5 | 0.2 | 13 |
Below m, the cosmic background originates from direct stellar light, while above this wavelength, it comes from either stellar or AGN light reprocessed by dust. In the dust domain, i.e. from 5 to 1500 m, the cosmic background peaks around m. It is not directly measured over this whole wavelength range, but below m and down to about 2 m, an upper limit is set by the observations of the TeV outburst of Mkn 501 (see Sect. 3).
The 15 m IGL (IGL15 = (2.40.5) nW m-2 sr-1, see Sect. 3) is marked with a surrounded star on the Fig. 10b. It is about ten times lower than the peak of the CIRB at m. At the median redshift of the ISOCAM galaxies, 0.8 (Sect. 5.1), the rest-frame wavelengths corresponding to the observed 12-18 m (ISOCAM-LW3 bandpass) and 140 m wavelengths, are 6.5-9.8 m and 80 m. These rest-frame wavelengths are close to the ISOCAM-LW2 (5-8.5 m) and IRAS (60, 100 m) bands. We have seen in the Fig. 5d that the luminosities of local galaxies in both bands correlate with each other. If this correlation remains valid up to 1, then it implies that we can compute the 140 m IGL due to ISOCAM galaxies. There is no obvious reason why the SEDs of galaxies at 1 would exhibit very different IR SEDs. For example, the SED of the extremely red object HR 10 ( 1.44) is very similar to the one of Arp 220 normalized by a factor of 4 (Elbaz et al. 2002).
We propose here to use the multi-template technique, as in Sect. 5, to compute the contribution of ISOCAM galaxies to the 140 m background. We will first separate the relative contributions to IGL15 from ULIGs, LIGs, SBs, normal galaxies and AGNs as estimated in the Sect. 5. For each galaxy type, a median redshift, , and the ratio / are estimated based on the HDFN sample (see Table 1). Although a larger sample would improve the statistical reliability of this computation, this choice is justified by the fact that the bulk of the 15 m IGL is produced by galaxies with flux densities in the range 0.35-1 mJy as the HDFN and CFRS-14 galaxies, which share similar redshifts distributions. It is important to separate the contribution from galaxies of different luminosities since the IR versus 6.75 m luminosity correlation presents a slope larger than one (Fig. 5d). The contribution from AGNs is computed assuming that they all share the SED of NGC 1068. This is a conservative hypothesis since NGC 1068 exhibits the lowest FIR over MIR ratio that we know.
The results are summarized in the Table 6. We first separate the contribution of each type of galaxy to the 15 m IGL (Col.(3),(4)). The 140 m IGL is then computed by converting each contribution to the 15 m IGL into a contribution at 140 m, by multiplying by each time. We find a total of (165) nW m-2 sr-1 (see Fig. 10b), which corresponds to (6535) of the observed value from COBE-DIRBE (= (257) nW m-2 sr-1, Hauser et al. 1998, Lagache et al. 2000, Finkbeiner et al. 2000).
Hence the galaxies detected in ISOCAM deep surveys are found to be responsible for the bulk of the CIRB. About half of this 140 m IGL is due to LIGs and about one third from ULIGs. The contribution of AGNs is estimated to be as low as 4 of the 140 m IGL. It could be as high as 20 if instead of NGC 1068, we had used the SED of NGC 6240. In this case, ISOCAM galaxies would produce a (195) nW m-2 sr-1. If we had included the contribution from galaxies with flux densities between 30 and 50 Jy only detected through lensing magnification (see Sect. 3), would be larger by an extra 4 nW m-2 sr-1.
At the mean redshift of 0.6 where the bulk of the -band IGL is produced (Pozzetti & Madau 2001), light was radiated in the UV in order to be observed at 0.44 m. As we have seen, the bulk of the 140 m is also produced in the same redshift range. Hence the 140 m and -band probe the UV emission from stars with and without dust extinction. The ratio of over should therefore give a rough approximation of the ratio of extincted over non extincted star formation around 0.5-1. This ratio is close to 5, which suggests again that the bulk of the UV photons radiated by young stars in this redshift range was strongly affected by dust extinction. This value is consistent with the one obtained by Chary & Elbaz (2001) or Franceschini et al. (2001).
| Type | 15 | IGL15 | IGL140 | 140 | ||
|---|---|---|---|---|---|---|
| ULIGs | 1.2 | 17 | 0.40.1 | 146 | 5.72.8 | 36 |
| LIGs | 0.8 | 44 | 1.10.2 | 73 | 7.73.6 | 48 |
| SBs | 0.5 | 9 | 0.20.1 | 41 | 1.00.4 | 6 |
| normal | 0.1 | 11 | 0.30.1 | 41 | 0.90.5 | 6 |
| AGNs | 1.0 | 19 | 0.50.1 | 1.4 | 0.70.1 | 4 |
| Total | 0.8 | 100 | 2.40.5 | 73 | 16.04.6 | 100 |
7 Conclusions
The cosmic IR background is a fossil record of the light radiated by galaxies since their formation. It peaks around 140 m whereas the spectral energy distribution of galaxies peaks above 60 m. This suggests that the bulk of the cosmic IR background is due to galaxies located below 1.3. We have shown that the best technique currently available to unveil dusty galaxies up to 1.3 is provided by the ISOCAM MIR extragalactic surveys.
We have computed the contribution of ISOCAM galaxies to the 15 m background, the 15 m integrated galaxy light, and found a value of (2.40.5) nW m-2 sr-1. This is about ten times below the cosmic background measured by COBE at 140 m: (257) nW m-2 sr-1.
We have demonstrated that the MIR luminosities at 6.75, 12 and 15 m were correlated with each other and with the bolometric IR luminosity for local galaxies. This suggests that the contribution of ISOCAM galaxies to the CIRB can be computed from , unless distant galaxies SEDs strongly differ from local ones.
The redshift distribution of ISOCAM galaxies was measured from the spectroscopically complete sample of galaxies in the region of the HDFN. This redshift distribution is consistent with the twice larger sample of ISOCAM galaxies detected in the CFRS fields CFRS-14 and CFRS-03 (Flores et al. 1999, 2002). At the median redshift of 0.8, the observed 15 and 140 m wavelengths correspond to about 7 m (ISOCAM-LW2 filter) and 80 m (IRAS bands) in the rest-frame of the galaxies. Luminosities at both wavelengths are correlated (see Fig. 5d). If the correlations between MIR and FIR luminosities remain valid up to 1, then they can be used to compute . We have checked with a sample of galaxies detected both in the MIR with ISOCAM and in the radio with the VLA and WSRT, that the MIR-FIR and radio-FIR correlations are consistent up to 1. This comparison independently validates our estimate of the bolometric IR luminosity of the ISOCAM galaxies, although it is not clear whether the radio-FIR correlation works also up to 1.
The fraction of active nuclei responsible for the 15 m luminosity of ISOCAM galaxies was estimated from the deepest soft and hard X-ray surveys available at present by the XMM-Newton and Chandra X-ray observatories in the Lockman Hole and HDFN respectively (Fadda et al. 2001). It was found that about (125) of the ISOCAM galaxies are powered by an AGN and that the AGN contribution to was about (176) . The AGN contribution to was found to be as low as 4 assuming that they all share the SED of the local Seyfert 2, NGC 1068. This is a conservative choice since NGC 1068 presents the flattest IR SED that we know. However, we note that the cosmic X-ray background (CXB) peaks around 30 keV (see Fig.1 of Wilman, Fabian & Nulsen 2000), while both XMM-Newton and Chandra were limited to energies below 10 keV. It is therefore possible that a population of hard X-ray AGNs was missed by these surveys. But as claimed by the authors of these deep X-ray surveys, the bulk of the CXB had been resolved into individual galaxies in the Lockman Hole and HDFN images. Moreover, using estimates of the present comoving density of black holes, Madau & Pozzetti (2000) calculated that less than 20 of the CIRB could be due to dusty AGNs.
For the remaining star forming galaxies, we used a library of template SEDs, reproducing the MIR-FIR correlations, to compute their IR luminosity and contribution to . We find that LIGs and ULIGs produce about 60 of . The comoving density of IR luminosity produced by these luminous IR galaxies was about (7035) times larger at 1 than today, while in the same redshift interval the -band or UV luminosity densities only decreased by a factor 3. Since the IR luminosity measures the dusty star formation rate of a galaxy, this also implies that the comoving density of star formation, due to luminous IR galaxies, decreased by a similar factor in this redshift range, i.e. much more than expected by studies at other wavelengths affected by dust extinction. This indicates that a large fraction of present day stars were formed during a dusty starburst event.
We estimate a contribution of ISOCAM galaxies to the peak of the CIRB at 140 m of (165) nW m-2 sr-1 as compared to the measured value of (257) nW m-2 sr-1 from COBE. This study therefore suggests that the ISOCAM galaxies are responsible for the bulk of the CIRB.
We have started a systematic spectroscopic follow-up of these galaxies with the aim of studying their physical properties and the origin of their large SFR. Franceschini et al. (2001) estimated their baryonic masses to be of the order of by fitting their optical and near-IR luminosities with template SEDs (from Silva et al. 1998) and assuming a Salpeter initial mass function (from 0.15 to 100 ). Their colors are similar to field galaxies of similar magnitudes (Cohen 2001), hence they could not have been selected on the basis of their optical colors. The technique which consists in using the spectral slope in the UV domain to correct luminosities from extinction (Meurer, Heckman & Calzetti 1999) fails to differentiate the luminous dusty galaxies detected with ISOCAM from other field galaxies in the HDFN+FF (Cohen 2001). This was to be expected since this technique only works for galaxies with (Meurer et al. 2000) while most ISOCAM galaxies are more luminous than this threshold. A property of the ISOCAM galaxies that may give a hint on their origin is their association with small groups of galaxies. A preliminary study of 22 ISOCAM-HDFN galaxies by Cohen et al. (2000) found that nearly all ISOCAM galaxies belonged to small groups, while the fraction of field galaxies with similar optical magnitudes belonging to such groups was 68 . The study of the full sample of ISOCAM-HDFN galaxies by Aussel et al. (2001) shows that all of them belong to physical groups, hence suggests that dynamical effects such as merging and tidal interactions are responsible for their large SFR.
The Space IR Telescope Facility (SIRTF) will soon provide a powerful insight on the FIR emission of distant dusty starbursts and its 24 m band, less affected by confusion, should prolongate their detection up to . Extending the redshift range surveyed by ISOCAM to such redshifts is particularly important to measure the direct IR emission of the distant population of Lyman break galaxies, whose dust extinction remains highly uncertain (Steidel et al. 1999). However, the direct measurement of the MIR and FIR emission of distant galaxies will only become possible with the launch of the Next Generation Space Telescope (NGST) and Herschel (FIRST) satellite scheduled for 2009 and 2007.
Acknowledgements.
DE wishes to thank the American Astronomical Society for its support through the Chretien International Research Grant and Joel Primack and David Koo for supporting his research through NASA grants NAG5-8218 and NAG5-3507. We wish to thank H.Flores and A.Blain for fruitful comments and A.Boselli for sharing his ISOCAM catalog with us. This research has made use of the NASA/IPAC Extragalactic Database (NED) which is operated by the Jet Propulsion Laboratory, California Institute of Technology, under contract with the National Aeronautics and Space Administration.References
- (1) Allamandola, L.J., Tielens, A.G.G.M., Barker, J.R. 1989, ApJS 71, 733
- (2) Almaini, O., Lawrence, A., Boyle, B.J. 1999, MNRAS 305, L59
- (3) Altieri, B., Metcalfe, L., Kneib, J.P., et al. 1999, A&A 343L, 65
- (4) Anantharamaiah, K.R., Viallefond, F., Mohan, N.R., Goss, W.M., Zhao, J.H. 2000, ApJ 537, 613
- (5) Andriesse, C.D., 1978, A&A 66, 169
- (6) Aussel, H., Cesarsky, C.J., Elbaz, D., Starck, J.L. 1999, A&A 342, 313
- (7) Aussel, H., Coia, D., Mazzei, P., De Zotti, G., Franceschini, A. 2000, A&AS 141, 257
- (8) Aussel, H., et al. 2001, in preparation
- (9) Barger, A.J., Cowie, L.L., Sanders, D.B. 1999, ApJ 518, L5
- (10) Bernstein, R.A., Freedman, W. L., Madore, B.F. 2001, ApJ, accepted (astro-ph/0112193)
- (11) Blain, A.W., Smail, I., Ivison, R.J., Kneib, J.-P. 1999a, MNRAS 302, 632
- (12) Blain, A.W., Kneib, J.-P., Ivison, R.J., Smail, I. 1999b, ApJ 512, L87
- (13) Boselli, A., Lequeux, J., Sauvage, M., et al. 1998, A&A 335, 53
- (14) Brandt, W.N., Hornschemeier, A.E., Alexander, D.M., et al. 2001, AJ 122, 1
- (15) Brandt, W.N., Alexander, D.M., Hornschemeier, A.E., et al. 2002, AJ, in press (astro-ph/0108404)
- (16) Cambrésy, L., Reach, W.T., Beichman, C.A., Jarrett, T.H. 2001, ApJ 555, 563
- (17) Cesarsky, D., Lequeux, J., Abergel, A., et al. 1996a, A&A 315, L305
- (18) Cesarsky, C.J., Abergel, A., Agnèse, P., et al. 1996b, A&A 315, L32
- (19) Charmandaris, V., Laurent, O., Mirabel, I.F., et al. 1999, Ap&SS 266, 99
- (20) Chary, R.R., Elbaz, D. 2001, ApJ 556, 562
- (21) Cohen, J.G., Hogg, D.W., Blandford, R., et al. 2000, ApJ 538, 29
- (22) Cohen, J.G. 2001, AJ 121, 2895
- (23) Coleman, G. D., Wu, C.-C., Weedman, D. W. 1980, ApJS 43, 393
- (24) Condon, J.J., Anderson, M.L., Helou, G. 1991, ApJ 376, 95
- (25) Condon, J.J., 1992, ARA&A 30, 575
- (26) Condon, J.J., Cotton, W.D., Greisen, E.W., et al. 1998, AJ 115, 1693
- (27) Connolly, A.J., Szalay, A.S., Dickinson, M.E., et al. 1997, ApJ 486, L11
- (28) Cowie, L.L., Songaila, A., Barger, A.J. 1999, ApJ 118, 603
- (29) Dale, D.A., Silbermann, N.A., Helou, G., et al. 2001, AJ 120, 583
- (30) Désert, F.-X., Boulanger, F., Puget, J.-L. 1990, A&A 237, 215
- (31) de Vaucouleurs, G., de Vaucouleurs, A., Corwin, H.G.Jr., et al. 1991, Third reference catalogue of Bright galaxies, (New York : Springer-Verlag) (RC3)
- (32) Dole, H., Gispert, R., Lagache, G., et al. 2001, A&A 372, 364
- (33) Dwek, E., Arendt, R.G., Hauser, M., et al. 1998, ApJ 508, 106
- (34) Dwek, E., Arendt, R.G. 1998, ApJ 508, L9
- (35) Eales, S., Lilly, S., Webb, T., et al. 2000, AJ 120, 2244
- (36) Elbaz, D., Cesarsky, C.J., Fadda, D., et al. 1999, A&A 351, L37
- (37) Elbaz, D., Flores, H., Chanial, P., et al. 2002, A&A 381, L1
- (38) Fadda, D., Elbaz, D., Duc, P.-A., et al. 2000, A&A 361, 827
- (39) Fadda, D., Flores, H., Hasinger, G., et al. 2001, A&A in press (astro-ph/0111412)
- (40) Finkbeiner, D.P., Davis, M., Schlegel, D.J. 2000, ApJ 524, 867
- (41) Fischer, J., Luhman, M.L., Satyapal, S. 1999, Ap&SS 266, 91
- (42) Fixsen, D. J., Dwek, E., Mather, J.C., Bennett, C.L., Shafer, R.A. 1998, ApJ 508, 123
- (43) Flores, H., Hammer, F., Thuan, T.X., et al. 1999, ApJ 517, 148
- (44) Flores, H., et al. 2002, in preparation
- (45) Förster Schreiber, N.M., Laurent, O., Sauvage, M., et al. 2000, A&A, in preparation
- (46) Förster Schreiber, N.M., Genzel, R., Lutz, D., Kunze, D., Sternberg, A. 2001, ApJ 552, 544
- (47) Franceschini, A., Aussel, H., Cesarsky, C.J., Elbaz, D., Fadda, D. 2001, A&A 378, 1
- (48) Franceschini, A., Fadda, D., Cesarsky, C.J., Elbaz, D., Flores, H., Granato, G.L. 2002, ApJ accepted (astro-ph/0111413)
- (49) Garrett, M.A., de Bruyn, A.G., Giroletti, M., et al. 2000, A&A 361, L41
- (50) Gorjian, V., Wright, E. L., Chary, R.R. 2000, ApJ 536, 550
- (51) Genzel, R., Lutz, D., Sturm, E., et al. 1998, ApJ 498, 579
- (52) Genzel, R., Cesarsky, C.J. 2000, ARA&A 38, 761
- (53) Gispert, R., Lagache, G., Puget, J.L. 2000, A&A 360, 1
- (54) Haas, M., Klaas, U., Müller, S.A.H., Chini, R., Coulson, I. 2001, A&A 367, L9
- (55) Hasinger, G., Altieri, B., Arnaud, M., et al. 2001, A&A 365, L45
- (56) Hauser, M.G., Arendt, R.G., Kelsall, T., et al. 1998, ApJ 508, 25
- (57) Helou, G., Khan, I.R., Malek, R., Boehmer, L. 1988, ApJS 68, 151
- (58) Hornschemeier, A.E., Brandt, W.N., Garmire, G.P., et al. 2001, ApJ 554, 742
- (59) Hughes, D. H., Gear, W.K., Robson, E.I. 1994, MNRAS 270, 641
- (60) Hughes, D. H., Serjeant, S., Dunlop, J., et al. 1998, Nature 394, 241
- (61) Ikebe, Y., Leighly, K., Tanaka, Y., et al. 2000, MNRAS 316, 433
- (62) Jones, A.P., d’Hendecourt, L. 2000, A&A 355, 1191
- (63) Kennicutt, R.C.Jr 1998, ARA&A 36, 189
- (64) Kessler, M., Steinz, J., Anderegg, M., et al. 1996, A&A 315, L27
- (65) Klaas, U., Haas M., Heinrichsen, I., Schulz, B. 1997, A&A 325, L21
- (66) Lagache, G., Abergel, A., Boulanger, F., Desert, F.-X., Puget, J.-L. 1999, A&A 344, 322
- (67) Lagache, G., Haffner, L.M., Reynolds, R.J., Tufte, S.L. 2000, A&A 354, L247
- (68) Laurent, O., 1999, PhD thesis, Université de Paris XI.
- (69) Laurent, O., Mirabel, I.F., Charmandaris, V., et al. 2000, A&A 359, 887
- (70) Le Floc’h, E., Mirabel, I.F., Laurent, O., et al. 2001, A&A 367, L487
- (71) Léger, A., Puget, J.L., 1984, A&A 137, L5
- (72) Lemke, D., Klaas, U., Abolins, J., et al. 1996, A&A 315, L64
- (73) Lilly, S.J., Lefévre, O., Hammer, F., Crampton, D. 1996, ApJ 460, L1
- (74) Madau, P., Pozzetti, L. 2000, MNRAS 312, L9
- (75) Matsuhara, H., Kawara, K., Sato, Y., et al. 2000, A&A 361, 407
- (76) Metcalfe, L. 2000, In “The Extragalactic Infrared Background and its Cosmological Implications”, IAU symposium 204, p.18
- (77) Meurer, G.R., Heckman, T.M., Calzetti, D., 1999, ApJ 521, 64
- (78) Meurer, G.R., Heckman, T.M., Seibert, M., et al. 2000, To appear in Proc. JD9, IAU Manchester 2000, ‘Cold Gas and Dust at High Redshift’ ed. D.J.Wilner, Highlights of Astronomy Vol. 12. PASP (astro-ph/0011201)
- (79) Mirabel, I.F., Vigroux, L., Charmandaris, V., et al. 1998, A&A 333, L1
- (80) Moutou, C., Verstraete, L., Léger, A., Sellgren, K., Schmidt, W. 2000, A&A 354, L17
- (81) Okumura, K., 1998, ESA ISOCAM PSF Report, www.iso.vilspa.esa.es/users/expllib/CAM/psfrep.ps.gz
- (82) Pozzetti, L., Madau, P., Zamorani, G., Ferguson, H.C., Bruzual, G.A. 1998, MNRAS 298, 1133
- (83) Pozzetti, L., Madau, P. 2001, In “The Extragalactic Infrared Background and its Cosmological Implications”, IAU Symposium 204, eds. M.Harwit and M.G.Hauser (astro-ph/0011359)
- (84) Puget, J.-L., Léger, A., 1989, ARA&A 27, 37
- (85) Puget, J.L., Abergel, A., Bernard, J.P., et al. 1996, A&A 308, L5
- (86) Puget, J.L., Lagache, G., Clements, D., et al. 1999, A&A 345, 29
- (87) Puget, J.L., Lagache, G. 2001, In “The Extragalactic Infrared Background and its Cosmological Implications”, IAU Symposium 204, eds. M.Harwit and M.G.Hauser, p.19 (astro-ph/0101105)
- (88) Renault, C., Barrau, A., Lagache, G., Puget, J.-L. 2001, A&A 371, 771
- (89) Richards, E.A. 2000, ApJ 533, 611
- (90) Rigopoulou, D., Spoon, H.W.W., Genzel, R., et al. 1999, AJ 118, 2625
- (91) Roussel, H., Vigroux, L., Bosma, A., et al. 2001, A&A 369, 473
- (92) Rush, B., Malkan, M.A., Spinoglio, L. 1993, ApJS 89, 1
- (93) Sanders, D.B., Mirabel, I.F. 1996, ARA&A 34, 749
- (94) Serjeant, S., Oliver, S., Rowan-Robinson, M., et al. 2000, MNRAS 316, 768
- (95) Silva, L., Granato, G.L., Bressan, A., Danese, L. 1998, ApJ 509, 103
- (96) Smail, I., Ivison, R.J., Blain, A.W., Kneib, J.-P. 2001, MNRAS in press (astro-ph/0112100)
- (97) Smith, C.H., Aitken, D.K., & Roche, P.F. 1989, MNRAS 241, 425
- (98) Soifer, B.T., Sanders, D.B., Madore, B.F., et al. 1987, ApJ 320, 238
- (99) Stanev, T., Franceschini, A. 1998, ApJ 494, L159
- (100) Steidel, C.C., Adelberger, K.L., Giavalisco, M., Dickinson, M., Pettini, M. 1999, ApJ 519, 1
- (101) Telesco, C.M., Becklin, E.E., Wynn-Williams, C.G., Harper, D.A. 1984, ApJ 282, 427
- (102) Tran, Q.D., Lutz, D., Genzel, R., et al. 2001, ApJ 552, 527
- (103) Xu, C., Hacking, P.B., Fang, F., et al. 1998, ApJ 508, 576
- (104) Xu, C. 2000, ApJ 541, 134
- (105) Xu, C., Lonsdale, C.J., Shupe, D.L., O’Linger, J., Masci, F. 2001, ApJ 562, 179
- (106) Vigroux, L., Mirabel, F., Altieri, B., et al. 1996, A&A 315, L93
- (107) Wilman, R.J., Fabian, A.C., Nulsen, P.E.J. 2000, MNRAS 319, 583
- (108) Wright, E.L. 2000, ApJ 553, 538
- (109) Wright, E.L., Reese, E.D. 2000, ApJ 545, 43
- (110) Yun, M.S., Reddy, N.A., Condon, J.J. 2001, ApJ 554, 803