THE SMALLEST MASS RATIO YOUNG STAR SPECTROSCOPIC BINARIES
Abstract
Using high resolution near-infrared spectroscopy with the Keck telescope, we have detected the radial velocity signatures of the cool secondary components in four optically identified premain-sequence, single-lined spectroscopic binaries. All are weak-lined T Tauri stars with well-defined center of mass velocities. The mass ratio for one young binary, NTTS 1609051859, is M2/M1 0.180.01, the smallest yet measured dynamically for a premain-sequence spectroscopic binary. These new results demonstrate the power of infrared spectroscopy for the dynamical identification of cool secondaries. Visible light spectroscopy, to date, has not revealed any premain-sequence secondary stars with masses 0.5 M⊙, while two of the young systems reported here are in that range. We compare our targets with a compilation of the published young double-lined spectroscopic binaries and discuss our unique contribution to this sample.
1 Introduction
The most important characteristic of a star is its mass. Although there have been recent advances in determining the masses of 12 M⊙ premain-sequence (PMS) stars, there exist only a few measurements of the masses of sub-solar mass PMS stars (Simon, 2000). As a result, theoretical PMS evolutionary tracks have not been well calibrated at the low-mass end where uncertainties in the models give rise to scatter as large as a factor of 3 in mass and 10 in age (Simon et al., 2000). Dynamical measurements of the masses of close binary systems comprised of coeval components with a small mass ratio provide an initial step towards tests of the PMS tracks over a broad parameter range.
In the last decade, much progress has been made towards determining the masses of PMS stars. Ghez et al. (1995), Simon et al. (1996), and Steffen et al. (2001) take advantage of near-infrared (IR) speckle interferometry and the fine guidance sensors available on the HST to map the orbits of young binary systems. Using optical wavelength (5000 Å) spectroscopy, Mathieu et al. (1989) and Mathieu (1994) identified twelve young, low-mass, double-lined spectroscopic binaries (SB2s) and thirteen single-lined systems (SB1s). Following this seminal work, other groups have recently detected new PMS spectroscopic binary systems. We discuss the sample of published SB2s in §5.
Our immediate goal is to measure mass ratios and to enlarge the sample to study the mass ratio distribution of young stars formed in diverse environments. Precise measurements of the mass ratio distribution among young star spectroscopic systems provide critical input for theories of star formation. For example, Bate (2000) shows how the density profiles of progenitor molecular cloud cores determine the distribution of mass ratios in the close ( 1 AU) binary population which forms there. Absolute masses can be obtained from SB2s which are eclipsing or from SB2s with known orbital elements determined from high resolution mapping of the binary orbits (e.g., Boden et al. 1999).
SB2s identified by optical wavelength observations tend to have mass ratios close to one. As first described in Prato (1998) and further developed in Mazeh et al. (2001), our approach to detecting low mass ratio systems is based on the strategy that, at IR wavelengths, the flux of the secondary star is a greater fraction of the total flux than at optical wavelengths. For example, for two blackbodies of temperatures 5000 and 3000 K, the ratio of the Planck functions at 5000 Å is about 50, whereas at 1.555 m, the ratio is about 4. Mazeh et al. (2001) demonstrate the efficacy of this technique, applied to three main-sequence SB1s. Mazeh et al. (1997) used an intermediate approach, detecting main-sequence binaries with mass ratios of and in the band. With the advent of powerful cross-dispersed echelle spectrometers, such as NIRSPEC on the Keck telescope, the IR approach has become even more efficient.
In this paper we describe new observations of four PMS SB1s for which we have detected the low mass companion by cross-correlation against an extensive new library of spectral type standard star templates. The observations and data reduction methods are described in §2, the template spectra are presented in §3 and the derived dynamical mass ratios are discussed in §4. Section 5 provides a discussion of the results, including a comparison with the complete sample of previously published SB2s and a comparison of our mass ratios with the predictions of evolutionary tracks in the HR diagram. A summary appears in §6. Previous reports on applications of this technique have appeared in Prato (1998), Steffen et al. (2001), and Mazeh et al. (2001).
2 Observations and Data Reduction
2.1 Observations
2.1.1 NIRSPEC Observations
Spectra of the target objects were obtained in 2000 June and July and in 2001 January and June; specific dates and target properties appear in Table 1. We used NIRSPEC, the W. M. Keck Observatory’s cross-dispersed near-IR cryogenic spectrometer (McLean et al., 1998, 2000). NIRSPEC’s spectroscopic detector is a 1024 1024 ALADDIN III InSb array that is sensitive from 0.955.5 m. In high resolution mode, NIRSPEC yielded a measured spectral resolution of R 24,000 in 9 orders across the band, centered at m in order 49. Experience has shown that this spectral region contains lines useful for the characterization of stars ranging from spectral types of early G through late M, and is reasonably free from terrestrial absorption lines (Prato, 1998; Mazeh et al., 2001).
The plate scale is 0.′′144/pixel in the dispersion direction, and 0.′′193/pixel in the cross-dispersion direction, and the two pixel slit width was 0.′′288. A 15′′ nod along the slit enabled us to obtain sequential spectra at two positions on the detector for background subtraction. NIRSPEC’s slit-viewing camera allowed simultaneous monitoring and correction of the object’s position on the slit during the spectroscopic exposure. Integration times for a single exposure varied from 60 to 600 s, depending on the source brightness. Multiple flat and dark frames were median filtered and the results differenced and normalized to create a final flat field.
Internal Ne, Ar, Xe and Kr arc lamps usually provided wavelength scale calibration and dispersion solutions. OH night sky lines, with identifications from Rousselot et al. (2000), were also used. A comparison of the night sky line and arc lamp line calibrations for the 2000 July data showed no difference, but the differences in the 2001 June data between the two calibrations was as much as 5 pixels. This drift of the grating position over time on that occasion was attributable to vibration caused by the image rotator mechanism inside of NIRSPEC. Observations in the adaptive optics (AO) mode (§2.1.2) were never affected by grating position drifts since the AO system provides external compensation for field rotation and NIRSPEC’s internal rotator is not used.
2.1.2 NIRSPEC Adaptive Optics Observations
Because NTTS 1559132233 is a hierarchical triple, with a tertiary component located at a 0.′′29 separation (Ghez et al., 1993), the 2000 June observations were taken with NIRSPEC behind the Keck II facility AO system (Wizinowich et al., 2000). Magnification by the AO reimaging optics alters the plate scale, resulting in pixels a factor of 10.6 times smaller. Correspondingly, the two pixel slit width becomes 0.′′027. The measured spectral resolution behind the AO system is higher by about 25 %, yielding . The NTTS 1559132233 tertiary was easily resolved with no overlap of the components’ FWHM 0.′′06 point spread functions. High resolution images, taken immediately before or after the spectroscopic integrations, indicated that the Strehl ratio was typically 0.25 in the band. In AO mode, the slow input beam and plane parallel window produce a Fabry-Perot type fringing pattern which contaminates the observed spectra. A notch or Hanning filter successfully removed most of this artifact during data reduction.
2.2 Data Reduction
Two approaches were used for the data reduction. At Stony Brook, we extracted the spectra using software originally written by Prato (1998) and adapted to the format of the NIRSPEC spectra. At UCLA, spectra were extracted using software developed by S. S. Kim, L. Prato, and I. McLean. Comparison of extractions of the same object by the two different approaches yielded spectra that were indistiguishable; the locations of the spectral lines were identical to within km s-1. Order 49 had no detectable terrestrial absorption lines, as expected from prior experience and inspection of the infrared solar atlas (Livingston & Wallace, 1991) and order 50 displayed only a few weak terrestrial lines. Unfortunately, orders 51, 52, and 53 contained so many strong absorption lines as to be unusable. The atmospheric contamination in orders 4548 was intermediate between these extremes. We used only the spectra in order 49, and confirmation from the spectra in order 50, for the results reported in this paper.
3 Template Spectra
To search for the presence of the secondary in the target spectra, an extensive new suite of template standard star spectra were required. Table 2 lists the 23 main-sequence stars observed for this purpose. The spectral type appears in column (2), as provided by the Centre de Donneés astronomiques de Strasbourg (SIMBAD). Column (3) lists the Julian Date of the observation and column (4) the derived radial velocity (Mazeh et al., 2001). All but 8 of the template stars have radial velocities measured by the Geneva (Duquennoy & Mayor, 1991) or CfA groups (Latham, 1985). The average difference between the radial velocities we measured and those of Duquennoy & Mayor (1991) and Latham (1985) is km s-1. We therefore adopt km s-1 as an estimate of the systematic uncertainty between the zero-points of the velocities we shall derive for the components of spectroscopic binaries we observed and their center-of-mass () velocities derived by others.
The excellent sensitivity, resolution, and spectral range obtained with NIRSPEC are demonstrated in Figure 1, where the 23 band template spectra for order 49 are plotted with corrections for heliocentric motion and radial velocity applied. The continuum has been flattened. The correlation coefficient resulting from cross-correlation of two template spectra against each other provides a measure of the stars’ similarity. The template spectra have been arranged, in Figure 1 and in Table 2, in order of decreasing mutual correlation, from hottest to coldest. HD 283750 and GL 275.2A appear out of order with respect to their spectral types, K2 and M4, respectively, as given in SIMBAD. For HD 283750, the discrepancy is only 3 spectral sub-classes, however, GL 275.2A has been incorrectly classified as an M4. Its IR spectrum is obviously that of a K star.
Based on Poisson statistics, the signal to noise ratio of the spectra shown in Figure 1 is typically greater than 100; most of the observed features are real. The G through early M type standard star spectra are dominated by atomic lines, predominantly Fe I, Ni I, Si I, and Ti I. Beginning around spectral type K5, OH lines appear and increase in depth. A pronounced transition is evident between the M3 and M4 subclasses; the earlier type standards generally show a clearly definable continuum, whereas objects later than M3, dominated by water features, do not display any region clear of lines from which a continuum might be definitively characterized. In addition to H2O, late M star spectra in this region contain strong OH lines and the CO 3 bandhead at 1.558 m.
4 Results
We selected the targets for our study from the sample of SB1s described by Mathieu (1994) and here report on the results for four systems, NTTS 1559132233, NTTS 1609051859, Parenago 1771, and Parenago 1925; observations of other systems are still in progress. A summary of the properties of the four target SBs appears in Table 1. Each of these binaries was detected as an X-ray source by the Einstein observatory (Ku et al., 1982; Walter, 1986; Mathieu et al., 1989; Gioia et al., 1990); all are weak-lined T Tauri stars with deep photospheric absorption lines. The velocities have already been well determined, from optical observations, for these four systems (Mathieu, 1994). Figure 2 shows representative order 49 spectra of the targets as observed without correction for heliocentric velocity. The continuum has been flattened for each spectrum.
We analyzed the spectra, following the procedure described in Mazeh et al. (2001), with the TODCOR algorithm, which uses a two-dimensional cross-correlation for the analysis of composite spectra (Zucker & Mazeh, 1994). Table 3 presents the results for each target: columns (1) and (2) list, respectively, the Julian date and the orbital phase of the observation. TODCOR analysis identifies the templates that provide the best fit to the primary and secondary, their velocities, and , given in columns (3) and (4) of Table 3, and an estimate of their flux ratio (see Table 4). The velocity is known for our targets from prior analysis as SB1s (Mathieu, 1994), so the mass ratio of the components, , column (5) of Table 3, follows from their velocities relative to , (Mazeh et al., 2001). Values for appear at the top of each section of Table 3 adjacent to the target names. For all 4 of our targets, the velocities listed in Table 3 are the averages of the analyses of order 49 using different template stars. Preliminary results from order 50 were consistent with these. The errors in the component star velocity determinations were propagated to determine a final uncertainty in the mass ratio.
4.1 NTTS 1559132233
This NTTS is a hierarchical triple, consisting of an SB with a period of 2.42 days and a tertiary component located at 0.′′29 separation (Mathieu et al., 1989; Ghez et al., 1993; Walter et al., 1994). Our observations of this multiple were obtained using the AO system to separate the SB and the tertiary. TODCOR analysis identified GL1094, rotationally broadened to 15 km s-1, as the best-fitting template for the primary. Its spectral type, K5, agrees with the determination of Mathieu et al. (1989) for the SB seen in visible light (Table 1). GL436, also rotationally broadened to 15 km s-1, provided the best fit to the secondary, with a flux ratio of 0.39 0.03 for two of the observations. On UT 2000 June 11, however, TODCOR identified a flux ratio of 0.79 0.03, although the mass ratio was identical. Since NTTS 1559132233 has a relatively short period and the components are probably only a few solar radii apart, the stars potentially fill their Roche lobes (Mathieu et al., 1989), and hence are perhaps distorted, producing variation in their flux ratio with phase.
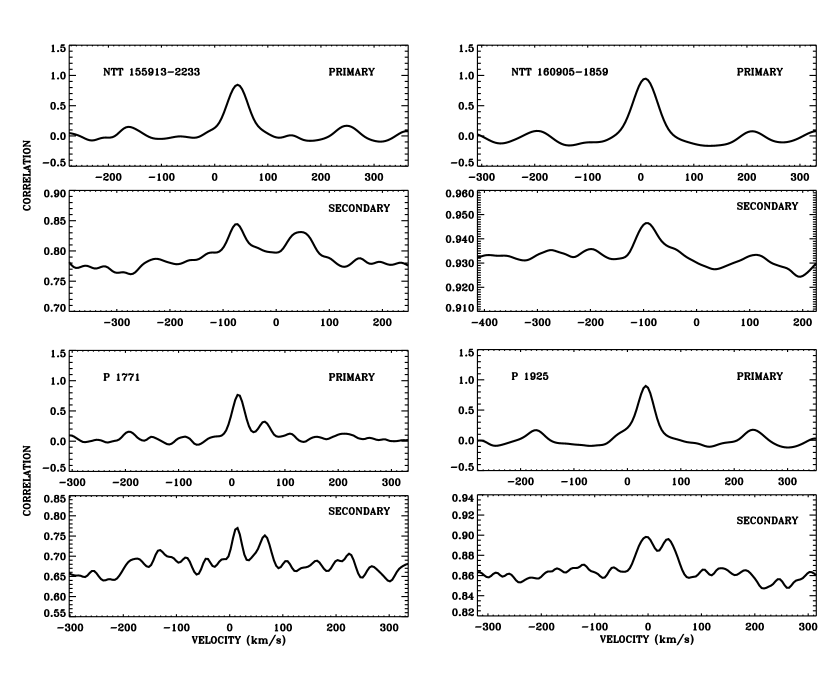
The upper left two panels of Figure 3 are cuts through the two-dimensional correlation function, results of the 2000 June 6 data TODCOR analysis. The primary and secondary correlation peaks, located at and km s-1, upper and lower panels, are clearly seen. The correlation plot for the secondary also shows a residual bump at km s-1, the result of the imperfect match of the primary template to the primary of NTTS 1559132233. Table 3 lists the component velocities measured in our three observations of the system. The derived mass ratio, using the velocity measured by Mathieu et al. (1989), is . This value is the average of two independent observations of the system. The value of q in parenthesis has a large uncertainty because it was measured when the component velocities were near the velocity. Therefore, we did not include it in the average.
4.2 NTTS 1609051859
The maximum correlation was obtained for NTTS 1609051859 using the K2 star HD 283750, rotationally broadened to 25 km s-1, as the primary template. This spectral type is consistent with the determination of Mathieu et al. (1989) for the primary. For our highest signal to noise spectra, obtained without the AO system, the TODCOR correlation was maximized by using GL 402, an M4, as the secondary template, also broadened to 25 km s-1. An average flux ratio of was derived. The range of flux ratios found with different templates and derived from distinct observations was 0.15 0.35. Because of the lower throughput and hence signal to noise ratio in the AO measurements, it was not possible to extract secondary star velocities from these data. The upper right panels of Figure 3 show the results of the correlation analysis of the UT 2001 June 2 data. Table 3 summarizes the measured velocities. The ratio derived using the velocity from Mathieu et al. (1989) is , the lowest yet measured for a PMS spectroscopic binary.
4.3 Parenago 1771
GL1094, rotationally broadened to 15 km s-1, gave the largest correlation as the primary of Parenago 1771. Its designated spectral type is K5, in good agreement with the K4 type given for the SB1 by Mathieu (1994). GL436, broadened to 15 km s-1, with an average flux ratio of 0.26 with respect to the primary, gave the best correlation for the secondary. For different templates, the range of flux ratios was 0.22 0.32. The lower left hand plots in Figure 3 show the correlation for the primary (upper panel) and secondary using the order 49 spectra. In the lower panel, the correlation peaks for the secondary at km s-1 and for the residual of the primary at km s-1 are nearly equal in amplitude, the result of an imperfect match between the main-sequence primary template and the primary in this PMS binary. The derived mass ratio is . It is necessary to confirm this mass ratio because it is based on only one observation.
4.4 Parenago 1925
TODCOR analysis of the Parenago 1925 system identified HD 283750 and GL669B, each rotationally broadened to 10 km s-1 and with an average flux ratio , as the best fitting primary and secondary. For different templates, the range of flux ratios was 0.12 0.35. The assigned spectral type of HD 283750 is K2, in good agreement with the classification by Mathieu (1994) of the primary as a K3. The lowest right panel of Figure 3 clearly shows the correlation maximum associated with the secondary, but also shows a comparable residual peak associated with the primary. The mass ratio in this system is . As for Parenago 1771, since this result is based on only one observation it must be confirmed.
5 Discussion
To illustrate the sensitivity of the IR technique, Figure 4 combines our sample with the IR detected SB2 NTTS 045251+3016 (Steffen et al., 2001) and 26 optical wavelength detected SB2s. From Figure 4 it is evident that the small sample presented in this paper includes the lowest mass ratios ever measured for PMS SB2s. Table 4 lists the entire sample of PMS SB2s plotted in Figure 4, including the location of the binaries, column (2), their mass ratios, periods, flux ratios, and primary masses (see below), in columns (3), (4) (5), and (6), and the references used for these data, column (7).
Figure 4 displays the well-known bias of SB2s detected in visible light toward mass ratios of one. Our results start to fill in the low mass ratio part of the observed distribution. A concentrated effort to observe a complete sample of SBs will be required to determine the true distribution of PMS SB2 mass ratios. It is interesting to notice (Table 4) that the five SB2s contributed so far by the IR technique span the same range of periods identified among the optically detected SB2s. A complete sample of SB2s will therefore enable tests of theoretical predictions of the mass ratio distribution as a function of binary separation (e.g., Bate and Bonnell 1997).
High angular resolution imaging studies of young binaries reveal a broad range of component mass ratios, down to the regime of brown dwarfs, as inferred photometrically by comparing the location of the binary components in the HR diagram with PMS evolutionary tracks (White et al., 1999; White & Ghez, 2001; Woitas et al., 2001). However, differences among the theoretical calculations of PMS evolution produce considerable scatter among the inferred mass ratios (e.g., Figure 7 of Woitas et al. 2001). Dynamical measurements offer the means to determine the mass ratios and their distribution precisely and thus to test specific predictions of calculations of binary formation (e.g., Bate 2000).
Except for the eclipsing systems, indicated in Table 4, and the spatially resolved NTTS 0455251+3016 (Steffen et al., 2001), we cannot derive dynamical values for the component masses of the SB2s in Figure 4 because their orbital inclinations are not yet known. In order to compare our IR SB2 secondary masses with their minimum values set by the mass function, and to learn the mass range currently sampled by dynamical techniques, we estimate the primary masses, and thus M2 using the dynamical mass ratios (Table 5). The procedure we use to obtain M1 is described in detail in Appendix A. The M1 values for the entire SB2 sample are included in Table 4, column (6).
For the 4 IR SB2s described in this paper, columns (3), (4), and (7) of Table 5 provide estimates for M1, M2, and the minimum mass, M, derived by setting the orbital inclination to in the mass function f(M) of Mathieu (1994), column (6). The uncertainties in M2 and M include the uncertainties in the mass ratio and in our estimate of M1. In all cases, M2 is consistently greater than its predicted minimum value.
In Figure 5 we plot mass ratio as a function of estimated M1. Figure 5 shows that smaller secondary masses, as well as smaller mass ratios, are more readily identified with IR spectroscopy; all the companions detected by the IR technique have M2 1 M⊙. In general, few primary star masses less than 1 M⊙ and no primary star masses less than 0.7 M⊙ have been detected in PMS SB2s. This is illustrated by the gap on the left hand side of Figure 5 and is probably the result of a selection effect for brighter systems among SB surveys. The total sample shown in Figure 5 is weighted towards PMS stars with little or no circumstellar material, although spanning a wide range of ages, from 105 yr through 107 yr. Young stars which lack circumstellar envelopes and disks do not experience veiling of their photospheric absorption lines, and hence provide easier targets for the identification of spectroscopic binaries.
The essential result of TODCOR analysis is the mass ratio of the components. This value is robust because it is determined by cross-correlation of the many spectral lines in common between the target and templates. The analysis also provides estimates of the primary and secondary spectral types and their band flux ratio, which give the maximum correlation with the target. The templates almost certainly do not match exactly to the spectra of the stars in the target binaries because the surface gravities of PMS stars are lower than those of main-sequence stars, and because the templates and the PMS targets may differ in metallicity. Similarly, band flux ratios do not necessarily represent accurate component luminosity ratios. Nonetheless, it is of interest to investigate the extent to which the values of implied by our dynamical results are consistent with PMS evolutionary tracks in the HR diagram, presented in Figure 6.
Our approach to estimating the effective temperature, Teff, and luminosity for each object, and the associated uncertainties, is described in Appendix B. We use the tracks of Palla & Stahler (1997) because they are representative of PMS evolution, similar to the results of Baraffe et al. (1998) and Siess et al. (2000), and span the range of masses of our sample objects. Figure 6 shows that, to within 1 , the secondary masses implied by the mass ratios (Table 5) are consistent with the secondary masses estimated from the tracks (column (5) of Table 5), except for Parenago 1925. Only for NTTS 1609051859 do the components lie on distinct isochrones; the other systems appear to be coeval to 1 . It will be possible to derive absolute, dynamical masses for these objects within the next decade as ground and space based interferometers become available for mapping their orbits. These mass determinations will be precise to within a few percent or less, a requirement for meaningful testing of models. Reliable luminosity estimates, however, cannot be obtained by dynamical means and will require not only spatially resolved observations, but also multi-wavelength data in order to obtain precise values.
6 Summary
We sucessfully observed 4 PMS SB1 systems using IR spectroscopy to find cool companion stars not detected at optical wavelengths. A suite of spectral type standard stars provided templates for cross-correlation analysis and yielded a spectral library of early G through late M type stars. We have identified the smallest mass ratio PMS SB2s yet observed, demonstrating the power of this approach. The binary components we have studied cover a large mass range, from 2 M⊙ primaries to 0.2 M⊙ secondaries.
To provide a comparison to our sample and a useful reference, we compiled as complete a list as possible of PMS SB2s and their main properties. We estimate primary masses of all known PMS SBs (Table 4) and qualitatively use these values, together with the precise mass ratios, in Figure 5 to illustrate the extremely low secondary star masses discovered with our IR observations. In addition, we place both components of the PMS SBs systems studied in our sample on the HR diagram to compare the evolutionary tracks with our dynamical results. To within 1 , most of these results are consistent, however, mass estimates based on placing the stars on the HR diagram are still approximate because the spectral types and luminosities of the component stars are incompletely characterized.
The application of optical wavelength spectrometers on 12 m class telescopes for the identification of SB1s, to be subsequently examined in the IR, is a practical technique for the measurement of large samples of PMS SB2s. Although such a study is magnitude limited, and thus does not sample the smallest mass primaries, the detection of SBs (not SB2s) is unbiased with respect to the mass ratio. We anticipate that, for a given star forming region, a complete survey of SBs at optical wavelengths with IR follow up for large mass ratio systems would provide the true mass ratio distribution for the smallest separation observable systems, to the limiting magnitude of the initial optical light survey. Because of the multiple epochs of observations required, as well as the limited time available at large telescopes, progress on this research is inevitably slow-paced. As we proceed with new confirmed observations, we plan to publish these results as they become available.
7 Acknowledgements
We thank the staff, observing assistants, and support scientists of the W. M. Keck Observatory for their logistical and technical help. We are grateful to R. Mathieu for providing orbital data in advance of publication, to C. Bender for producing Figure 1, to C. McCabe for helpful discussions, and to an anonymous referee for suggestions which improved our presentation. This research has made use of the SIMBAD database, operated at CDS, Strasbourg, France. This research was supported in part by NSF Grant 98-19694 (to MS), and by US-Israel Binational Science Foundation Grant No. 97-00460 and the Israel Science Foundation (to TM). Data presented herein were obtained at the W.M. Keck Observatory, which is operated as a scientific partnership between the California Institute of Technology, the University of California and NASA. The Observatory was made possible by the generous financial support of the W.M. Keck Foundation. The authors wish to extend special thanks to those of Hawaiian ancestry on whose sacred mountain we are privileged to be guests.
Appendix A Primary Mass Determinations for Figure 5
Primary masses for fourteen of the binaries in Table 4 were found in the literature (column 7). Among these, only for NTTS 045251+3016 (Steffen et al., 2001) is there a published value for the flux ratio. To obtain the primary masses for the remaining systems, we did the following. The total luminosity of the SB2 was obtained from the literature or calculated from the total band magnitude, as described in Simon & Prato (1995). The primary luminosity was then determined from the flux ratio, when available. Otherwise, if the mass ratio of an SB2 was within 3% of unity, a component bolometric luminosity ratio of 1.0 was assumed. For the remaining three SB2s, we used an approximate flux ratio based on the empirical mass ratio mK relation shown in Figure 5 of White & Ghez (2001).
For cases in which no component spectral type data was available, we assumed that the spectral type of the unresolved system was equal to the Teff of the primary. For the 4 systems described in this paper, we estimated Teff from the best fit primary star template (§4) and the spectral type to temperature conversion found in Luhman (2000) (see Appendix B).
Primary star masses were derived from the tracks of Palla & Stahler (1999) and Baraffe et al. (1998) for the lower mass objects. Objects plotted on both sets of tracks usually had comparable masses to within 10 %; for consistency we used Palla & Stahler (1999) for all estimates. We estimate that the uncertainties in the primary masses determined from the HR diagram and listed in Table 4 are about 10%.
Appendix B Teff and Luminosity Estimates for Figure 6
Spectral types for the 8 individual stars in our SBs sample were determined from the spectral types of the templates which gave the maximum correlation. Because of the caveats in the accuracy of this approach (see §5) we assigned an uncertainty to these results of two spectral subclasses for secondary stars. In all cases the primary star spectral types derived from the TODCOR analysis were the same as previous estimates of the spectral types for these stars, or else within one spectral subclass. Therefore, we assigned a one subclass uncertainty to the primary star spectral types. Typically the same component velocities were determined using a range of template spectral types. To convert to Teff, we used Figure 5 of Luhman (2000).
To derive component luminosities we used the 1.555 m flux ratio found by TODCOR and applied this proportionately to the total luminosity. For the PMS stars of the age and mass range considered here, their band flux is approximately proportional to their luminosity. We estimate one source of uncertainties from the range of flux ratios produced by TODCOR for different templates (see §4). For example, for Parenago 1771, an M3 template gave the best correlation for the secondary star, yielding a velocity of 64.5 1.5 km s-1 (Table 3). An M7 template yielded only a 1 % difference in velocity, yet a 25 % difference in the flux ratio. Thus, although the determination of the velocity is robust, the characterization of the flux and hence luminosity ratio is uncertain. Because these error estimates are approximate, we use a 15 % distance uncertainty, or else the uncertainty produced by the range in flux ratios, whichever is larger.
Other sources of error might arise from the proximity of the stars in very short period SBs, which may distort their structure. The light ratio variation (§4.1) detected in NTTS 1559132233 (period 2.4 days) may indicate this effect. Such systems are likely to be less useful for tests of the PMS evolutionary tracks.
References
- Alcalá et al. (2000) Alcalá, J. M., Covino, E., Torres, G., Sterzik, M. F., Pfeiffer, M. J., & Neuhäuser, R. 2000, A&A, 353, 186
- Baraffe et al. (1998) Baraffe, I., Chabrier, G., Allard, F., and Hauschildt, P. H. 1998, A&A, 337, 403
- Bate (2000) Bate, M. R. 2000, MNRAS, 314, 33
- Bate & Bonnell (1997) Bate, M. R., & Bonnell, I. A. 1997, MNRAS, 285, 33
- Boden et al. (1999) Boden, A. F., et al. 1999, ApJ, 527, 360
- Corporon et al. (1996) Corporon, P., Lagrange, A. M., & Beust, H. 1996, A&A, 310, 228
- Covino et al. (2000) Covino, E., et al. 2000, A&A, 361, L49
- Covino et al. (2001) Covino, E., Melo, C., Alcalá, J. M., Torres, G., Fernández, M., Frasca, A., & Paladino, R. 2001, A&A, 375, 130
- Duquennoy & Mayor (1991) Duquennoy A., & Mayor, M. 1991, A&A, 248, 485
- Ghez et al. (1993) Ghez, A. M., Neugebauer, G., & Matthews, K. 1993, AJ, 106, 2005
- Ghez et al. (1995) Ghez, A. M., Weinberger, A. J., Neugebauer, G., Matthews, K., & McCarthy, D. W., Jr. 1995, AJ, 110, 753
- Gioia et al. (1990) Gioia, I. M., et al. 1990, ApJS, 72, 567
- Guenther et al. (2001) Guenther, E. W., Torres, G., Batalha, N., Joergens, V., Neuhäuser, R., Vijapurkar, J., & Mundt, R. 2001, A&A, 366, 965
- Ku et al. (1982) Ku, W. H.-M., Righini-Cohen, G., & Simon, M. 1982, Science, 215, 61
- Latham (1985) Latham, D. W. 1985, in Stellar Radial Velocities, IAU Colloq. 88, eds. A.G.D. Philip and D.W. Latham (Schenectady: Davis Press), p. 21
- Lee et al. (1994) Lee, C. W., Martín, E. L., & Mathieu, R. D. 1994, AJ, 108, 1445
- Livingston & Wallace (1991) Livingston, W., & Wallace, L. 1991, An Atlas of the Solar Spectrum in the Infrared from 1850 to 9000 cm-1, (NOAO:Tucson)
- Luhman (2000) Luhman, K. L. 2000, ApJ, 544, 1044
- Mathieu et al. (1989) Mathieu, R.D., Walter, F.M., & Myers, P.C. 1989, AJ, 98, 987
- Mathieu (1994) Mathieu, R.D. 1994, ARA&A, 32, 465
- Mathieu et al. (1997) Mathieu, R.D., Stassun, K., Basri, G., Jensen, E. L. N., Johns-Krull, C. M., Valenti, J. A., Hartmann, L. W. 1997, AJ, 113, 1841
- Mazeh et al. (1997) Mazeh, T., Martín, E. L., Goldberg, D., and Smith, H. A. 1997, MNRAS, 284, 341
- Mazeh et al. (2001) Mazeh, T., Prato, L., Simon, M., Goldberg, E., Norman, D., & Zucker, S. 2001, ApJ, submitted
- McLean et al. (1998) McLean, I. S., et al. 1998, SPIE, 3354, 566
- McLean et al. (2000) McLean, I. S., et al. 2000, SPIE, 4008, 1048
- Padgett & Stapelfeldt (1994) Padgett, D. L., & Stapelfeldt, K. R. 1994, 107, 720
- Palla & Stahler (1999) Palla, F., & Stahler, S. W. 1999, ApJ, 525, 772
- Palla & Stahler (2001) Palla, F., & Stahler, S. W. 2001, ApJ, 553, 299
- Prato (1998) Prato, L. 1998, Ph.D. Thesis, SUNY Stony Brook
- Prato et al. (2001) Prato, L., et al. 2001, ApJ, 549, 590
- Quast et al. (2000) Quast, G. R., Torres, C. A. O., de La Reza, R., da Silva, L., & Mayor, M. 2000, in Birth and Evolution of Binary Stars, Poster Proc. from IAU Symp. 200, eds. B. Reipurth & H. Zinnecker, p. 28
- Rousselot et al. (2000) Rousselot, P., Lidman, C., Cuby, J.-G., Moreels, G., & Monnet, G. 2000, A&A, 354, 1134
- Simon et al. (2000) Simon, M., Dutrey, A., & Guilloteau, S. 2000, ApJ, 545, 1034
- Simon (2000) Simon, M. 2000, in Birth and Evolution of Binary Stars, Conference Proc. from IAU Symp. 200, eds. H. Zinnecker & R. D. Mathieu, p. 28
- Simon et al. (1996) Simon, M., Holfeltz, S. T., & Taff, L. G. 1996, ApJ, 469, 890
- Simon & Prato (1995) Simon, M., & Prato, L. 1995, ApJ, 450, 824
- Steffen et al. (2001) Steffen A., Mathieu, R.D., Lattanzi, M. G., Latham, D. W., Mazeh, T., Prato, L., Simon, M., & Zinnecker, H. 2001, AJ, 122, 997
- Torres et al. (1995) Torres, G., Stefanik, R. P., Latham, D. W., & Mazeh, T. 1995, ApJ, 452, 870
- Torres et al. (2000) Torres, G., Lacy, C. H. S., Claret, A., & Sabby, J. A. 2000, AJ, 120, 3226
- Walter (1986) Walter, F.M. 1986, ApJ, 306, 573
- Walter et al. (1994) Walter, F.M., Vrba, F. J., Mathieu, R. D., Brown, A., & Myers, P. C. 1994, AJ, 107, 692
- Welty (1995) Welty, A. D. 1995, AJ, 110, 776
- White et al. (1999) White, R.J., Ghez, A. M., Reid, I. N., & Schultz, G. 1999, ApJ, 520, 811
- White & Ghez (2001) White, R. J., & Ghez, A. M. 2001, ApJ, 556, 265
- Wizinowich et al. (2000) Wizinowich, P., et al. 2000, PASP, 112, 315
- Woitas et al. (2001) Woitas, J., Leinert, Ch., & Köhler, R. 2001, A&A, in press
- Zucker & Mazeh (1994) Zucker, S., & Mazeh, T. 1994, ApJ, 420, 806


| R.A. (2000.0) | Dec. (2000.0) | Htotal | Spectral | Period | UT Date and Mode | |
|---|---|---|---|---|---|---|
| Object | () | () | (mag)aaData from Mathieu et al. (1989). | TypeaaData from Mathieu et al. (1989). | (days)aaData from Mathieu et al. (1989). | of observation |
| Parenago 1771 | 05 35 09.75 | 05 23 26.8 | 9.6 | K4 | 149.5 | 2001 January 5 (AO) |
| Parenago 1925 | 05 35 18.34 | 05 22 37.7 | 8.6 | K3 | 32.94 | 2001 January 5 (AO) |
| NTTS 1559132233 | 16 02 10.5 | 22 41 29 | 8.2 | K5 | 2.42378 | 2000 June 7, 10, 11 (AO) |
| NTTS 1609051859 | 16 11 59.33 | 19 06 52.40 | 8.2 | K1 | 10.400 | 2000 June 9, 11 (AO) |
| 2000 July 14 (non-AO) | ||||||
| 2001 June 1, 2 (non-AO) |
| Spectral | Date (JD) | vrad | |
|---|---|---|---|
| Object | TypeaaAs given in the SIMBAD database. | 2450000+ | km s-1 |
| HD 196850 | G0 | 1715.05 | -21.7 |
| HD 4614 | G0 | 1917.75 | 8.3 |
| GL 160 | G1 | 1917.77 | 23.6 |
| HD 1835 | G3 | 1917.72 | -2.5 |
| HD 76151 | G2 | 1917.03 | 31.8 |
| BS 5019 | G5 | 1714.84 | -9.0 |
| BS 7368 | G8 | 1715.04 | -22.3 |
| GL 1094 | K5 | 1917.86 | -30.9 |
| GL 275.2A | M4 | 1917.08 | -3.9 |
| HD 283750 | K2 | 1916.90 | 39.6 |
| BS 8085 | K5 | 1703.03 | -67.1 |
| BS 8086 | K7 | 1707.13 | -65.0 |
| GL 763 | M0 | 1715.11 | -60.5 |
| GL 15A | M1.5 | 1707.14 | 12.2 |
| GL 436 | M2.5 | 1915.14 | 10.0 |
| GL 752A | M3 | 1705.03 | 37.4 |
| GL 213 | M4 | 1917.96 | 106.6 |
| GL 402 | M4 | 1915.04 | -1.1 |
| GL 669B | M4.5 | 1705.99 | -33.8 |
| LHS 292 | M6.5 | 1915.06 | 1.3 |
| GL 644C | M7 | 1943.17 | 15.0 |
| LHS 2351 | M7 | 1942.97 | -14.4 |
| LHS 2065 | M9 | 1942.94 | -8.4 |
| JD | ||||
|---|---|---|---|---|
| (2450000+) | Phase | (km s-1) | (km s-1) | q |
| Parenago 1771 km s-1 | ||||
| 1914.86 | … | |||
| Parenago 1925 km s-1 | ||||
| 1914.94 | … | |||
| NTTS 155913-2233 km s-1 | ||||
| 1702.96 | 0.22 | |||
| 1705.93 | 0.45 | |||
| 1706.92 | 0.86 | |||
| NTTS 160905-1859 km s-1 | ||||
| 1704.91 | 0.73 | … | … | |
| 1706.94 | 0.93 | … | … | |
| 1739.89 | 0.10 | |||
| 2061.95 | 0.07 | |||
| 2062.91 | 0.16 | |||
| Object | Location | q | P (days) | Flux Ratio | M1 (M⊙) | RefsaaReferences are for data used to estimate M1, not for discovery papers. |
|---|---|---|---|---|---|---|
| RX J0350.51355 | Orion | 0.92 | 9.28 | 0.82 | 2.1 | 1 |
| V773 Tau | Tau-Aur | 0.76 | 51.08 | … | 1.53 | 2 |
| V826 Tau | Tau-Aur | 0.98 | 3.91 | 1 | 0.8 | 3, 4 |
| RX J0441.00839 | Orion | 0.82 | 13.56 | 0.70 | 2.0 | 1 |
| DQ Tau | Tau-Aur | 0.97 | 15.8 | 1 | 0.7 | 5 |
| NTTS 045251+3016 | Tau-Aur | 0.56 | 2530 | 0.40bbFlux ratio is average of a range of values determined from use of several band templates in the cross-correlation analysis. See §4. | 1.45 | 6 |
| OriNTT 429 | Orion Belt | 1.0 | 7.46 | 1 | 1.5 | 4, 7, 8 |
| OriNTT 569 | Orion Belt | 1.0 | 4.25 | 1 | 1.1 | 4, 7, 8 |
| RX J0529.4+0041ccEclipsing systems. | Orion | 3.04 | 0.73 | … | 1.3 | 9 |
| RX J0530.70434 | Orion | 1.00 | 40.57 | 1.00 | 1.5 | 1 |
| RX J0532.10732 | Orion | 0.95 | 46.85 | 0.82 | 1.3 | 1 |
| Parenago 1540 | Trapezium | 0.76 | 33.73 | … | 1.71 | 2 |
| Parenago 1771 | Trapezium | 0.34 | 149.5 | 0.26bbFlux ratio is average of a range of values determined from use of several band templates in the cross-correlation analysis. See §4. | 1.4 | 4, 7, 10 |
| BM OriccEclipsing systems. | Trapezium | 0.40 | 6.5 | … | 6.3 | 2 |
| Parenago 1925 | Trapezium | 0.31 | 32.94 | 0.23bbFlux ratio is average of a range of values determined from use of several band templates in the cross-correlation analysis. See §4. | 2.3 | 4, 7, 8, 10 |
| Parenago 2494 | Trapezium | 0.71 | 19.48 | 0.4 | 2.1 | 4, 7, 8, 11 |
| Parenago 2486 | Trapezium | 0.96 | 5.19 | 0.9 | 1.4 | 4, 7, 8, 11 |
| RX J0541.40324 | Orion | 0.67 | 4.99 | 0.25 | 1.9 | 1 |
| GG OriccEclipsing systems. | Orion | 1.00 | 6.63 | … | 2.342 | 12 |
| W134 | NGC 2264 | 0.96 | 6.35 | … | 2.0 | 8, 13 |
| RS ChaccEclipsing systems. | Chameleon | 0.98 | 1.7 | … | 1.86 | 2 |
| HD 98800 B | TW Hya | 0.83 | 315.15 | … | 0.87 | 14, 15 |
| NTTS 1559132233 | Sco-Cen | 0.63 | 2.42 | 0.39bbFlux ratio is average of a range of values determined from use of several band templates in the cross-correlation analysis. See §4. | 1.0 | 4, 7, 10, 16 |
| RX J1603.83938 | Lupus | 0.93 | 7.56 | … | 1.0 | 17 |
| NTTS 1609051859 | Sco-Cen | 0.18 | 10.4 | 0.24bbFlux ratio is average of a range of values determined from use of several band templates in the cross-correlation analysis. See §4. | 1.2 | 4, 7, 10 |
| NTTS 1628142427 | Oph | 0.92 | 35.95 | … | 1.26 | 2 |
| AK Sco | Sco-Cen ? | 0.99 | 13.61 | 1 | 1.6 | 4, 7, 8 |
| HD 155555 | isolated | 0.93 | 1.68 | 0.8 | 1.1 | 4, 7, 8, 11 |
| V4046 Sgr | isolated | 0.94 | 2.42 | … | 0.86 | 18 |
| TY CrAccEclipsing systems. | Corona Australis | 0.52 | 2.89 | … | 3.16 | 2 |
| EK CepccEclipsing systems. | isolated | 0.55 | 4.43 | … | 2.03 | 2 |
References. — (1) Covino et al. 2001; (2) Palla & Stahler 2001; (3) Lee et al. 1994; (4) Luhman 2000; (5) Mathieu et al. 1997; (6) Steffen et al. 2001; (7) Mathieu 1994; (8) Palla & Stahler 1999; (9) Covino et al. 2000; (10) this work; (11) White & Ghez 2001; (12) Torres et al. 2000; (13) Padgett & Stapelfeldt 1994; (14) Torres et al. 1995; (15) Prato et al. 2001; (16) Walter et al. 1994; (17) Guenther et al. 2001; (18) Quast et al. 2001.
| M1bbFrom Table 4. | M2cc qM1 | M | f(M)ddFrom Mathieu (1994). | M | ||
|---|---|---|---|---|---|---|
| Object | qaaFrom Table 3. | (M⊙) | (M⊙) | (M⊙) | (M⊙) | (M⊙) |
| Parenago 1771 | 0.340.03 | 1.40.5 | 0.480.18 | 0.340.17 | 0.024 | 0.430.10 |
| Parenago 1925 | 0.310.04 | 2.30.6 | 0.710.21 | 0.150.22 | 0.011 | 0.440.08 |
| NTTS 1559132233 | 0.630.02 | 1.00.2 | 0.630.13 | 0.340.20 | 0.064 | 0.530.06 |
| NTTS 1609051859 | 0.180.01 | 1.20.2 | 0.220.04 | 0.160.21 | 0.0042 | 0.200.02 |