New UBVRI colour distributions in E-type galaxies
Abstract
New colour distributions have been derived from wide field UBVRI frames for 36 northern bright elliptical galaxies and a few lenticulars. The classical linear representations of colours against were derived, with some improvements in the accuracy of the zero point colours and of the gradients. The radial range of significant measurements was enlarged both towards the galaxy center and towards the outskirts of each object. Thus, the ”central colours”, integrated within a radius of 3 ″, and the ”outermost colours” averaged near the surface brightness could also be obtained. Some typical deviations of colour profiles from linearity are described. Colour-colour relations of interest are presented. Very tight correlations are found between the UV colour and the line-index, measured either at the galaxian center or at the effective radius.
Key Words.:
Galaxies: elliptical and lenticulars, CD – Galaxies: ISM1 Introduction
The ”classical” data on the large scale colour distributions of E-type galaxies relies on observations by Bender and Möllenhof (1987), Vigroux et al. (1988), Franx et al. (1989), Peletier et al. (1990), Goudfrooij et al. (1994), to quote only the papers discussing the 1-D profiles of colour against radius, as distinguished from studies of dust patterns. Most of these data were reconsidered by Michard (2000) (RM00), in an attempt to collect a significant sample of objects with a complete optical colour set, i.e. UB, BV, BR and VI in a coherent photometric system. This was adequate to confirm previous indications about the cause of colour gradients: these appear to be due essentially to population gradients within galaxies, with the dust playing no important role, except in galaxies with central intense dust patterns. Such objects are rather rare among the Es.
Similar to most spectral indices of stellar populations, the colours suffer from the well known age-metallicity degeneracy, and, except UB or UV, are not very sensitive to the two parameters. They are affected by dust, at least locally, or perhaps systematically in the central regions according to inferences based on a survey by Michard (1999) (RM99). On the other hand, they may be measured at lower surface brightnesses or larger radii than the line indices. They could therefore bring useful information to the study of fossil stellar populations, and further constraints upon models of the evolution of E galaxies. The present work aims to provide an enlarged sample of objects with complete colour data, extending farther in radius than in previous studies, and hopefully of improved accuracy.
In Paper I, we present the usual information about the observations and data reduction, and part of the results in tabular form. A larger set of results will be made available in electronic form. The frames, partly reduced, will be made available from the HYPERCAT database, Observatoire de Lyon.
In Paper II, under the assumption that the observed colour gradients reflect abundance variations along the radius, metallicity gradients will be computed from the present data, using new colour-metallicity calibrations derived from multi-population models for E-galaxies. These metallicity gradients allow an estimation of central and mean metallicities. Statistics of galaxies included in our sample indicate that mean metallicities are about solar, in agreement with the study by Trager et al. (2000) based on spectral indices.
Often used notations
-
•
isophotal radius; for an ellipse of semi-axis and .
-
•
colour gradient in UB; and similar for other colours.
-
•
diE, boE, unE: subclassification of E galaxies as disky, boxy and undetermined.
2 Observations
The observations were performed with the 120cm Newtonian telescope of the Observatoire de Haute-Provence, in three runs: April 1-11 2000, May 29-June 5 2000 and January 18-29 2001, noted below as run 1, 2 and 3. Tables 1 to 4 gives lists of the observed galaxies with some parameters relevant on the observing conditions. A CCD target Tek1024 is mounted in the camera, giving a field of view of 11.6x11.6 ′for a pixel size of 24 microns or 0.68 ″. The relatively large field is a favorable feature of this system for the observation of colour distributions in nearby galaxies. Less favourable are the rather poor seeing at the OHP, with the FWHM of star images usually in the 2-3″range, with values at 4 or more during periods of northern wind (mistral), and also the sky illumination by ever increasing urban lights.
The camera is unfortunately affected by the so-called ”red-halo” effect.
| NGC | Date | F | File | Exp | Sky | ||
|---|---|---|---|---|---|---|---|
| 2768 | 01/04/00 | U | t613 | 3000 | 21.50 | 2.32 | 2.14 |
| id | id | B | t614 | 600 | 21.71 | 2.22 | 2.11 |
| id | id | V | t615 | 300 | 20.59 | 2.14 | - |
| id | id | R | t616 | 240 | 19.93 | 2.29 | 2.14 |
| id | id | i | t617 | 240 | 18.86 | 2.36 | 2.15 |
| 2974 | 05/04/00 | U | t828 | 3000 | 20.75 | 5.10 | 4.10 |
| id | id | B | t830 | 600 | 21.47 | 4.63 | 4.05 |
| id | id | V | t829 | 300 | 20.54 | 4.04 | - |
| id | id | R | t831 | 240 | 20.11 | 4.58 | - |
| id | id | i | t832 | 240 | 18.47 | 4.23 | - |
| 3115 | 20/01/01 | U | p437 | 2400 | 20.45 | 5.28 | 3.96 |
| id | id | B | p438 | 600 | 21.35 | 4.12 | 3.74 |
| id | id | V | p439 | 300 | 20.44 | 3.81 | - |
| id | id | R | p440 | 200 | 19.93 | 3.86 | - |
| id | id | i | p441 | 160 | 18.74 | 3.78 | - |
| 3193 | 01/04/00 | U | t619 | 3000 | 21.09 | 3.11 | - |
| id | id | B | t620 | 600 | 21.60 | 3.23 | - |
| id | id | V | t621 | 300 | 20.78 | 3.26 | - |
| id | id | R | t622 | 240 | 20.03 | 2.90 | - |
| id | id | i | t623 | 240 | 19.27 | 2.75 | - |
| 3377 | 20/01/01 | U | p443 | 2300 | 21.10 | 3.64 | 2.81 |
| id | id | B | p444 | 600 | 21.72 | 3.02 | 2.69 |
| id | id | V | p445 | 300 | 20.72 | 2.73 | - |
| id | id | R | p446 | 200 | 20.16 | 2.80 | - |
| id | id | i | p447 | 160 | 18.85 | 2.76 | - |
| 3377 | 27/01/01 | U | p674 | 2500 | 20.73 | 3.62 | 2.75 |
| id | id | B | p675 | 600 | 21.45 | 2.96 | 2.67 |
| id | id | V | p676 | 250 | 20.47 | 2.70 | - |
| id | id | R | p677 | 160 | 29.96 | 2.78 | - |
| id | id | i | p678 | 130 | 18.68 | 2.71 | - |
| 3379 | 20/01/01 | U | p449 | 2500 | 21.28 | 3.96 | 2.90 |
| id | id | B | p450 | 600 | 21.86 | 3.29 | 2.84 |
| id | id | V | p451 | 250 | 20.89 | 2.91 | - |
| id | id | R | p452 | 160 | 20.32 | 3.11 | - |
| id | id | i | p453 | 130 | 19.07 | 2.99 | - |
| 3605 | 05/04/00 | U | t842 | 3000 | 21.16 | 4.62 | 4.05 |
| id | id | B | t843 | 600 | 21.73 | 4.13 | - |
| id | id | V | t844 | 300 | 20.76 | 3.93 | - |
| id | id | R | t845 | 240 | 20.35 | 3.78 | - |
| id | id | i | t846 | 240 | 19.35 | 3.88 | - |
| 3608 | 06/04/00 | U | t937 | 3000 | 21.04 | 3.44 | 2.71 |
| id | id | B | t938 | 600 | 21.77 | 2.90 | 2.71 |
| id | id | V | t939 | 300 | 20.79 | 2.82 | 2.67 |
| id | id | R | t940 | 240 | 20.29 | 2.79 | 2.74 |
| id | id | i | t941 | 240 | 19.25 | 2.69 | - |
| 3610 | 20/01/01 | U | p456 | 2500 | 21.39 | 2.99 | 2.49 |
| id | id | B | p457 | 600 | 21.99 | 3.11 | 2.51 |
| id | id | V | p458 | 250 | 21.07 | 2.71 | 2.44 |
| id | id | R | p459 | 160 | 20.49 | 2.51 | - |
| id | id | i | p460 | 130 | 19.21 | 2.75 | 2.43 |
| 3613 | 20/01/01 | U | p462 | 2500 | 21.25 | 3.58 | 2.43 |
| id | id | B | p463 | 600 | 21.92 | 3.16 | 2.25 |
| id | id | V | p464 | 250 | 20.90 | 2.42 | 2.11 |
| id | id | R | p465 | 160 | 20.26 | 2.16 | - |
| id | id | i | p466 | 130 | 19.03 | 2.20 | - |
| 3640 | 07/04/00 | U | t040 | 3000 | 20.68 | 3.00 | 2.14 |
| id | id | B | t041 | 600 | 21.27 | 2.29 | 2.14 |
| id | id | V | t042 | 300 | 20.40 | 2.14 | - |
| id | id | R | t043 | 240 | 20.04 | 2.22 | 2.18 |
| id | id | i | t044 | 240 | 19.06 | 2.26 | 2.09 |
| 3872 | 06/04/00 | U | t953 | 3000 | 21.03 | 2.89 | 2.36 |
| id | id | B | t954 | 600 | 21.68 | 2.49 | 2.43 |
| id | id | V | t955 | 300 | 20.70 | 2.38 | - |
| id | id | R | t956 | 240 | 20.17 | 2.49 | 2.37 |
| id | id | i | t957 | 240 | 19.18 | 2.67 | 2.43 |
| 4125 | 21/01/01 | U | p521 | 2500 | 20.07 | 2.13 | 1.93 |
| id | id | B | p522 | 720 | 21.08 | 2.14 | 1.94 |
| id | id | V | p523 | 420 | 19.85 | 1.97 | - |
| id | id | R | p524 | 280 | 18.47 | 2.48 | 1.98 |
| id | id | i | p525 | 250 | 17.40 | 2.11 | 2.00 |
| 4261 | 21/01/01 | U | p527 | 2500 | 20.05 | 2.84 | 2.39 |
| id | id | B | p528 | 720 | 21.10 | 2.61 | 2.40 |
| id | id | V | p529 | 420 | 20.25 | 2.41 | - |
| id | id | R | p530 | 280 | 20.07 | 2.61 | 2.50 |
| id | id | i | p531 | 250 | 18.78 | 2.53 | 2.52 |
| 4278 | 25/01/01 | U | p600 | 2500 | 20.96 | 3.20 | 2.93 |
| id | id | B | p601 | 600 | 22.03 | 2.89 | - |
| id | id | V | p602 | 250 | 21.10 | 3.54 | 2.96 |
| id | id | R | p603 | 160 | 20.33 | 3.60 | 2.98 |
| id | id | i | p604 | 130 | 19.05 | 3.23 | 2.86 |
| 4365 | 25/01/01 | U | p606 | 2500 | 20.72 | 3.52 | 2.93 |
| id | id | B | p607 | 600 | 21.75 | 3.39 | 2.95 |
| id | id | V | p608 | 250 | 20.74 | 2.99 | - |
| id | id | R | p609 | 160 | 20.01 | 3.17 | 2.94 |
| id | id | i | p610 | 130 | 18.64 | 2.82 | - |
| 4374 | 01/04/00 | U | t629 | 3000 | 21.20 | 3.08 | - |
| id | id | B | t630 | 600 | 21.84 | 3.20 | - |
| id | id | V | t631 | 300 | 20.85 | 3.05 | - |
| id | id | R | t632 | 240 | 20.36 | 2.94 | - |
| id | id | i | t633 | 240 | 19.32 | 2.85 | - |
| 4387 | 05/04/00 | U | t856 | 3000 | 21.23 | 4.40 | - |
| id | id | B | t857 | 600 | 21.79 | 4.35 | - |
| id | id | V | t858 | 300 | 20.77 | 4.08 | - |
| id | id | R | t859 | 240 | 20.35 | 4.23 | - |
| id | id | i | t860 | 240 | 19.35 | 4.19 | - |
| 4406 | 30/05/00 | U | m606 | 2400 | 20.06 | 2.65 | 2.14 |
| id | id | B | m607 | 600 | 20.69 | 2.69 | 2.19 |
| id | id | V | m608 | 300 | 19.21 | 2.65 | 2.12 |
| id | id | R | m609 | 150 | 17.76 | 2.39 | 2.09 |
| id | id | i | m610 | 120 | 17.28 | 2.09 | - |
| 4406 | 31/05/00 | U | m616 | 2400 | 20.42 | 4.66 | 2.14 |
| id | id | B | m617 | 500 | 20.50 | 4.27 | 2.19 |
| id | id | V | m618 | 250 | 19.24 | 4.32 | 2.12 |
| id | id | R | m619 | 180 | 19.08 | 4.14 | 2.09 |
| id | id | i | m620 | 150 | 18.16 | 3.85 | 2.09 |
| 4472 | 07/04/00 | U | t053 | 3000 | 20.98 | 2.43 | 2.29 |
| id | id | B | t054 | 600 | 21.53 | 2.49 | 2.30 |
| id | id | V | t055 | 300 | 20.60 | 2.24 | - |
| id | id | R | t056 | 120 | 20.16 | 2.37 | - |
| id | id | i | t057 | 120 | 19.09 | 2.32 | - |
| 4473 | 29/05/00 | U | m571 | 2700 | 20.73 | 2.88 | - |
| id | id | B | m572 | 600 | 21.61 | 3.01 | - |
| id | id | V | m573 | 300 | 20.70 | 2.99 | - |
| id | id | R | m574 | 180 | 20.22 | 2.99 | - |
| id | id | i | m575 | 150 | 18.99 | 2.88 | - |
| 4478 | 25/01/01 | U | p600 | 2500 | 21.00 | 3.56 | 2.58 |
| id | id | B | p601 | 600 | 21.59 | 3.64 | 2.65 |
| id | id | V | p602 | 250 | 20.62 | 3.12 | 2.48 |
| id | id | R | p603 | 160 | 19.92 | 3.11 | 2.54 |
| id | id | i | p604 | 130 | 18.62 | 2.52 | 2.86 |
| 4486 | 27/01/01 | U | p680 | 2500 | 20.86 | 4.35 | 3.67 |
| id | id | B | p681 | 600 | 21.67 | 3.98 | 3.59 |
| id | id | V | p682 | 250 | 20.70 | 3.92 | 3.71 |
| id | id | R | p683 | 160 | 20.15 | 4.03 | 3.72 |
| id | id | i | p684 | 130 | 18.92 | 3.62 | - |
| 4494 | 05/04/00 | U | t871 | 3000 | 21.18 | 3.62 | 3.30 |
| id | id | B | t872 | 600 | 21.66 | 3.31 | - |
| id | id | V | t873 | 300 | 20.56 | 3.47 | - |
| id | id | R | t874 | 240 | 20.04 | 3.47 | - |
| id | id | i | t875 | 240 | 18.92 | 3.26 | - |
| 4551 | 01/06/00 | U | m647 | 2400 | 20.69 | 2.48 | 2.16 |
| id | id | B | m648 | 500 | 21.44 | 2.58 | 2.15 |
| id | id | V | m649 | 250 | 20.59 | 2.40 | 2.19 |
| id | id | R | m650 | 180 | 20.33 | 2.16 | - |
| id | id | i | m651 | 150 | 19.43 | 2.28 | 2.13 |
| 4552 | 02/06/00 | U | m693 | 2400 | 19.67 | 2.92 | 2.49 |
| id | id | B | m694 | 500 | 21.16 | 2.79 | 2.48 |
| id | id | V | m695 | 250 | 20.26 | 2.50 | - |
| id | id | R | m696 | 180 | 19.90 | 2.82 | 2.51 |
| id | id | i | m697 | 150 | 18.96 | 2.99 | 2.50 |
| 4564 | 27/01/01 | U | p686 | 2500 | 20.86 | 3.92 | 3.41 |
| id | id | B | p687 | 600 | 21.59 | 3.44 | - |
| id | id | V | p688 | 250 | 20.70 | 3.56 | - |
| id | id | R | p689 | 160 | 20.00 | 3.85 | 3.47 |
| id | id | i | p690 | 130 | 18.62 | 3.53 | - |
| 4621 | 06/04/00 | U | t966 | 3000 | 20.75 | 2.85 | - |
| id | id | B | t967 | 600 | 21.50 | 2.81 | - |
| id | id | V | t968 | 300 | 20.39 | 3.05 | 2.77 |
| id | id | R | t971 | 120 | 19.68 | 2.82 | - |
| id | id | i | t972 | 120 | 19.24 | 2.88 | - |
| 4636 | 27/01/01 | U | p693 | 2263 | 20.68 | 3.86 | 3.11 |
| id | id | B | p694 | 662 | 20.78 | 3.61 | 3.06 |
| id | id | V | p695 | 300 | 20.25 | 3.35 | 2.99 |
| id | id | R | p696 | 210 | 19.47 | 3.47 | 2.99 |
| id | id | i | p697 | 180 | 18.22 | 3.05 | - |
| 4649 | 03/06/00 | U | m723 | 2400 | 20.15 | 2.57 | - |
| id | id | B | m724 | 500 | 21.20 | 2.62 | - |
| id | id | V | m725 | 250 | 20.18 | 2.52 | - |
| id | id | R | m726 | 180 | 19.82 | 2.52 | - |
| id | id | i | m727 | 150 | 18.80 | 2.34 | - |
| 5322 | 06/04/00 | U | t992 | 3000 | 20.95 | 2.91 | 2.52 |
| id | id | B | t993 | 600 | 21.72 | 2.64 | 2.64 |
| id | 07/04/00 | V | t994 | 300 | 20.69 | 2.93 | 2.53 |
| id | id | R | t080 | 240 | 20.62 | 1.80 | 2.51 |
| id | id | i | t081 | 240 | 19.49 | 1.87 | 2.51 |
| 5576 | 07/04/00 | U | t083 | 3000 | 20.73 | 2.31 | - |
| id | id | B | t084 | 600 | 21.22 | 2.52 | 2.31 |
| id | id | V | t085 | 300 | 20.38 | 2.67 | 2.30 |
| id | id | R | t086 | 240 | 19.87 | 2.48 | 2.26 |
| id | id | i | t087 | 240 | 18.79 | 2.39 | - |
| 5813 | 29/05/00 | U | m579 | 2400 | 20.95 | 3.47 | 3.18 |
| id | id | B | m580 | 500 | 21.66 | 3.28 | 3.18 |
| id | id | V | m581 | 250 | 20.71 | 3.19 | - |
| id | id | R | m582 | 180 | 20.28 | 3.09 | - |
| id | id | i | m583 | 150 | 19.13 | 3.16 | - |
| 5831 | 31/05/00 | U | m622 | 2400 | 20.43 | 3.89 | 3.28 |
| id | id | B | m623 | 500 | 20.66 | 4.07 | 3.28 |
| id | id | V | m624 | 250 | 18.84 | 3.33 | - |
| id | id | R | m625 | 180 | 18.06 | 3.23 | - |
| id | id | i | m626 | 150 | 16.73 | 3.19 | - |
| 5846 | 01/06/00 | U | m654 | 2400 | 20.66 | 2.55 | 2.11 |
| id | id | B | m655 | 500 | 21.28 | 2.74 | 2.16 |
| id | id | V | m656 | 250 | 20.38 | 2.07 | - |
| id | id | R | m657 | 180 | 20.08 | 2.28 | 2.11 |
| id | id | i | m658 | 150 | 19.08 | 2.33 | 2.11 |
| 5866 | 02/06/00 | U | m700 | 2400 | 21.16 | 2.43 | 1.93 |
| id | id | B | m701 | 500 | 21.76 | 2.26 | 1.88 |
| id | id | V | m702 | 250 | 20.80 | 1.84 | - |
| id | id | R | m703 | 180 | 20.36 | 1.91 | - |
| id | id | i | m704 | 150 | 19.37 | 1.82 | - |
| 5982 | 03/06/00 | U | m730 | 2400 | 20.89 | 2.20 | 2.00 |
| id | id | B | m731 | 500 | 21.15 | 2.30 | 2.06 |
| id | id | V | m732 | 250 | 20.46 | 2.07 | - |
| id | id | R | m733 | 180 | 20.18 | 2.11 | - |
| id | id | i | m734 | 150 | 19.13 | 2.33 | 2.06 |
3 Data analysis
3.1 Outline of the operations
The analysis of the frames entails the following steps:
-
1.
The usual corrections for offset, the ”flat-fielding”, and the interpolation of bad columns. As explained below we tried to improve the flat-fields by ad hoc ”superflats”.
-
2.
The registration of the 5 frames in each passband to a common geometry, based on a set of measured coordinates for 6 to 12 stars. This is intended to simplify the derivation of colour maps if needed.
-
3.
The preparation of each frame for measurement, involving a final attempt to measure and correct residual large scale background trends, corrections for parasitic objects, a treatment against cosmic rays peaks, and the calibration against the available results of aperture photometry (see Sect. 3.2.3).
-
4.
Large errors in colour measurements may result from small differences between the widths of the PSFs of the two frames involved (see for instance Michard 1999, and the previous literature quoted therein). When the FWHMs of measured PSFs in the colour set for a given object differed by more than 10%, it was our practice to modify the frame PSFs and try to make them equal to that of the best frame of the group (see Sect. 3.2.4).
-
5.
The isophotal analysis of the V frame was performed according to Carter (1978), as implemented in the Nice technique described in Michard and Marchal (1994) (MM94).
-
6.
The correction procedures for the red halo effect in VI, and eventually for the effects of different PSF far wings in other colours, were performed (see Sect. 3.2.5). The correction necessitates the crossed correlation of the V frame by the I PSF and conversely. This operation cancels out the errors in the colour distribution induced by the red halo, but degrades the resolution. A correction to the calibrations performed before the convolutions is needed.
-
7.
Finally, colour measurements were performed along the previously found isophotal contours, and the average isophotal colours tabulated. Our routine at this stage involves corrections to the adopted values of the sky backgrounds, in order to eliminate the obvious effects of inaccuracies in these (see Sect. 3.2.6).
-
8.
The V surface brightness and colours have been collected in ad hoc files, and corrected for galactic absorption (or reddening) and the K effect, according to the precepts and constants given in the Third Reference Catalogue of Bright Galaxies (RC3, de Vaucouleurs et al., 1991). The usual linear representation of colours against have been calculated in selected ranges, avoiding on the one hand the central regions affected by imperfect seeing corrections and/or by important dust patterns; and on the other the outer range presumably affected by poor background corrections and residual noise.
3.2 Detail of operations.
Some important details of the above summarized procedures will now be discussed.
3.2.1 The background
The sky background of flat-fielded frames showed disappointingly large scale trends, specially in the U band. To improve upon this situation, it was tried to derive corrections by mapping the background of such frames, at least those which were not ”filled” by a large galaxy. Such maps were found to be correlated, although less so than expected, and their average used as a ”superflat”. The quality of the background was then generally improved: if not, the superflats were not used. Note that, in the observing runs of May 2000 and January 2001, a number of frames of ”empty” fields were obtained (sometimes in moonlight hours) to contribute to the derivation of superflats.
A final improvement was obtained by measuring, during the treatment of each frame, a number of background patches, and subtracting a linearly interpolated map of these, instead of a constant. The background residual large scale fluctuations were often measured at the three steps of the procedure, that is, after the application of the flats, of the superflats, and after the final treatment. Table 5 summarizes the results. It may be noted that the combination of flats and superflats left large errors in our first and second runs, specially in the U colour. The final background linear ”rectification” allowed quite significant improvements, as seen by comparing the upper and lower halves of the table.
| Colour | U | B | V | R | i |
|---|---|---|---|---|---|
| Flats+superflats 1st run | 1.84 | 1.19 | 0.72 | 0.68 | 0.95 |
| id. 2nd run | 1.90 | 0.77 | 0.45 | 0.54 | 0.79 |
| id. 3rd run | 0.69 | 0.79 | 0.56 | 0.60 | 0.64 |
| Final treatment 1st run | 0.36 | 0.34 | 0.30 | 0.29 | 0.28 |
| id. 2nd run | 0.40 | 0.27 | 0.26 | 0.31 | 0.30 |
| id. 3rd run | 0.28 | 0.28 | 0.24 | 0.20 | 0.32 |
If we consider an E galaxy observed under the typical conditions of the present series (see above for a tabulation of sky background values), the final residual fluctuations quoted here represent local errors of less than 0.1 mag near the isophote . We will return later to the question of errors resulting from background uncertainties.
3.2.2 Parasitic objects
In galaxy photometry it is necessary to remove parasitic objects, stars and galaxies, that overlap the measured object. In the present work we used concurrently the following techniques:
. replacement of pixels in a circle enclosing the ”parasite” by a circle symmetric about the center of the galaxy.
. replacement of the circle by another one chosen in a nearby area.
. marking of the pixels to be discarded in such a way that they are later left aside in the measuring programmes.
3.2.3 Calibrations
The frames were calibrated by comparisons with the results of aperture photometry. Our first choice was to use the UBVRI data of Poulain (1988) (PP88), and Poulain and Nieto (1994) (PN94) that are available for 26 objects of our survey, and are in Cousins’s system, notably for R and I. In a few cases the data collected in the HYPERCAT catalogues were used. These contain both primary data (those with an independent photometric calibration), and secondary data (actually calibrated with part of the primary data). Only primary data were used, selected according to our previous experience or prejudices. A few completely missing calibrations in R and I were replaced by values calculated from the tight correlations of VR and VI with BV, derived from Poulain’s data for E galaxies.
Although the I filter in the camera is of Gunn’s type, our photometry is transfered to Cousins’s system through the calibration. It is assumed that the difference of pass-bands has no significant effect on colour gradients.
3.2.4 Equalization of PSF FWHM’s
Many studies of colour distribution in galaxies are affected by errors resulting from the difference in the PSFs of the two frames involved in a colour measurement. Franx et al. (1989), Peletier et al. (1990), Goudfrooij et al. (1994) calculated the radial range where the errors due to ”differential seeing” are larger than some accepted threshold, and discarded the corresponding colours. Our policy, for instance in RM99, was to correct for this effect by adjusting the two frames to have PSFs with a common FWHM.
In the present study we tried to equalize the PSFs of the 5 frames in a given colour set. This is feasible if the 5 frames are taken in rapid succession, so that the PSFs have similar widths. The frame with the narrowest PSF is selected, and we find by trial and error a narrow gaussian (or sum of two gaussians) which can restore another frame to the same quality, or rather the same FWHM, by deconvolution. The parameters at hand are the of the gaussian and the number of iterations in the deconvolution. In Table 1 to 4 we give the original FWHM of each frame, and the improved after the procedure described here. Obviously this cannot lead to perfect results, and sometimes we find in our data the signature of ”differential seeing”, in the form of large colour variations, peaks or dips, within the seeing disk: these defects were edited out unless there was some good reason to suspect a genuine central colour anomaly, such as large dust patterns, or the jet of NGC4486.
The reader may notice that two observations of NGC4406 are listed in Table 2, one of May 30, the other of May 31 2000. The first one was taken through fog and with average seeing, while for the other the ”mistral” brought a clearer sky and very poor seeing. A special treatment was then applied: the central peak of the sharp images was ”grafted” on the corresponding regions of the unsharp but deeper images. This explains why the is so much narrower than the original for the frames of May 31.
| Subsample | N | ||||||||
|---|---|---|---|---|---|---|---|---|---|
| RM00 | 29 | -0.152 | 0.048 | -0.061 | 0.025 | -0.018 | 0.030 | -0.053 | 0.022 |
| 2000 Observ. | 23 | -0.138 | 0.037 | -0.064 | 0.018 | +0.018 | 0.015 | +0.093 | 0.047 |
| 2000 Correc. | 23 | -0.116 | 0.038 | - | - | -0.016 | 0.013 | -0.048 | 0.026 |
| 2001 Observ. | 14 | -0.174 | 0.045 | -0.080 | 0.022 | -0.017 | 0.013 | +0.040 | 0.037 |
| 2001 Correc. | 14 | -0.140 | 0.036 | - | - | - | - | -0.062 | 0.025 |
3.2.5 ”Red halo” and PSFs far wings.
Before the start of this survey, the CCD camera on the telescope used was known to be affected by the ”red halo”, an unfortunate property of thinned CCDs. The aureoles surrounding stellar images are obviously brighter and more extended in the I band than in B or V. Not only the red halo, but more generally the outermost wings of PSFs, were measured during our observing runs in 2000-1. The techniques and results are described in Michard (2001) (RM01). The choice of appropriate star fields allowed us to extend the measurements up to a radius of nearly 3 ′, and down to a level of about of the central peak. Due to the red halo effect, PSF wings in I may be a factor of 3 brighter in an extended radius range than the V ones. Much smaller but still significant differences may also occur between the PSFs of various spectral bands, the V PSF wings always being fainter. The V PSF wings however, and all the others at the same time, were reinforced between our observing runs of spring 2000 and winter 2001, probably an effect of 10 months ageing of mirrors coatings. The final output of the measurements are average ”synthetic” PSFs in the format 512x512 pixels, or 5.8x5.8 ′, for each run and pass-band.
A set of numerical experiments on model galaxies is also presented in RM01, to illustrate the effects of these far wings on the observed surface brightness and colour distributions. The most striking effect occurs for the gradient , which appears strongly positive, while it is negative according to the classical results of Bender and Möllenhof (1987), or Goudfrooij et al. (1994). More subtle effects are found for other colours, with relatively small but definite changes in gradients.
To correct for the consequences of the red halo, or other similar effects upon the colour distribution in the index C1C2, frame C1 is convolved with the PSF of frame C2 and conversely. After this operation, the resulting images have been submitted to the same set of convolutions, one in the atmosphere plus instrument, the other in the computer: they lead therefore to correct colour distributions, but with a significant loss of resolution. As the convolutions attenuate the central regions of the galaxy, and much more so for the V frame convolved by the I PSF, the mean colours are biased: a correction to the calibrations performed before the convolutions is needed. This has been done by a comparison of simulated aperture photometry to the observed one, an operation also used to estimate the errors in calibration (see below).
Since the extended PSFs are found with limited accuracy, it is necessary to discuss the validity of the corresponding corrections obtained through crossed convolutions, the more so because of the obvious changes of the PSF far wings between run 1 and run 3. The mean values of the colour gradients for subsamples of E galaxies have been used for these checks, with the results of Table 6. For a subsample of 12 or more E galaxies the mean colour gradients and their dispersions cannot differ much, so that their values may be used as checks of the need for a correction and its eventual success. 111This assertion is questionable as pointed out by the referee. We therefore tested it by comparing the distributions of the gradients in subsamples of 15 to 25 objects, sorted out by NGC numbers, from the surveys of Peletier et al. 1990, Goudfrooij et al. 1994 and our discussion in RM00. This procures 8 tests, according to the number of colours in each of the sources. It turns out that the subsamples are statistically coincident in 4 cases. They differ by slightly more than the calculated errors in the others. The reference for these comparisons is the subsample in Michard (2000) (RM00), mostly a rediscussion of the ”classical” data by Peletier et al. (1990), Goudfrooij et al. (1994) and others.
Looking at the Table 6, it is clear that the red halo introduces enormous errors in the VI gradients, but that the corrections are remarkably successful in restoring the agreement of the results with the accepted reference, both as regards the mean values and the dispersion. The same may be said about the VR gradients. The wings of the V PSF were strongly reinforced between our run 3 and run 1 or 2, but much less so for the I and R PSF wings. As a result the red halo effect is less in VI for the frames of run 3 and disappears in VR.
The situation is less clear for the UB distributions. Our mean uncorrected gradients are in good agreement with the ”classical” data, essentially from Peletier et al. (1990), as rediscussed in RM00. On the other hand, the U PSF wings are consistently above the V ones in all our runs, so that the true slopes of the UB variations may be a bit smaller than the observed ones. This error might well be present in the classical observations. Incidentally, the data of Peletier et al. were obtained in UR, and it is impossible to be sure that the far PSF wings of the used telescope were the same in both pass-bands!
Similar remarks might be made about our BV data. Since the mean measured gradient is the same for our data of the year 2000 and the adopted reference (and as a good B PSF is not available) we take as correct this set of results. For our data of 2001, there is evidence that the wings of the B PSF were slightly above those of the V one, so that the BV gradients might also be biased upwards.
It appears that a significant source of error in the measurement of the small colour gradients in E galaxies has hitherto been overlooked. It might be that small systematic errors, of the order of some 15-20%, are still present in the UB or UV gradients published here. Although such errors would not have significant astrophysical implications, control observations are planned.
3.2.6 Measurements of isophotal colours
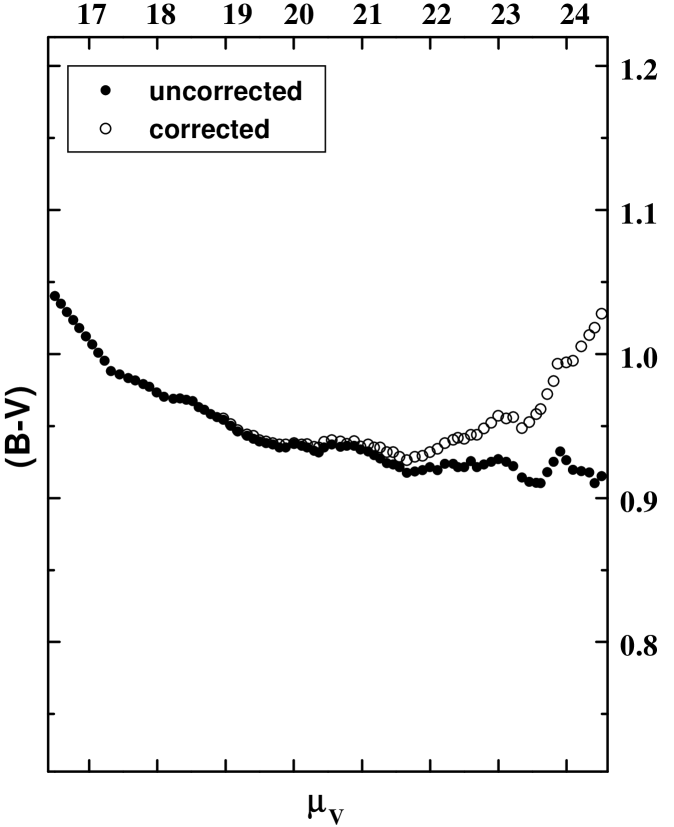
Our procedure uses Carter’s isophotal representation of the V frame. The successive contours at 0.1 mag intervals are fitted to each of the two frames to be compared, the mean surface brigtnesses calculated and the corresponding magnitudes and colours derived. A sliding mean smoothing is applied to the data for the outer contours and a graph of the colour against displayed. This might hopefully be linear, or nearly so, in the studied range. If it is not, it is our practice to introduce corrections to the provisional values of the sky background for one or both of the frames, in order to get rid of the ” breaks” in the colour-radius relation typically associated with a poor choice of the background constant. The reader is referred to the graphs published in Goudfrooij et al. (1994) for examples of such features. In Fig.1 we show a color profile with a rather important defect due to poor backgrounds, and its adopted correction.
The introduction of such ”aesthetic” corrections to the raw data might be criticized, since it assumes a regular behaviour of the colours at large . This is however a reasonable hypothesis: the introduced corrections remain small, as shown by the statistics of Table 7. It should be noted that the mean sky background values derived for our large field frames are more precise than in previous works based on small field frames, where the sky was not reached at all. The problem lies in the presence of residual large-scale background fluctuations (see above): their effects are similar to those resulting from the poor evaluation of a constant background, and can be approximately corrected by the introduction of an ad hoc constant, or rather a set of constants, for the 5 frames in the colour set.
The linear fit was finally performed on a range of selected so as to avoid the central regions affected by known dust patterns or possible residual seeing-induced errors, and the outermost regions visibly affected by deviations from the expected straight line.
| Colour | U | B | V | R | I |
|---|---|---|---|---|---|
| 1st and 2nd run | 0.22 | 0.14 | 0.12 | 0.18 | 0.20 |
| 3rd run | 0.14 | 0.07 | 0.02 | 0.08 | 0.14 |
3.2.7 Errors
The noise is not a significant source of error in this type of work, because averages can be performed upon thousands of pixels in the galaxy regions of low S/N ratio. Residual noise effects at large can be easily recognized in sample plots of the data (see Fig. 1, 2 , 3 , 4). The main sources of errors lie:
-
•
in the calibration, giving a probable error , affecting equally all parts of a given object, but dependent upon the quality of the available aperture photometry in each colour.
-
•
in the ”differential seeing”, i.e. the small differences in PSF between the frames in a colour set, also after the adjustments described above. This error occurs only near the center of the objects, say in a diameter of twice the seeing FWHM (it would be a much larger range without the performed adjustments).There is no obvious reason for it to be colour dependent.
-
•
in the sky background residual large-scale fluctuations, or equivalently, errors in the sky background estimates. This error is strongly dependent upon colour and the studied radius, or rather the corresponding surface brightness.
These three components of the total error will now be considered, together with other relevant topics.
-
1.
Errors in colours from calibration inaccuracies.
When a number of measurements are available for a given object, for instance 5 apertures in PP88 and PN94, a probable error of the resulting calibration is readily derived from the dispersion of these measured values about the results of simulated aperture photometry, calculated from our data, i.e. V magnitudes, isophotal parameters and colours. For the preferred calibrations with Poulain’s data, the computed error is often less than 0.01 in BV or VR but may rise to 0.02 in UB or VI. Still larger calibration errors, up to 0.04, have been estimated for objects with very scanty or uncertain aperture photometry. These probable errors apply to the zero point of the colour regression as shown in Table 9, and to all colour data from the same object.
-
2.
Residual errors from PSF equalization.
The residual errors after this step in our data treatment can be objectively ascertained by comparing the ”central” BR colours in our survey with the equivalent data from RM99, derived from high-resolution CFHT frames. For the present survey the ”central colours” are the integrated colours within a radius of 3 ″. From RM99, Table 6, we find the colours at the isophote of 1.5 ″, which are likely similar. The statistics of the difference BR(new)–BR(RM99) are for 31 objects in common: mean=0.01; . Assuming then that the errors are equal in the two surveys, the probable error associated with poor PSF adjustements is in BR. This source of error has no reason to vary significantly from one colour to another. It is independent of the error of calibration previously discussed.
The comparison between the two surveys is made possible because the same set of calibrations has been used, although the field of the CFHT frames was often not sufficient to use all calibrations apertures. A minor part of the above differences may come from this source. In RM99, the BR of NGC2768 is quoted too red by 0.08 and that of NGC3610 too red by 0.10.
-
3.
Errors from sky background inaccuracies
Given and , the relative errors in the sky background evaluation for frames A and C, A and C beeing a pair among UBVRI, the magnitude error in the colour AC may be expressed as . Here is the magnitude contrast between the object and the sky in colour A. Using average values for the colours of E-galaxies and for the sky brightnesses, for any colour may be expressed in terms of . Then, in the range of small , the expression reduces to where .
by definition; we find and , while and are slightly below 1.
The ,… are unknown, but it is feasible to get statistics of the linear combinations . Indeed, as explained above, we have adopted ad hoc corrections to provisional sky background values, in order to regularise the colour- relations. It is reasonable to assume that the errors left after these corrections are proportional to the adopted corrections themselves. We take , where is a small constant and the may be derived from the statistics of the adopted corrections given in Table 7. In practice somewhat different statistics have been calculated, to take into account the fact that our corrections for two colours are not necessarily uncorrelated. The constant , different for our observing runs of 2000 and 2001, was chosen so as to get a system of errors compatible with the appearance of the data and also with the errors found for the slopes of the colour- relation. The finally adopted errors from sky background inaccuracies are given in Table 8. Note that this source of error is negligible for or smaller. Predicted errors are reduced for our run 3 as compared to the two others.
Table 8: Probable errors associated with sky background inaccuracies. Units: magnitude. Estimated errors are the same in VR as in BV. Colour UB UV BV VI 1st and 2nd run 23 0.023 0.026 0.008 0.012 id 24 0.058 0.064 0.020 0.030 id 24.5 0.093 0.102 0.032 0.048 3rd run 23 0.017 0.019 0.006 0.010 id 24 0.042 0.048 0.015 0.026 id 24.5 0.067 0.077 0.024 0.041 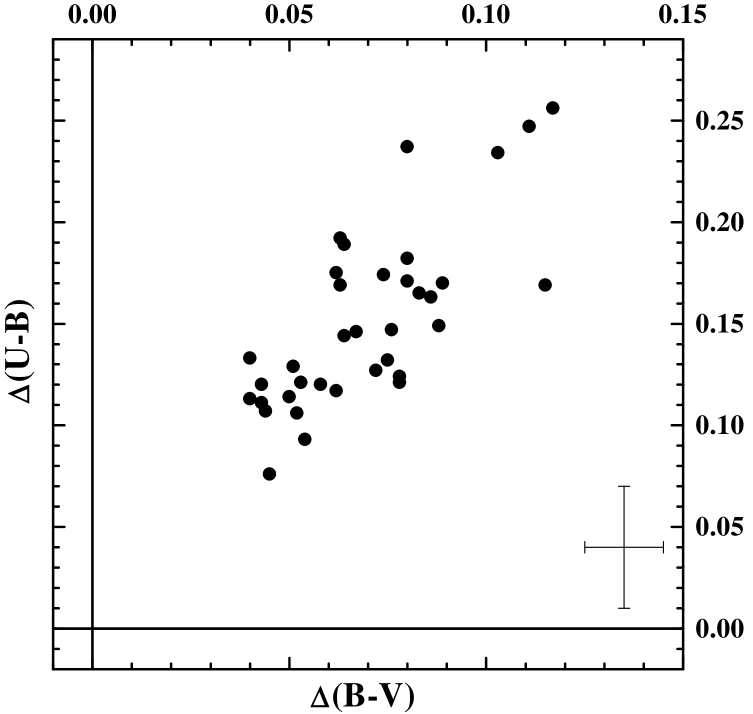
Figure 5: Correlation between the colour gradients, with the signs changed. Abscissae: . Ordinates: . Compare with the similar diagram in RM00, or with the original correlation diagram between and in Peletier et al. (1990). The dispersion is clearly reduced here, which can only be attributed to an improved accuracy. 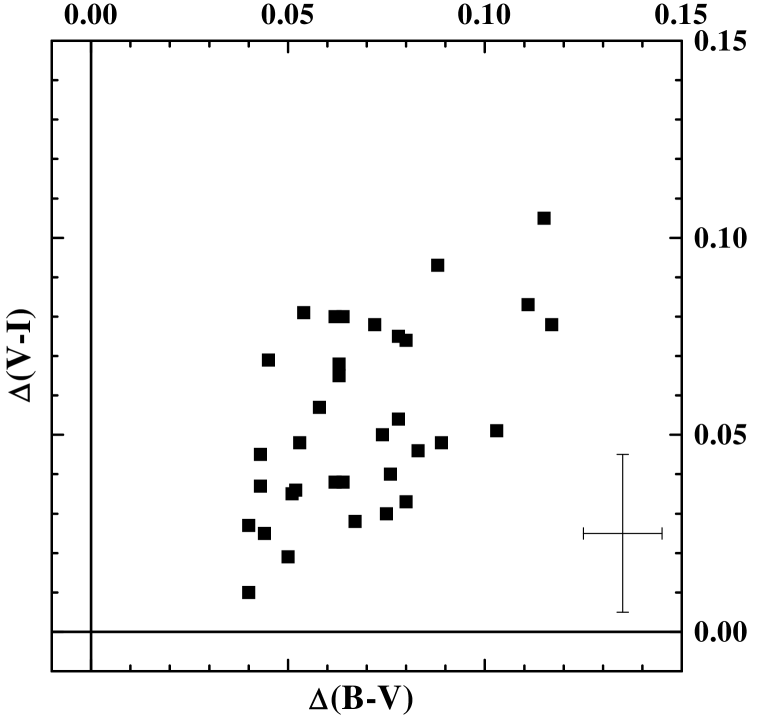
Figure 6: Correlation between the colour gradients, with the signs changed.. Abscissae: . Ordinates: . Here the comparison with similar diagrams in RM00 does not show much increase in the accuracy of the new data. -
4.
Total errors
The above estimated errors are independent and should be added quadratically. In the central region with ″, the total error will be . In the mean region with the total error equals the calibration error. Finally, in the outer range of one can use .
-
5.
Errors from the corrections for red halo and other far wings effects
To our knowledge, the crossed convolutions used to correct for the red halo and similar effects do not give rise to random errors, but rather to systematic errors due to inaccuracies in the adopted PSFs. Such problems may be detected from the study of the distributions of the slopes of the colour- relations discussed below.
-
6.
Errors in the slopes of the colour- relations
These have been calculated by two complementary methods. On the one hand, we can look for the correlations between the slopes derived here and those from the literature, notably the data collected and discussed in RM00. Assuming then that the errors are the same in both sources, we get an estimate of our slope errors, hopefully an upper limit. On the other hand we can consider the internal correlations between the slopes of the various colour- relations, specifically and others with . Figure 5 and 6 shows the correlations of the UB and VI colour gradients with that in BV. The coefficients of correlation are respectively 0.73 and 0.40. A weighted mean of the slopes in the 4 colours has also been used as reference instead of with analogous results. From the dispersions of such correlations the slope errors can be estimated, if the error for the reference or is ”guessed”. The two techniques give results in very good agreement, the internal correlations indicating somewhat smaller errors.
The probable errors of the slope estimates are then 0.03 in UB or UV, 0.01 in BV, 0.015 in VR or BR, 0.02 in VI.
4 Observational results
The available data from the present study are:
-
1.
Table 9, giving for each object the linear representation of the colour- relations, i.e. the selected inner and outer radii of the fit, the zero point colour with its probable error and the slope. The probable errors for the slopes are given above. This table allows easy calculation of the colours at any radius, notably the effective radius and others as considered below.
-
2.
In electronic form only, the tables giving for each galaxy, as a function of the radius , the V magnitude and the colours UB, BV, VR, VI. These tables are presently available with the UB indices as observed, and consistent with Table 9. They will be later made available after correction for suspected effects of PSF far wings (see discussion in 3.2.5).
-
3.
Series of graphs from the above tables, showing the colours as a function of or of . Examples of these graphs are shown here to illustrate a number of properties of the radius-colour relations.
-
4.
Table 10 gives the ”central” colours according to several definitions: we have considered the colours integrated inside the area of radius ″, and the colours calculated for ″from the linear representations of Table 9. They should be nearly equal if these representations remain valid at small , which is not always the case: see below for a description of typical deviations.
-
5.
Table 11 collects colours measured at the outermost range of the available data expressed in V magnitude. This gross limit varies between (for NGC4472) and 24.5. It is controlled by the size of the object and the ”cleanliness” of the nearby field.
The SA0 galaxies NGC3115, 3607, 4550 and 5866 have been observed with the E-type sample. The corresponding results are given in the Tables, but they have been discarded from the discussion.
4.1 Statistical comparison with previous work
-
•
Assuming that colours result only from population variations, ”perfect” correlations between zero point colours in different pass-bands are expected. We have compared colour-colour correlations for previous surveys and the present one. For BI against BV we find from Goudfrooij et al. (1994) a coefficient of correlation (41 objects) compared to from Table 9 (37 objects). For UR against BR the data of Peletier et al. 1990 (38 objects) give , while the present data leads to . The improvement is less if we compare our results with the discussion in RM00 where the calibration of the available photometry was reconsidered.
-
•
The correlation between colour gradients should also be as good as allowed by errors of measurements. Again we compare the correlation coefficients between gradients from the literature and our results for the same colours. From Goudfrooij et al. (1994), considering the gradient against , we find which is quite good. The result derived from Table 9 is still better, i.e. . The improvement is more pronounced when the against correlation is calculated from Peletier et al. (1990): one obtains only, instead of with our data. 222The coefficients of correlation given here are of course different from the previously calculated ones in Sect. 3.2.7.6 , which refered to other colours with smaller gradients.
-
•
Our colour measurements could be obtained at much lower surface brightness (or larger radii) than in previous work. The present data extend to , with a median value near in all colours. The tables by Goudfrooij et al. (1994), available from CDS Strasbourg, are mostly limited to in BV and in VI (median values), due to the small fields of the frames, notably in the I band (and probably an ad hoc cut off). Their published graphs generally extend to the same radius in both colours. The tables from Peletier et al. (1990), again at the CDS, extend to in BR and in UR (mean values) due to a systenatic cut-off at 10% of the sky. The printed tables may be still more severely truncated.
In summary, our colour data generally extends 1.5 to 2 magnitudes deeper than in previous works, so that ”external colours” refering to the level whenever possible, are presented in Table 11 with realistic error estimates.
4.2 Description of isophotal colour profiles.
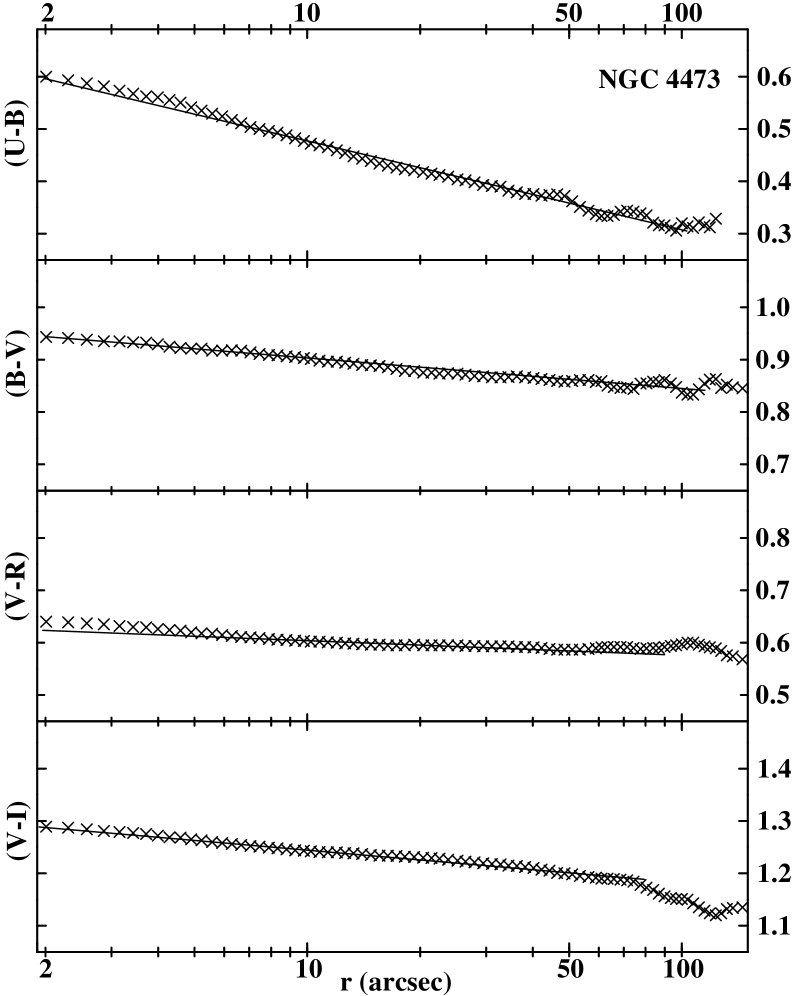
Most of the profiles relating colour to , or equivalently to the surface brightness , are regular, meaning that they deviate very little from a straight line in the range of abscissae relevant to the present data, roughly ″and . In this case, the ”central colours” integrated within ″, and the colours calculated from the linear representation at the average radius of , differ very little. Central colour according to these two definitions are given in Table 10: compare columns (5) and (6) for UV, and (3) with (7) for VR. Figure 2 gives an example of a set of regular colour profiles for NGC4473. Of course the linear colour– relation is only approximate and breaks down at small for all galaxies observed at high resolution. Carollo et al. (1997) obtained V maps of a number of E-galaxies from HST frames, disclosing minute colour structures in some cases. In RM99, the CFHT resolution proved sufficient for the detection and classification of BR central ” red peaks”. These are smoothed out, at least partly, with the OHP seeing.
Non regular profiles have been observed in the following cases:
-
1.
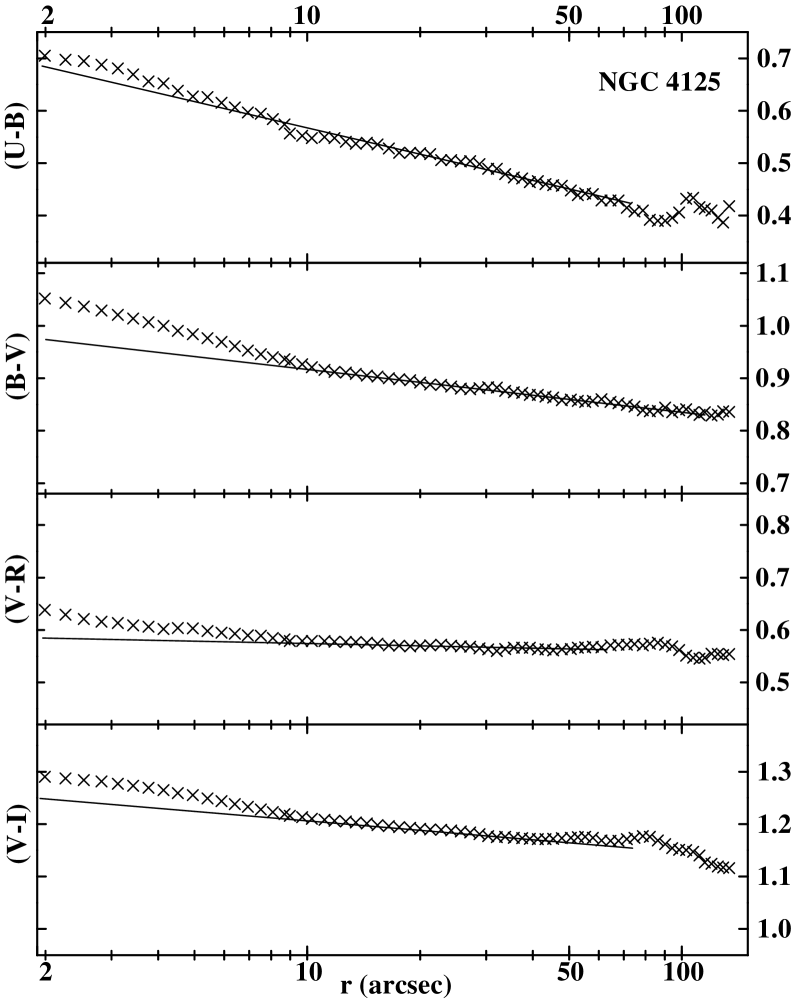
When an important dust pattern occurs near the center of an object, it produces a central red hump in the colour profile. This is the case for galaxies with the value of 3 for the dust pattern importance index (DPII) introduced in RM99, such as NGC2768, 4125 and 4374, but also for 5813 and 5831. The dust ring of NGC3607, type SA0, produces noticeable bumps in its colour profiles. Fig. 3 gives an example of the colour profiles of such a centrally dusty galaxy, i.e. NGC4125. In such cases, the integrated colours within ″are redder than the extrapolated colours at : this ”extra reddening” is smaller in UB than in other colours. The consideration of the central reddening in VR, a colour nearly insensitive to age-metallicity variations but sensitive to dust, gives a possibility to correct other colours for dust effects. This has been done, in some applications, for galaxies of DPII 3.
-
2.
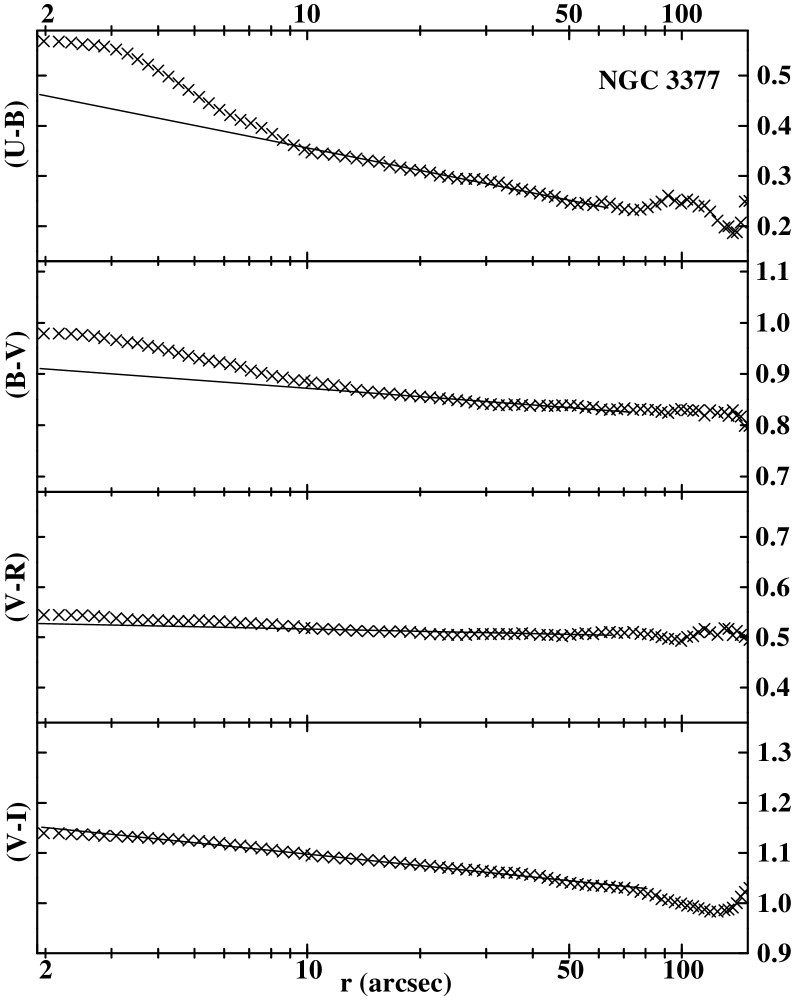
A few objects show a central red hump in some of the colour profiles, specially UB and also eventually BV. This is the case of NGC3377, 3379, 3610(?) and 4494. Fig.4 illustrates the case of NGC3377. For such objects the ”extra reddening” defined above is near zero in VR and VI. It is therefore permitted to attribute it to a metallicity increase rather than to dust.
-
3.
On the contrary, the central colours UB, BV may be bluer than the extrapolation of the linear portion of the profile. This occurs for objects with larger than average colour gradients. The best such case is NGC4636; others are 4283, 4478 and the SA0 4550. An ”extra blueing” in UV is then apparent from the comparison of indices in columns (5)-(6) of Table 10. This is also marginally the case for such giant galaxies as NGC4406, 4472, 4649: according to RM99 the colour profile of such objects tend to flatten out near the center.
-
4.
NGC4486 is remarkable in showing a central ”blue deep”, the UB colour beeing 0.51 at as compared to 0.72 near ″. This central feature is probably somehow related to the famous non-thermal jet of this galaxy. The jet is of course very conspicuous in UB , with a peak colour near -0.1. Needless to say, both the central ”blue deep” and the jet are affected by seeing (and our attempts to correct its effects).
4.3 Correlations of interest.
4.3.1 Correlations between colour gradients.
The correlations between the various colour gradients have already been noted as useful tools to evaluate the probable errors in gradients. These correlations are displayed in Fig. 5 and 6.
The coefficient of correlation between and is 0.75; that between and is only 0.40. For it falls to 0.20, because the errors are of the same order of magnitude as the VR gradients. Imposing regression lines running through the origin, the relative slopes are , and . These relative slopes are in good agreement with the results in RM00, and its conclusion, i.e. the negligible influence of dust upon colour gradient, is confirmed.
The distribution of colour gradients for E-galaxies may be of interest. The following parameters are found: with ; with ; with ; with . The dispersions are not much larger than the errors estimated above. The distributions are asymmetric: there are 4 objects with larger than above the mean, but none at less than the same deviation. These galaxies, with clearly steeper than average, by about twice the estimated probable error of measurement, are NGC4283, 4478, 4564 and 4636, seemingly a random collection.
Remark: An attempt to sort the E-galaxies by flattening as measured in MM94, and to look for some relation to the gradients, lead to negative results. Similarly no significant difference was found between diE and other galaxies.
The SA0 NGC4550 has quite exceptional gradients in all colours, and an admixture of dust and relatively young stars could be invoked to explain its properties. This object also has very remarkable kinematics, as first described by Rubin et al. (1992); a model has been proposed by Rix et al. (1992). The few other S0s in the present sample are similar to Es with regard to their colour gradients.
4.3.2 Colour-colour diagrams
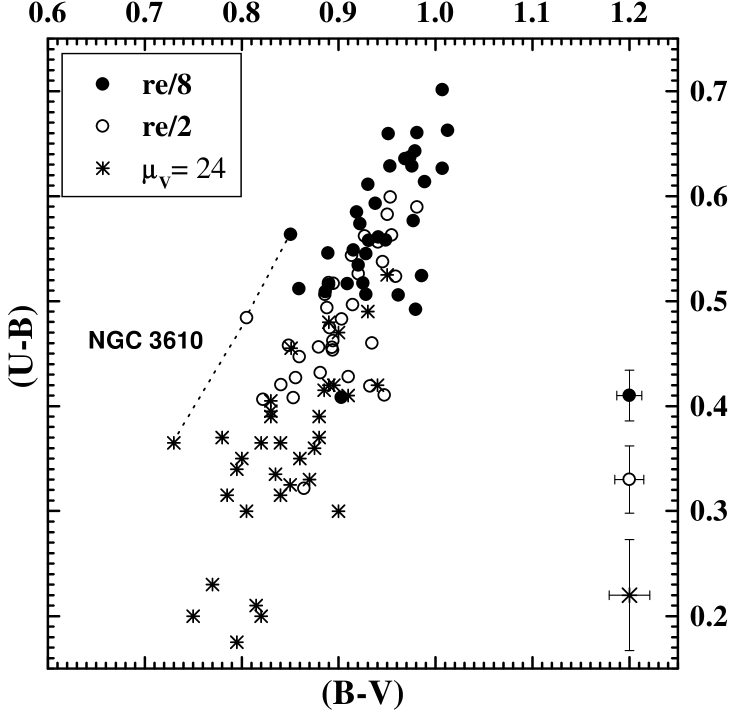
Many colour-colour diagrams can be built from the present data. The indices used may be calculated from the linear representations in Table 9 at the effective radius , at a near center position , and at an intermediate position . The system of here used is an average of estimates in MM94, Prugniel and Héraudeau, 1998, and the RC3. It is satisfactory that the various indices , , , define a common diagram with the corresponding UB. This may suggest that a common physical variable controls the variations inside an object, and the object to object changes, of the two colours. Such graphs readily show larger than average calibrations errors: for instance, the UB colour of NGC3610 is clearly too red for its BV.
We have also traced colour-colour diagrams for the ”central” colours, (Table 10), i.e. integrated in the radius ″. They are similar to those traced with the interpolated colours, but with larger dispersions: this is not surprising since the central colours suffer from larger errors (see 3.2.7).
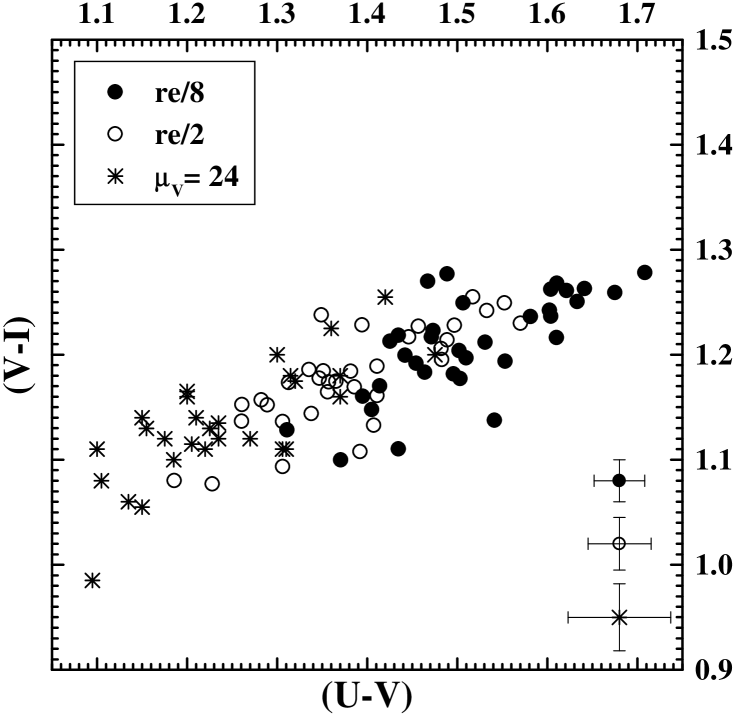
Finally, one can trace colour-colour diagrams with the ”outermost colours” collected in Table 11. They are in fair agreement with the diagrams derived from Table 9, and extend these towards the blue. We show in Fig. 7 a composite colour-colour diagram UB against BV, using the colours ar , and the outermost range. Similarly Fig. 8 displays the diagram of VI against UV.
| NGC | Type | UB | BV | VR | VI | ||||||||
|---|---|---|---|---|---|---|---|---|---|---|---|---|---|
| 2768 | diE | 10 | 80 | 1.467 | 0.521 | -0.093 | 0.892 | -0.054 | 0.536 | -0.012 | 1.136 | -0.081 | 3 |
| 2974 | diE | 8 | 80 | 1.404 | 0.429 | -0.237 | 0.905 | -0.080 | - | - | - | - | 3 |
| 3115 | SA0 | 8 | 100 | 1.464 | 0.501 | -0.169 | 0.912 | -0.069 | 0.585 | -0.010 | 1.222 | -0.047 | 0 |
| 3193 | unE | 6 | 40 | 1.169 | 0.461 | -0.163 | 0. 924 | -0.086 | 0.567 | 0.009 | - | - | 0 |
| 3377 | diE | 8 | 80 | 1.399 | 0.298 | -0.144 | 0.854 | -0.064 | 0.510 | -0.014 | 1.067 | -0.080 | 1- |
| 3377 | diE | 8 | 80 | 1.403 | 0.289 | -0.170 | 0.852 | -0.075 | 0.505 | -0.028 | 1.074 | -0.105 | 1- |
| 3379 | unE | 8 | 100 | 1.460 | 0.538 | -0.111 | 0.918 | -0.043 | 0.585 | -0.013 | 1.206 | -0.037 | 1- |
| 3605 | boE | 4 | 30 | 1.043 | 0.403 | -0.175 | 0.821 | -0.062 | 0.517 | -0.014 | 1.076 | -0.038 | 0 |
| 3607 | SA0 | 15 | 100 | 1.569 | 0.451 | -0.111 | 0.882 | -0.067 | 0.537 | -0.017 | 1.149 | -0.046 | 3 |
| 3608 | boE | 5 | 50 | 1.201 | 0.415 | -0.189 | 0.949 | -0.064 | 0.542 | -0.020 | 1.175 | -0.038 | 1- |
| 3610 | diE | 4 | 50 | 1.159 | 0.448 | -0.132 | 0.785 | -0.075 | 0.503 | 0.003 | 1.144 | -0.030 | 0 |
| 3613 | diE | 6 | 60 | 1.287 | 0.470 | -0.174 | 0.875 | -0.074 | 0.533 | -0.018 | 1.100 | -0.050 | 1- |
| 3640 | boE | 5 | 60 | 1.266 | 0.455 | -0.120 | 0.892 | -0.043 | 0.544 | -0.012 | 1.162 | -0.045 | 0 |
| 3872 | diEp | 5 | 60 | 1.202 | 0.506 | -0.127 | 0.928 | -0.072 | 0.571 | -0.005 | 1.176 | -0.078 | 0 |
| 4125 | diE | 10 | 80 | 1.445 | 0.497 | -0.165 | 0.890 | -0.083 | 0.568 | -0.011 | 1.183 | -0.046 | 3 |
| 4261 | boE | 5 | 80 | 1.320 | 0.588 | -0.170 | 0.948 | -0.089 | 0.585 | -0.014 | 1.246 | -0.048 | 1- |
| 4278 | diE | 10 | 60 | 1.361 | 0.408 | -0.149 | 0.845 | -0.088 | 0.554 | -0.031 | 1.145 | -0.093 | ? |
| 4283 | unE | 5 | 30 | 1.080 | 0.410 | -0.256 | 0.870 | -0.117 | 0.533 | -0.040 | 1.147 | -0.078 | 0 |
| 4365 | boE | 5 | 120 | 1.430 | 0.552 | -0.120 | 0.939 | -0.058 | 0.588 | -0.011 | 1.226 | -0.057 | 0 |
| 4374 | unE | 8 | 80 | 1.394 | 0.497 | -0.107 | 0.915 | -0.044 | 0.565 | -0.020 | 1.189 | -0.025 | 3 |
| 4387 | boE | 5 | 30 | 1.102 | 0.431 | -0.106 | 0.883 | -0.052 | 0.565 | -0.028 | 1.170 | -0.036 | 0 |
| 4406 | boE | 5 | 80 | 1.312 | 0.463 | -0.121 | 0.961 | -0.078 | 0.561 | -0.018 | 1.204 | -0.054 | 0 |
| 4472 | unE | 5 | 150 | 1.510 | 0.590 | -0.133 | 0.963 | -0.040 | 0.592 | -0.005 | 1.257 | -0.010 | 0 |
| 4473 | diE | 5 | 80 | 1.310 | 0.423 | -0.169 | 0.881 | -0.063 | 0.598 | -0.021 | 1.225 | -0.065 | 0 |
| 4478 | boE | 6 | 50 | 1.286 | 0.300 | -0.234 | 0.806 | -0.103 | 0.525 | -0.023 | 1.129 | -0.051 | 0 |
| 4486 | unE | 10 | 120 | 1.559 | 0.566 | -0.192 | 0.921 | -0.063 | 0.601 | -0.019 | 1.235 | -0.068 | 0 |
| 4494 | unE | 5 | 80 | 1.340 | 0.452 | -0.114 | 0.862 | -0.050 | 0.518 | -0.016 | 1.137 | -0.019 | ? |
| 4550 | SA0 | 5 | 40 | 1.199 | 0.260 | -0.252 | 0.826 | -0.196 | 0.511 | -0.108 | 1.119 | -0.185 | 0 |
| 4551 | boE | 5 | 40 | 1.184 | 0.475 | -0.113 | 0.880 | -0.040 | 0.525 | -0.014 | 1.151 | -0.027 | 0 |
| 4552 | unE | 5 | 100 | 1.366 | 0.489 | -0.171 | 0.943 | -0.080 | 0.546 | -0.035 | 1.191 | -0.074 | 0 |
| 4564 | diE | 5 | 50 | 1.233 | 0.369 | -0.247 | 0.884 | -0.111 | 0.545 | -0.024 | 1.124 | -0.083 | 1- |
| 4621 | diE | 5 | 80 | 1.327 | 0.522 | -0.182 | 0.919 | -0.080 | 0.584 | -0.004 | 1.216 | -0.033 | 0 |
| 4636 | unE | 7 | 100 | 1.416 | 0.495 | -0.169 | 0.906 | -0.115 | 0.562 | -0.034 | 1.185 | -0.105 | ? |
| 4649 | unE | 5 | 150 | 1.515 | 0.592 | -0.121 | 0.982 | -0.053 | 0.571 | -0.036 | 1.231 | -0.048 | 0 |
| 5322 | boE | 5 | 80 | 1.313 | 0.445 | -0.146 | 0.843 | -0.067 | 0.530 | -0.001 | 1.091 | -0.028 | 0 |
| 5576 | boEp | 5 | 60 | 1.216 | 0.382 | -0.147 | 0.821 | -0.076 | 0.521 | -0.003 | 1.126 | -0.040 | 0 |
| 5813 | unE | 5 | 60 | 1.229 | 0.477 | -0.076 | 0.945 | -0.045 | 0.589 | -0.022 | 1.244 | -0.069 | 1 |
| 5831 | diE | 4 | 50 | 1.175 | 0.423 | -0.124 | 0.876 | -0.078 | 0.515 | -0.040 | 1.168 | -0.075 | ? |
| 5846 | unE | 5 | 100 | 1.407 | 0.594 | -0.129 | 0.955 | -0.051 | 0.586 | -0.016 | 1.245 | -0.035 | 0 |
| 5866 | SA0 | 15 | 110 | 1.612 | 0.367 | -0.190 | 0.819 | -0.100 | 0.537 | -0.048 | 1.095 | -0.042 | 3+ |
| 5982 | boE | 8 | 100 | 1.447 | 0.431 | -0.117 | 0.868 | -0.062 | 0.522 | -0.043 | 1.145 | -0.080 | ? |
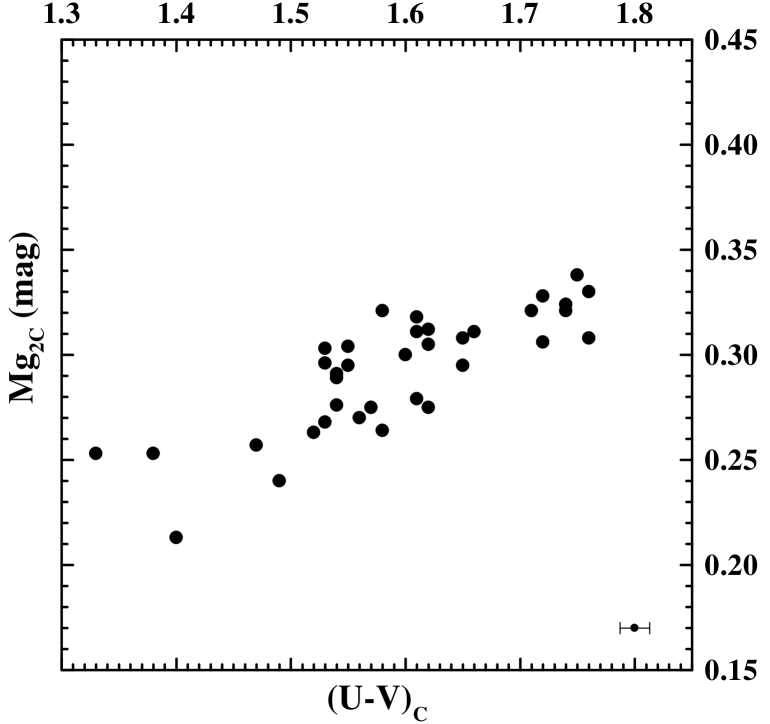
4.3.3 The UV colour as a metallicity index for ellipticals ?
Burstein et al. (1988) showed a correlation between the central index and a global BV colour measured in a large aperture (see also Bender et al. , 1993). This type of correlation is reconsidered here using the UV colour which is much more sensitive to metallicity than BV, and taking advantage of recent estimates of the index far from center.
Two correlations between the index and UV are considered in Fig. 9 and 10. The first shows the relation between the two quantities near the galaxy center: the index is taken from the tabulation by Faber et al. 1989. The index is the integrated colour in a circle of radius ″. The value for three galaxies with important central dust patterns have been corrected by reference to the central bump in (VR), a colour sensitive to dust but less so to metallicity changes. The coefficient of correlation reaches 0.825. Taking as and as we find the regression .
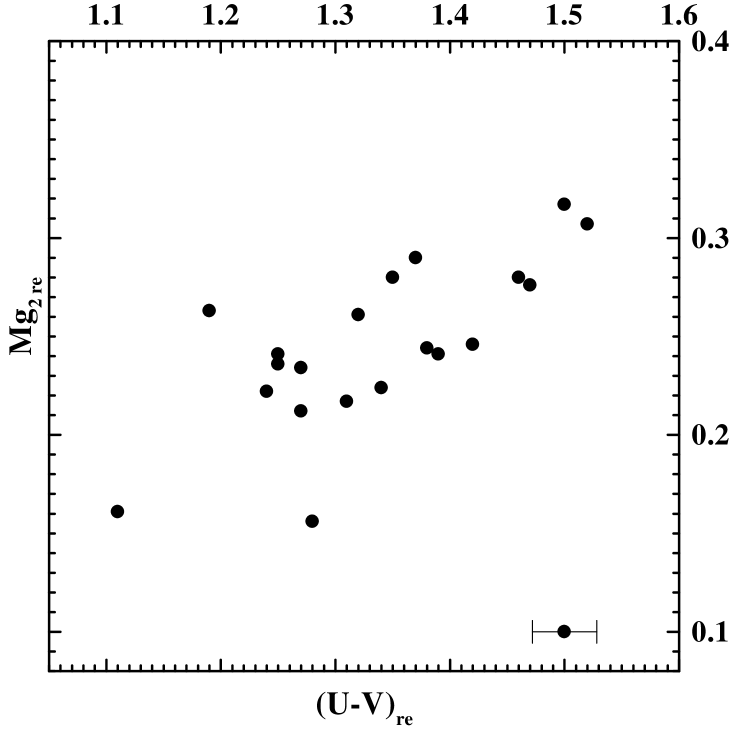
The second, i.e. Fig. 10, displays the correlation between the UV colour and the index at the effective radius . has been taken from Kobayashi and Arimoto (1999) (KA99). To increase the number of data points the gradients were introduced, using the linear relation derived from the distribution of the values of both indices in the tables of KA99. The coefficient of correlation still reaches 0.72. Again, with the colour in and the in we find . The difference to the above correlation for central indices is barely significant.
The quality of these correlations proves that both indices are essentially controlled by the same physical variables, and leaves little room for the effects of diffuse dust upon the colours of E-galaxies.
| NGC | |||||||
|---|---|---|---|---|---|---|---|
| 2768 | 0.72 | 1.04 | 0.61 | 1.28 | 1.76 | 1.60 | 0.55 |
| 2974 | 0.58 | 1.03 | - | - | 1.60 | 1.72 | 0.00 |
| 3115 | 0.68 | 1.03 | 0.60 | 1.25 | 1.72 | 1.72 | 0.60 |
| 3193 | 0.60 | 0.96 | 0.65 | 1.32 | 1.55 | 1.63 | 0.58 |
| 3377 | 0.56 | 0.98 | 0.54 | 1.14 | 1.54 | 1.41 | 0.53 |
| 3377 | 0.60 | 0.98 | 0.55 | 1.14 | 1.57 | 1.44 | 0.54 |
| 3379 | 0.72 | 1.03 | 0.60 | 1.23 | 1.76 | 1.65 | 0.60 |
| 3605 | 0.50 | 0.90 | 0.57 | 1.13 | 1.40 | 1.43 | 0.53 |
| 3607 | 0.63 | 1.04 | 0.64 | 1.31 | 1.67 | 1.69 | 0.56 |
| 3608 | 0.61 | 1.01 | 0.60 | 1.24 | 1.62 | 1.62 | 0.56 |
| 3610 | 0.60 | 0.88 | 0.55 | 1.07 | 1.47 | 1.44 | 0.50 |
| 3613 | 0.63 | 0.98 | 0.57 | 1.21 | 1.61 | 1.63 | 0.53 |
| 3640 | 0.58 | 0.94 | 0.59 | 1.21 | 1.52 | 1.52 | 0.56 |
| 3872 | 0.63 | 0.98 | 0.62 | 1.22 | 1.61 | 1.64 | 0.58 |
| 4125 | 0.73 | 1.06 | 0.65 | 1.29 | 1.79 | 1.64 | 0.63 |
| 4261 | 0.73 | 1.03 | 0.61 | 1.29 | 1.76 | 1.83 | 0.60 |
| 4278 | 0.55 | 0.99 | 0.60 | 1.21 | 1.54 | 1.53 | 0.64 |
| 4283 | 0.56 | 0.96 | 0.60 | 1.18 | 1.53 | 1.62 | 0.57 |
| 4365 | 0.71 | 1.04 | 0.61 | 1.28 | 1.74 | 1.71 | 0.64 |
| 4374 | 0.63 | 1.03 | 0.64 | 1.30 | 1.66 | 1.60 | 0.59 |
| 4387 | 0.51 | 0.98 | 0.57 | 1.16 | 1.49 | 1.46 | 0.59 |
| 4406 | 0.59 | 1.02 | 0.57 | 1.26 | 1.61 | 1.65 | 0.58 |
| 4472 | 0.70 | 1.02 | 0.61 | 1.29 | 1.72 | 1.78 | 0.60 |
| 4473 | 0.60 | 0.95 | 0.64 | 1.29 | 1.55 | 1.57 | 0.62 |
| 4478 | 0.45 | 0.89 | 0.55 | 1.17 | 1.33 | 1.48 | 0.55 |
| 4486 | 0.55 | 0.98 | 0.63 | 1.26 | 1.53 | 1.84 | 0.63 |
| 4494 | 0.65 | 0.93 | 0.57 | 1.21 | 1.57 | 1.50 | 0.54 |
| 4550 | 0.39 | 0.95 | 0.58 | 1.22 | 1.34 | 1.54 | 0.62 |
| 4551 | 0.59 | 0.99 | 0.58 | 1.23 | 1.58 | 1.51 | 0.54 |
| 4552 | 0.67 | 1.07 | 0.61 | 1.29 | 1.74 | 1.73 | 0.59 |
| 4564 | 0.63 | 0.95 | 0.61 | 1.19 | 1.58 | 1.63 | 0.57 |
| 4621 | 0.72 | 1.00 | 0.63 | 1.27 | 1.72 | 1.74 | 0.59 |
| 4636 | 0.67 | 1.00 | 0.60 | 1.29 | 1.66 | 1.79 | 0.61 |
| 4649 | 0.71 | 1.04 | 0.62 | 1.29 | 1.75 | 1.81 | 0.62 |
| 5322 | 0.62 | 0.91 | 0.62 | 1.21 | 1.54 | 1.53 | 0.53 |
| 5576 | 0.53 | 0.85 | 0.58 | 1.17 | 1.38 | 1.43 | 0.53 |
| 5813 | 0.64 | 1.01 | 0.65 | 1.33 | 1.65 | 1.55 | 0.61 |
| 5831 | 0.59 | 0.95 | 0.57 | 1.25 | 1.54 | 1.50 | 0.55 |
| 5846 | 0.69 | 1.01 | 0.62 | 1.28 | 1.71 | 1.77 | 0.61 |
| 5866 | - | - | - | - | - | 1.60 | 0.61 |
| 5982 | 0.59 | 0.94 | 0.54 | 1.18 | 1.53 | 1.53 | 0.58 |
| NGC | UB | BV | VR | VI | |
|---|---|---|---|---|---|
| 2768 | 24.25 | 0.455 | 0.851 | 0.530 | 1.110 |
| 2974 | id | 0.335 | 0.835 | 0.000 | 0.000 |
| 3115 | id | 0.365 | 0.855 | 0.580 | 1.180 |
| 3193 | 23.5 | 0.370 | 0.880 | 0.000 | 0.000 |
| 3377 | 24.5 | 0.210 | 0.815 | 0.505 | 1.000 |
| 3377 | 24.25 | 0.175 | 0.795 | 0.480 | 0.950 |
| 3379 | 24.0 | 0.480 | 0.890 | 0.575 | 1.160 |
| 3605 | 23.5 | 0.340 | 0.795 | 0.510 | 1.060 |
| 3607 | 24.25 | 0.370 | 0.845 | 0.530 | 1.130 |
| 3608 | 23.75 | 0.300 | 0.900 | 0.525 | 1.165 |
| 3610 | 24.25 | 0.365 | 0.730 | 0.510 | 0.985 |
| 3613 | 24.5 | 0.395 | 0.830 | 0.500 | 1.130 |
| 3640 | 23.5 | 0.360 | 0.875 | 0.540 | 1.135 |
| 3872 | 24.5 | 0.420 | 0.890 | 0.555 | 1.110 |
| 4125 | 23.5 | 0.405 | 0.830 | 0.550 | 1.120 |
| 4278 | 23.5 | 0.350 | 0.800 | 0.530 | 1.055 |
| 4283 | 23.75 | 0.300 | 0.805 | 0.510 | 1.080 |
| 4365 | 24. | 0.470 | 0.900 | 0.585 | 1.180 |
| 4374 | 23.25 | 0.420 | 0.895 | 0.545 | 1.180 |
| 4387 | 24.5 | 0.350 | 0.860 | 0.550 | 1.140 |
| 4406 | 23.25 | 0.330 | 0.870 | 0.565 | 1.160 |
| 4472 | 23. | 0.490 | 0.930 | 0.590 | 1.255 |
| 4473 | 24.5 | 0.315 | 0.840 | 0.575 | 1.130 |
| 4478 | 24. | 0.200 | 0.750 | 0.490 | 1.090 |
| 4486 | 23.5 | 0.415 | 0.885 | 0.590 | 1.200 |
| 4494 | 24.5 | 0.390 | 0.830 | 0.500 | 1.110 |
| 4550 | 24.0 | 0.120 | 0.700 | 0.470 | 1.010 |
| 4551 | 24.5 | 0.325 | 0.850 | 0.520 | 1.120 |
| 4552 | 24. | 0.390 | 0.880 | 0.515 | 1.120 |
| 4564 | 24.5 | 0.200 | 0.820 | 0.530 | 1.020 |
| 4621 | 24. | 0.390 | 0.370 | 0.565 | 1.175 |
| 4636 | 23.5 | 0.370 | 0.780 | 0.510 | 1.140 |
| 4649 | 23.5 | 0.525 | 0.950 | 0.540 | 1.200 |
| 5322 | 24.25 | 0.315 | 0.785 | 0.520 | 1.110 |
| 5576 | 23.75 | 0.230 | 0.770 | 0.525 | 1.085 |
| 5813 | 24. | 0.410 | 0.910 | 0.575 | 1.175 |
| 5831 | 23. | 0.365 | 0.840 | 0.495 | 1.115 |
| 5846 | 24. | 0.420 | 0.940 | 0.580 | 1.225 |
| 5866 | 24.5 | 0.270 | 0.775 | 0.505 | 1.075 |
| 5982 | 24.25 | 0.365 | 0.820 | 0.500 | 1.100 |
5 Conclusions
New colour-radius relations have been derived for 36 E-type galaxies of the northern Local Supercluster, using UBVRI frames obtained with the 120cm telescope of the Observatoire de Haute-Provence. Four SA0, i.e. NGC3115, 3607, 4551 and 5866 were also observed.
We aimed to take advantage of the large field of the camera to observe the galaxies at larger radii than hitherto feasible, and thus improve the accuracy of colour gradients. The availability of the series of aperture photometry in PP88 and PN94 for most of the sample was also considered an asset towards a more coherent system of colours. It appears indeed that the colour calibrations are improved here compared to previous work, if this can be judged from the quality of correlations between zero point colours in various surveys (see Sect. 4.1)
Two steps in the reduction procedure were thought significant in improving the quality of colour profiles: the first was the adjustment of the FWHM of the PSFs in a given colour set of 5 frames to the best of the five. This allowed us to get significant colours much closer to the galaxy center than otherwise feasible. The second was a careful ”mapping” of the background of each frame, in order to lessen the background fluctuations remaining after the usual flat-fielding procedures. Both these precautions proved successful, and, as a result, the radial range of satisfactory colour measurements was greatly enlarged. Near the galaxy center, it proved feasible to obtain ”central colours”, i.e. colours integrated in the circle , in fair agreement with high resolution data (see Sect. 3.2.7.2 and Table 10).
On the other hand, colours could be obtained at much lower surface brightness (or larger radii) than in previous work. Our colour data extend to , with a median value near in all colours. According to the comparisons in Sect. 4.1, this is 1.5 to 2 magnitudes deeper than in previous work. ”External colours”, refering to the level whenever possible, are published for the first time (see Table 11), and may be useful to give some indications about stellar populations at the outskirts of E-galaxies.
On the other hand, the ”red halo” effect of the camera was found to give enormous errors in VI colours and gradients. These were corrected by a rigorous technique, and results in agreement with ”classical” data were obtained. Considering the VI gradients, one is not happy however to introduce in their evaluation, corrections larger than the quantity to be measured! Besides this specific problem of the red halo of thinned CCD, the far wings of the PSFs have been proven in a recent paper (RM01) to have non negligible effects in the gradients of other colours, and also to vary with the age of mirror coatings. It is not impossible that the UB or UV gradients given here are overestimated by 15-20%, although they are in excellent statistical agreement with the well-known work of Peletier et al. (1990).
Various colour gradients against for a given object are well correlated, generally better than in previous work (see statistics in Sect. 4.1), which is interpreted as due to smaller measuring errors, notably in UB. These improvements in accuracy did not bring out any obvious correlation between gradients and other galaxy properties. A few galaxies have exceptionally steep colour gradients (nearly at ) without sharing other properties.
Colour-colour relations can be built from the present data for several locations in galaxies, such as near center, various fractions of the effective radius , or the ”outermost” measured range around . All these diagrams overlap to form a single stripe with moderate scatter (except for one rather obvious calibration error?). These might prove useful to test theories of old stellar populations and of their host galaxies. Colour-colour diagrams based upon integrated colours have already been used for this purpose (Worthey, 1994).
The UB or UV colours correlate very well with the index, both near the galaxy center and at the effective radius . This seems to rule out any large influence of diffuse dust in the colours and colour gradients in E-galaxies. This was considered likely by Witt et al. (1992) and discussed by Wise and Silva (1996) with inconclusive results. Previous arguments against such an influence were presented in RM00: they were based upon the relative average values of the gradients in various colours, and are reinforced in the present work, since the mean gradients are nearly unchanged, and their errors lessened.
It is well known that, for single-burst stellar populations, colours and line indices depend both on the metallicity and on the age of the system (Worthey 1994; Borges et al. 1995). However, E-galaxies are constituted by a population mix, having age and metallicity distributions which reflect their star formation histories. Therefore a colour-metallicity calibration requires the use of models able to provide those distributions and, consequently, the integrated colours along the galaxy lifetime. Such a calibration will be presented in Paper II.
Acknowledgements.
TPI acknowledges a Fapesp pos-doc fellowship n∘ 97/13083-7.References
- (1) Bender, R., Möllenhof, C., 1987, A&A 177, 71
- (2) Bender, R., Burstein, D., Faber, S.M., 1993, ApJ 411, 153
- (3) Borges A.C., Idiart, T.P., de Freitas Pacheco J.A. et al., 1995, AJ 110, 2408
- (4) Burstein, D., Davies, R.C, Dressler, A. et al., 1988, in Towards Understanding Galaxies at Large Redshift, Ed. R.G. Kron & A. Renzini, Kluwer, Dordrecht.
- (5) Carter, D., 1978, MNRAS 182, 797
- (6) de Vaucouleurs, G., de Vaucouleurs, A., Corwin, H.G.Jr. et al., 1991, Third Reference Catalogue of Bright Galaxies, Springer, New York
- (7) Faber, S.M., Wegner, G., Burstein, D. et al., 1989, ApJSS 69, 763
- (8) Franx, M., Illingworth, G., Heckman, T., 1989, AJ 98, 538 (FIH)
- (9) Goudfrooij, P., Hansen, L., Jorgensen, H.E., et al., 1994, A&AS 104, 179
- (10) Michard, R., Marchal, J., 1994, A&AS 105, 481 (MM94)
- (11) Michard, R., 1999, A&AS 137, 245 (RM99)
- (12) Michard, R., 2000, A&A 360, 85 (RM00)
- (13) Michard, R., 2001, A&A submitted (RM01)
- (14) Peletier, R.F., Davies, R.L., Illingworth, G.D., et al., 1990, AJ 100, 1091
- (15) Poulain, P., 1988, A&AS 72, 215
- (16) Poulain, P., Nieto, J.L. 1994, A&AS 103, 573
- (17) Prugniel, P., Héraudeau, P., 1998, A&ASS 128, 299
- (18) Rubin, V.C., Graham, J.A., Kenney, J.D.P., 1992, ApJ 394, L9
- (19) Rix, H.W., Franx, M., Fisher, D., 1992, ApJ 400, L5
- (20) Trager S.C., Faber S.M., Worthey G. et al., 2000, ApJ 119, 1645
- (21) Vigroux, L., Souviron, J., Lachieze-Rey, M., et al., 1988, A&AS 73, 1
- (22) Wise, M.W., Silva, D.R. 1996, ApJ 461,155
- (23) Witt, A., Thronson, H.A.jr, Capuano, J.M., 1992, ApJ 393, 611
- (24) Worthey, G., 1994, ApJS 95, 107