Crystalline silicate dust around evolved stars††thanks: Based on observations with ISO, an ESA project with instruments funded by ESA Member States (especially the PI countries: France, Germany, the Netherlands and the United Kingdom) and with the participation of ISAS and NASA
This is the second paper in a series of three in which we present an exhaustive inventory of the solid state emission bands observed in a sample of 17 oxygen-rich dust shells surrounding evolved stars. The data were taken with the Short and Long Wavelength Spectrographs on board of the Infrared Space Observatory (ISO) and cover the 2 to 200 m wavelength range. Apart from the broad 10 and 18 m bands that can be attributed to amorphous silicates, at least 49 narrow bands are found whose position and width indicate they can be attributed to crystalline silicates. Most of these emission bands are concentrated in well defined spectral regions (called complexes). We define 7 of these complexes; the 10, 18, 23, 28, 33, 40 and 60 micron complex. We derive average properties of the individual bands. Almost all of these bands were not known before ISO. Comparison with laboratory data suggests that both olivines (Mg2xFe(2-2x)SiO4) and pyroxenes (MgxFe(1-x)SiO3) are present, with x close to 1, i.e. the minerals are very Mg-rich and Fe-poor. This composition is similar to that seen in disks surrounding young stars and in the solar system comet Hale-Bopp. A significant fraction of the emission bands cannot be identified with either olivines or pyroxenes. Possible other materials that may be the carriers of these unidentified bands are briefly discussed. There is a natural division into objects that show a disk-like geometry (strong crystalline silicate bands), and objects whose dust shell is characteristic of an outflow (weak crystalline silicate bands). In particular, stars with the 33.5 m olivine band stronger than about 25 percent over continuum are invariably disk sources. Likewise, the 60 m region is dominated by crystalline silicates in the disk sources, while it is dominated by crystalline H2O ice in the outflow sources. We show that the disk and outflow sources have significant differences in the shape of the emission bands. This difference must be related to the composition or grain shapes of the dust particles. The incredible richness of the crystalline silicate spectra observed by ISO allows detailed studies of the mineralogy of these dust shells, and is the origin and history of the dust.
Key Words.:
Infrared: stars - circumstellar matter - Stars: AGB and post-AGB; mass loss - Planetary Nebulae: general - Dust, extinctionPresent address: F.J. Molster, ESA/ESTEC, SCI-SO, Postbus 299, 2200 AG Noordwijk, The Netherlands
1 Introduction
At the end of their life both low and high mass stars loose a large fraction of their mass in the form of a dense stellar wind. When the temperature in the outer regions of the atmosphere becomes low enough solid material (dust) condenses out of the gas. Mass loss can eventually dominate stellar evolution. Since the dust may also play an important role in the mass loss process, it is interesting to investigate the physical and chemical processes responsible for dust formation. One way to do this is to study the endproducts of this dust formation process. The composition of the dust which has condensed provides valuable information on the conditions when the dust was formed and thereafter.
The dust around stars can be observed at different wavelengths. In the visible and near-infrared (NIR) one can look at the wavelength dependence of the absorption caused by the dust. Another way to investigate the dust at these wavelengths is by means of scattered light of the central source by small dust particles in the circumstellar environment or with polarimetric observations. In this paper we will study the emission of the dust in the mid-infrared (MIR) and far-infrared (FIR).
The dusty environments around evolved stars can be divided in carbon-rich (C-rich) and oxygen-rich (O-rich) environments, depending on the C/O ratio of the mass-losing stars. This division is the result of the stability of the CO molecule, which is formed before the dust condenses. If there is more carbon than oxygen (C/O ) all the oxygen will be trapped in CO, and the dust species will be carbonaceous, e.g. SiC, Polycyclic Aromatic Hydrocarbons (PAHs) or amorphous carbon. If the C/O ratio is smaller than one, i.e. there is more oxygen than carbon, all the carbon is trapped in CO and O-rich dust will be formed, e.g. simple oxides and silicates.
In 1995 the Infrared Space Observatory (ISO; Kessler et al. 1996) was launched which opened the possibility to study mass-losing stars at infrared wavelengths with unprecedented wavelength coverage and spectral resolution. Before the launch of ISO it was generally assumed that in the dusty winds of O-rich evolved stars only amorphous silicates were formed. One of the remarkable discoveries of ISO was the detection of crystalline silicates outside our own Solar System. Their spectral signature was not only found in the spectra of young stars (Waelkens et al, 1996), but also in the outflows of evolved stars (Waters et al, 1996). In the latter case, we even found one example, IRAS09425-6040, where 75% of the circumstellar dust consists of crystalline silicates (Molster et al. 2001).
In contrast to amorphous silicates, crystalline silicates provide a unique opportunity to determine for the first time the chemical composition of the dust particles. The relatively sharp features of the crystalline silicates are very sensitive to compositional changes, this in contrast to the broad and smooth amorphous silicate features. Crystalline silicates will also help us to better understand the physical and chemical conditions under which dust is formed. In particularly, they need high temperatures and a slow cooling down to form.
Crystalline silicates are found in the outflows of evolved stars which replenish the ISM, and also around young stars which form from the ISM (e.g. Waters et al. 1996; Waelkens et al. 1996). However, up to now no crystalline silicates have been found in the ISM. The abundance in the ISM might be too low. However, this would make it difficult to explain the high abundance of crystalline silicates in a young star as HD100546 (Waelkens et al. 1996; Malfait et al. 1998). On the other hand, if the crystalline silicates are destroyed in the ISM then the question arises how they are formed around young stars. Possible solutions to this last problem are given by Molster et al. (1999a; hereafter MYW).
The crystallization process is not well understood and in order to better constrain the origin of these grains, it is important to accurately describe the observed properties in different environments. After the first reports of the crystalline silicates, only a few objects have been analysed in some detail, e.g. HD100546 (Malfait et al. 1998), CPD (Cohen et al. 1999), AFGL4106 (Molster et al. 1999b), IRAS09425-6040 (Molster et al. 2001). This will be the first attempt to obtain an average spectrum of the different crystalline silicate features which are found around evolved stars.
In the first paper of this series (Molster et al. submitted; hereafter paper I) we have described the infrared spectra of 17 sources. Here, we will derive mean spectra based on these sources and identify the different features. In the third paper of this series (Molster et al. submitted; hereafter paper III) we will apply a simple dust emission model to the spectra of our sample and derive several (spectral) trends.
In Section 1 we will briefly summarise how we obtained these mean spectra. For a more extensive description we refer to paper I. The results will be shown in Section 3, where we will also order and define the different solid state bands and complexes found. In Section 4 we will identify most of the features found in Section 3 by comparison to laboratory spectra of cosmic dust analogues.
| FWHM | Identification | complex | |||||
| mean | min | max | mean | min | max | nr | |
| 8.3 | 8.20 | 8.40 | .42 | .41 | .43 | 10 | |
| 9.14 | 9.12 | 9.17 | .30 | .24 | .68 | silica? | 10 |
| 9.45 | 9.45 | 9.46 | .19 | .15 | .25 | 10 | |
| 9.8 | 9.77 | 9.84 | .17 | .14 | .29 | forsterite + enstatite | 10 |
| 10.1 | 9.59 | 10.61 | 2.56 | 1.30 | 3.77 | amorphous silicate | 10 |
| 10.7 | 10.57 | 10.90 | .28 | .11 | .66 | enstatite | 10 |
| 11.05 | 11.04 | 11.06 | .05 | .03 | .11 | instrumental artifact | 10 |
| 11.4 | 11.33 | 11.50 | .48 | .38 | .86 | forsterite, diopside? | 10 |
| 15.2 | 15.00 | 15.42 | .26 | .13 | .73 | enstatite | 18 |
| 15.9 | 15.69 | 16.06 | .43 | .24 | .65 | silica?? | 18 |
| 16.2 | 16.10 | 16.37 | .16 | .08 | .62 | forsterite | 18 |
| 16.50 | 16.49 | 16.50 | .11 | .11 | .11 | PAH? | 18 |
| 16.9 | 16.73 | 17.07 | .57 | .37 | .84 | a blend of 16.7 and 17.0 | 18 |
| 17.5 | 16.79 | 18.46 | 2.10 | .81 | 3.66 | amorphous silicate | 18 |
| 17.5 | 17.43 | 17.61 | .18 | .13 | .36 | enstatite | 18 |
| 18.0 | 17.90 | 18.16 | .48 | .28 | 1.24 | enstatite + forsterite | 18 |
| 18.9 | 18.43 | 19.17 | .62 | .36 | 1.20 | forsterite? | 18 |
| 19.5 | 19.36 | 19.75 | .40 | .14 | .86 | forsterite + enstatite | 18 |
| 22.4 | 22.26 | 22.51 | .28 | .16 | .55 | 23 | |
| 23.0 | 22.82 | 23.14 | .48 | .28 | .72 | enstatite | 23 |
| 23.7 | 23.45 | 23.81 | .79 | .54 | 1.29 | forsterite | 23 |
| 23.89 | 23.88 | 23.90 | .18 | .13 | .25 | 23 | |
| 24.5 | 24.16 | 24.65 | .42 | .16 | 1.04 | enstatite + ? | 23 |
| 25.0 | 24.83 | 25.14 | .32 | .25 | .53 | diopside? | 23 |
| 26.8 | 26.71 | 26.93 | .37 | .21 | .47 | 28 | |
| 27.6 | 27.46 | 27.79 | .49 | .28 | 1.18 | forsterite | 28 |
| 28.2 | 27.97 | 28.45 | .42 | .23 | .90 | enstatite | 28 |
| 28.8 | 28.68 | 28.88 | .24 | .19 | .42 | 28 | |
| 29.6 | 29.37 | 29.90 | .89 | .58 | 1.99 | 2 features?, diopside? | 28 |
| 30.6 | 30.48 | 30.77 | .32 | .18 | .81 | 28 | |
| 31.2 | 31.12 | 31.27 | .24 | .21 | .36 | forsterite? | 28 |
| 32.2 | 32.06 | 32.51 | .46 | .24 | .75 | diopside? | 33 |
| 32.8 | 32.56 | 33.03 | .60 | .36 | 1.00 | 33 | |
| 32.97 | 32.96 | 32.99 | .20 | .11 | .28 | instrumental artifact | 33 |
| 33.6 | 33.45 | 33.71 | .70 | .52 | 1.15 | forsterite | 33 |
| 34.1 | 33.93 | 34.36 | .36 | .17 | .74 | enstatite + diopside? | 33 |
| 34.9 | 34.67 | 35.35 | 1.36 | .63 | 1.88 | clino-enstatite? | 33 |
| 35.9 | 35.76 | 36.20 | .53 | .37 | .88 | ortho-enstatite? | 33 |
| 36.5 | 36.44 | 36.72 | .39 | .25 | .97 | forsterite + ? | 33 |
| 39.8 | 39.44 | 40.36 | .74 | .21 | 2.57 | diopside? | 40 |
| 40.5 | 40.34 | 40.80 | .93 | .53 | 1.53 | enstatite (a blend?) | 40 |
| 41.8 | 41.52 | 42.11 | .72 | .42 | 1.73 | 41 micron plateau | 40 |
| 43.0 | 42.55 | 43.07 | .89 | .51 | 1.59 | cryst. H2O-ice + clino-enst. | 40 |
| 43.8 | 43.30 | 44.05 | .78 | .41 | 3.01 | ortho-enstatite | 40 |
| 44.7 | 44.39 | 45.13 | .58 | .42 | 1.16 | clino-enstatite, diopside? | 40 |
| 52.9 | 51.40 | 56.55 | 3.11 | 1.75 | 5.91 | cryst. H2O-ice | 60 |
| 62. | 61.24 | 65.56 | 11.80 | 4.67 | 15.29 | cryst. H2O-ice (62 micron) + | 60 |
| enstatite?, diopside? (65 micron) | 60 | ||||||
| 69.0 | 68.79 | 69.15 | .63 | .46 | 1.04 | forsterite | 60 |
| 13.5 | 13.40 | 13.60 | .25 | .17 | .44 | responsivity | N |
| 13.8 | 13.74 | 13.90 | .20 | .16 | .23 | enstatite, responsivity? | N |
| 14.2 | 14.15 | 14.28 | .28 | .18 | .55 | enstatite, responsivity? | N |
| 20.7 | 20.54 | 20.84 | .31 | .16 | .84 | silica?, diopside? | N |
| 21.5 | 21.35 | 21.65 | .35 | .15 | .79 | N | |
| 26.1 | 25.91 | 26.29 | .57 | .22 | 1.10 | forsterite + silica? | N |
| 38.1 | 37.83 | 38.21 | .57 | .56 | .61 | N | |
| 47.7 | 47.55 | 47.83 | .97 | .78 | 1.85 | FeSi?, a silicate | N |
| 48.6 | 48.34 | 49.07 | .61 | .44 | 1.37 | a silicate | N |
| 90.9 | 89.59 | 91.12 | 14.44 | 12.72 | 17.63 | N | |
| Bandname |
8.3 |
9.1 s? |
9.5 |
9.8 f,e |
10 (am.) |
10.7 e |
11.4 f,d? |
15.2 e |
15.9 s? |
16.2 f |
16.9 |
17.5 e |
18 (am.) |
18.0 f,e |
18.9 f? |
19.5 f,e |
20.7 s?,d? |
21.5 |
22.4 |
23.0 e |
23.7 f |
23.89 |
24.5 e |
25.0 d? |
26.1 f,s? |
26.8 |
|---|---|---|---|---|---|---|---|---|---|---|---|---|---|---|---|---|---|---|---|---|---|---|---|---|---|---|
| IRAS09425 | ? | + | + | + | + | + | + | + | + | + | + | + | + | + | + | + | + | |||||||||
| NGC6537 | + | + | + | + | + | + | + | + | + | + | + | + | ||||||||||||||
| NGC6302 | + | + | + | + | + | + | + | + | + | + | ||||||||||||||||
| MWC922 | x x | - | - | + | 2 | + | - | + | + | + | + | + | + | + | + | + | + | + | + | |||||||
| AC Her | + | + | + | + | + | + | + | + | + | + | + | + | ? | + | + | + | + | + | + | x x | + | + | + | |||
| HD45677 | + | + | + | + | + | + | + | + | + | + | + | + | + | + | + | + | + | + | + | + | + | + | + | + | ||
| 89 Her | + | + | + | + | + | + | + | + | + | + | + | + | + | + | + | + | + | x x | ||||||||
| MWC300 | - | + | + | - | + | + | + | + | + | + | + | + | + | + | ||||||||||||
| VY 2-2 | + | + | + | x x x | x x | |||||||||||||||||||||
| HD44179 | + | + | + | ? | + | + | + | + | + | + | + | + | + | + | ||||||||||||
| HD161796 | + | + | + | + | + | + | + | + | + | + | + | + | + | + | + | |||||||||||
| OH26.5+0.6 | - | - | - | - | - | - | - | - | - | - | - | - | x x | - | - | - | - | - | ||||||||
| Roberts 22 | x x | ? | ? | + | ? | ? | ? | + | + | x x x x x | o | |||||||||||||||
| HD179821 | + | x x | + | + | x x | + | + | + | + | + | x x | + | ||||||||||||||
| AFGL4106 | + | x x | + | + | + | + | + | + | + | + | + | + | + | + | + | |||||||||||
| NML Cyg | - | + | + | + | + | ? | + | + | + | + | + | + | + | o | ||||||||||||
| IRC+10420 | + | + | + | ? | + | + | + | + | + | + | x x x | + | + | + | + | + | + | |||||||||
| Bandname |
27.6 f |
28.2 e |
28.8 |
29.6 d? |
30.6 |
31.2 f? |
32.2 d? |
32.8 |
32.97 i |
33.6 f |
34.1 e,d? |
34.9 ce? |
35.9 oe? |
36.5 f |
39.8 d? |
40.5 e |
41.8 |
43.0 w,ce |
43.8 oe |
44.7 ce,d? |
47.7 si |
48.6 si |
52 w |
62 w,d |
69.0 f |
91 |
| IRAS09425 | + | + | + | + | + | + | + | + | + | + | + | + | + | + | + | + | + | |||||||||
| NGC6537 | x x | + | + | + | + | + | + | + | x x | + | + | + | + | + | + | + | + | + | + | + | + | + | ||||
| NGC6302 | + | + | + | + | + | + | + | + | + | + | + | + | + | + | + | + | + | + | + | + | + | + | + | + | ||
| MWC922 | + | + | + | + | + | + | + | + | + | x x | + | + | + | + | + | + | + | x x | + | + | + | |||||
| AC Her | + | + | + | + | ? | + | + | x x | x x | x x | + | |||||||||||||||
| HD45677 | + | + | + | + | + | + | + | x x | x x | + | + | + | + | + | + | |||||||||||
| 89 Her | + | + | ? | + | + | x x | ||||||||||||||||||||
| MWC300 | x x | + | + | + | + | + | + | + | x x x | + | x x x | |||||||||||||||
| VY 2-2 | + | + | + | + | + | + | + | + | + | x x x | + | + | + | |||||||||||||
| HD44179 | + | + | + | + | + | + | + | + | + | + | + | + | + | x x | + | + | + | |||||||||
| HD161796 | + | + | ? | + | + | + | + | + | + | + | x x | + | + | + | + | ? | x x | + | 2 | + | ||||||
| OH26.5+0.6 | + | x x x x | + | + | + | + | + | + | + | + | + | x x | + | + | + | |||||||||||
| Roberts 22 | + | + | + | o | + | + | + | + | x x | x x | + | + | + | + | ? | + | ||||||||||
| HD179821 | + | + | + | + | + | + | + | + | + | + | + | + | + | + | + | + | + | + | + | + | ||||||
| AFGL4106 | + | + | o | o | + | + | + | + | + | + | + | + | + | + | + | + | + | + | x x | + | ||||||
| NML Cyg | o | o | o | o | + | + | + | + | + | + | + | + | x x | + | + | + | + | x x | + | + | ||||||
| IRC+10420 | + | + | o | + | + | + | + | + | ? | + | + | + | + | + | + | + | + | |||||||||
2 The derivation of the mean spectra.
2.1 The sample
We have selected 17 evolved stars which all showed the presence of crystalline silicates in their infrared spectra. These 17 sources covered a wide range in evolutionary status. The list included 2 AGB stars (OH26.5+0.6 and IRAS 09425-6040), 5 post-AGB stars (HD44179, 89 Her, AC Her, Roberts 22 and HD161796), 3 planetary nebula (NGC6537, NGC6302 and VY 2-2), three massive stars (IRC+10420, AFGL4106 and NML Cyg) and 4 objects with poorly known evolutionary status (MWC922, MWC300, HD45677 and HD179821). An extensive discussion of the individual stars and their spectra can be found in Paper I (Molster et al. 2002a).
For all stars in this sample, spectra were taken with the Short Wavelength Spectrometer (SWS; de Graauw et al, 1996) on board ISO and for most of them we also got spectra taken by the Long Wavelength Spectrometer (LWS; Clegg et al. 1996).
As we will show later in this paper, there is a clear difference in the spectra of stars which (are expected to) have a disk and those who have not. This difference is seen not only in the strength of the features (MYW), but as we will demonstrate also in the shape and position of the features (see below and Molster et al. 2002b, hereafter Paper III). Therefore, we have decided to divide our sample accordingly into 2 groups. 10 stars in our sample belong to the ‘disk’ sources and 7 stars belong to the ‘non-disk’ or ‘outflow’ sources.
Although the spectral shape of the different complexes is different for the disk and the outflow sources, the individual bands are present in both type of classes (although in different strength ratios!). The average FWHM (full width at half maximum) and position of individual bands is therefore determined based on the complete sample and no discrimination has been made between disk and outflow sources.
2.2 Mean complex spectra
For all stars we defined a continuum, which we subtracted from the data to obtain a better view of the dust features; see Paper I for more details on how we derived the continuum. The resulting continuum subtracted spectra were used to determine the mean complex spectra.
In the (continuum subtracted) spectra of the stars, we can identify 7 different complexes in which multiple components can be identified; some of which are severely blended. These complexes are found near 10, 18, 23, 28, 33, 40 and 60 m, and named after their position, resp. the 10, 18, 23, 28, 33, 40 and 60 micron complexes.
In order to get a reference spectrum for the different complexes we have derived ‘mean’ spectra for each complex. The mean complex spectra were derived for both the outflow and the disk-sources separately. In order to obtain these mean complex spectra we have extracted each complex from all the continuum subtracted spectra. The complexes of the stars belonging to one group (disk or outflow sources) were added, using a weighing factor proportional to the S/N of that part of the spectrum, to create a ‘mean’ spectrum (see Paper I for more details).
3 Results for the complexes
In this section we will systematically discuss the general trends in the spectra of our program stars, by sub-dividing the sample into disk-sources and outflow-sources, and by dividing the spectra into the different complexes: the 10, 18, 23, 28, 33, 40 and 60 micron complex. Because of the low dust temperature of most sources and therefore low flux levels below 7 m and the absence of crystalline silicate features in this wavelength range, we decided to limit our investigation to wavelengths longwards of 7 m.
First, we will give an overview of the results that apply to the whole sample. Then, we will discuss the different complexes individually, after which we will identify many of the features. In the discussion of the different complexes and features, we will refer to feature names as xx micron features and to wavelength positions as yy m, e.g. the 30.6 micron feature of IRAS09425-6040 is located at 30.48 m (Paper I).
In Table 1, we have grouped all features seen in at least 2 stars and indicated their wavelength and FWHM limits. In principle, we assigned one feature to one spectral structure. If in at least two stars a spectral structure was split into two different components, we assigned two features to it. If in other stars these two features could not be separated we assumed them to be heavily blended and measured them together. The one exception is the 16.9 micron feature. In MWC 922 it was found to be split into two different components, while in all other stars it was blended. We allowed the features to show a small shift in wavelength position. The ranges in shifts are indicated in Table 1 by and . This method leads to a minimum number of features to analyse all spectra. Measured blends and uncertain features were not taken into account for the values in Table 1.
In the same table we also report to which mineral the feature could be traced; This will be discussed extensively in Section 4. We decided not to discuss the C-rich features which are found in many of the disk sources.
The mean spectra of the different complexes are shown in Fig. 1 to Fig. 7. In the next subsections we discuss these different complexes for all stars. We point out that the individual disk source and outflow source spectra show significant source to source variations in shape and strength of the spectrum. Nevertheless, clear trends can be seen that are most obvious in the mean spectra.
Table 2 gives a schematic quick-look overview of what features are found in what star. We indicate by using different symbols the blends and the features which are uncertain. The order of the stars is in decreasing strength of the blend of the 33.6 micron feature.
3.1 10 micron complex (7 – 13 m)

In Fig. 1 the mean 10 micron complexes are shown. The mean disk spectrum is only based on the 3 stars which show an O-rich dust spectrum in this area, AC Her, HD45677 and 89 Her. All other disk sources have contributions of carbon-rich material. The mean outflow spectrum is based on the outflow sources which show the silicates in emission, i.e. we have not used the absorption spectra of NML Cyg and OH26.5+0.6, because they have too strong absorption in this wavelength range. The mean outflow spectrum is dominated by a broad feature, that peaks at about 10.6 m.
In the mean disk spectrum, several narrow features are found, at 8.3, 9.14, 9.45, 9.8, 10.7, 11.05 and 11.4 m. We note that it is likely that there is an underlying broad band in the 10 micron complex spectra of the disk sources. Its shape and peak position seem somewhat different from that seen in the outflow sources. However, we want to stress that significant source to source variations are apparent in the individual spectra (see Paper I).
3.2 18 micron complex (15 – 20 m)

In Fig. 2, the mean 18 micron complexes are shown for the disk and outflow sources. OH26.5+0.6 has both the amorphous and crystalline silicates in absorption in the 18 micron complex. Therefore, we have excluded this star from the mean spectrum. Also NML Cyg shows the amorphous silicate in absorption in the 18 micron complex, although the crystalline silicates seem already in emission we have neglected this star for the mean outflow spectrum too. Excluding the two high flux, high S/N sources IRC+10420 and AFGL4106, did not modify the average significantly. We note that some residual fringing is still visible in the average profile.
The 18 micron complex can be divided into narrow features at 15.2, 15.9 (with a shoulder at 16.2), 16.5, 16.9, 17.5, 18.0, 18.9 and 19.5 m. In both classes, the same narrow features are found. In all sources, there are at least indications for the presence of amorphous silicates. However, the outflow sources show a smoother complex due to the larger abundance of amorphous silicates (see also MYW). The presence of the crystalline silicates (the narrow peaks) are most prominent in the disk-sources. Note the weakness or absence of the 19.5 micron feature in the outflow sources.
The 18.1 micron feature might be a blend of 3 features. There is an indication for this in the spectrum of HD44179. The triple structure found in this spectrum is seen in all datasets available for this object. Also the mean spectrum has a hint of these three features, indicating that they might be weakly present in the individual spectra, close to the detection limit.
3.3 23 micron complex (22. - 25.5 m)

The mean 23 micron disk and outflow complexes are shown in Fig. 3. The source OH26.5+0.6 still shows an absorption spectrum in the 23 micron complex for both the amorphous and crystalline silicates, therefore we have neglected this source for the calculation of the mean outflow spectrum.
The complex is much less influenced by the presence of amorphous silicates and the crystalline silicate bands are more prominent both for the disk and outflow sources. The complex can be divided into 6 (blending) features at 22.4, 23.0, 23.7, 23.9, 24.5 and 25.0 m. These last two features form the 25 micron plateau. The 23.9 micron feature is only seen in the spectra of MWC 922, AC Her and OH26.5+0.6 (see Table 2 and Paper I). In the latter object, it is present in absorption.
The main difference between the mean complexes of the disk and the outflow sources is the relative strength of the 23.7 micron feature compared to the 23.0 micron feature, which is higher in the disk sources than in the outflow sources. We note that variations exist from source to source within each group.
Another difference is that the spectra of disk sources show a strong 24.5 micron feature in the 25 micron plateaus, while the spectra of outflow sources do not. A third difference is the steep rise of the 23.0 micron feature, present in most outflow sources, but not in the disk sources. Finally, we note that in almost all outflow sources there is a sharp drop around 22.5 m, while this is not found or at least much less prominent in the disk sources.
3.4 28 micron complex (26.5 – 31.5 m)

In Fig. 4, we show the mean 28 micron complexes for both the disk and outflow sources. For 4 sources, complete wavelength coverage was not available. These stars (Roberts 22, AFGL4106, NML Cyg and IRC+10420) have therefore not been taken into account in the mean disk and mean outflow spectra. This especially influences the mean outflow spectrum, since, apart from the 3 sources without a complete wavelength coverage, there is one source which goes from absorption into emission around these wavelengths and 2 sources are severely affected by noise. Therefore the mean outflow spectrum in this wavelength region should be treated with caution. This wavelength range is dominated by SWS band 3E (m), whose flux and relative spectral response calibration are somewhat more uncertain than for the other bands. Nevertheless, our large sample permits us to draw conclusions about the features present in this wavelength range.
This complex is built up from features at 26.8, 27.6, 28.2, 28.8, 29.6, 30.6 and 31.2 m. The 29.6 m feature might be a blend itself, as indicated by the large variation in the peak position (Table 1). However, one should be careful since there is an SWS band edge in the same region.
The 29.6 and 30.6 micron features seem related to each other. A strong 30.6 micron features corresponds to a strong 29.6 micron feature and vice versa.
3.5 33 micron complex (31.5 – 37.5 m)

In Fig. 5, the 33 micron complexes are shown. The shape of this complex bears similarities to the shape of the 23 micron complex. Waters et al. (1996) noted the presence of 3 main components: at 32.8 m, at 33.7 m and a plateau extending up to 37 m, hereafter called the 35 micron plateau. However a closer look reveals much more structure. This is most clearly seen in the spectrum of NML Cyg (see Paper I). There is a weak feature at 32.2 m. The 33.7 micron peak is split into at least two features, peaking around 33.6 and 34.1 m. Since these two features are seen in both the AOT01 and the AOT06 data of NML Cyg and in the spectra of HD179821 and AFGL4106 (see Paper I) we are convinced that these structures are real. The plateau shows some structure around 36 m. It seems that it can be split into three features, at 34.9, 35.9 and 36.5 m. These features are in most cases severely blended and just produce one broad feature (the 35 micron plateau).
In the infrared bright outflow sources, the 32.97 micron feature dominates, with IRC+10420 as the extreme case (see Paper I), while in the disk sources the 32.8 micron feature is relatively strong, with AC Her as the extreme case (Paper I). However, the 32.97 micron feature coincides with a feature in the responsivity curve. It is most prominently seen in the high flux sources and in our sample the outflow sources are on average much brighter than our disk sources. For comparison we also checked the bright C-rich source CRL2688, which also shows the 32.97 m feature. It is also seen in the spectrum of other bright objects such as in Orion (Wright et al. 2000). This suggests a flux-dependent shape of the band 4 responsivity curve, probably related to band 4 memory effects. We conclude that the 32.97 micron feature is instrumental.
We note that the features seem sharper for the outflow sources than for the disk sources. The (post-)Red Supergiants, which have the highest luminosity and mass loss rates, seem to have the sharpest peaks. Why this is not the case for the other complexes is not clear yet.
The detailed shape of the plateau, especially at the short wavelength side, is somewhat difficult to determine due to the presence of the strong bands between 32.5 and 34.0 m. The red edge of the plateau falls at 36.5 – 37 m. This seems correlated with the sharpness of the strong bands in this complex. In the sources with the sharpest bands the plateau extends to 36.5 m, while in most other sources the plateau extends to 37 m.
The apparent difference between the disk and outflow sources in the strength ratio of the 32.8 and 33.6 micron features is totally due to the (post-)Red Supergiants, since the low mass sources show about the same strength ratio as the disk sources. It might be a good discriminator between (post-)AGB stars and (post-)Red Supergiants.
3.6 40 micron complex (38 – 45.5 m)

The mean 40 micron complexes (shown in Fig. 6) have 3 prominent features, one at 40.5 m and the often blended features at 43.0 and 43.8 m. In addition to these main features, there is a ‘plateau’ visible from about 41 to 42.3 m, hereafter called the 41 micron plateau, which is probably a blend of features, which could not be separated. Furthermore, at the short wavelength side of the 40.5 m feature, a shoulder is often seen around 39.7 m and a weak feature is present at 44.7 m at the long wavelength side of the 43.8 micron feature .
The main difference between the outflow- and the disk-sources is seen in the strength of the 43.0 and 43.8 micron features. In the outflow sources, the 43.0 micron feature is often stronger and at least equally strong to the 43.8 micron feature, whereas in the disk-sources the 43.8 micron feature often dominates the 43.0 micron feature.
Another difference between the disk and outflow sources is the blue edge of the 40.5 micron feature. In the outflow sources it has a more gentle slope and it meets the continuum at wavelengths shortwards of 39.0 m, while in the disk sources the slope is much steeper and ends usually at wavelengths longwards of 39.0 m.
3.7 60 micron complex (50 – 72 m)

For this part of the spectrum, not all sources were thoroughly reduced. Therefore, we will only mention the global trends and not go into details. The 60 micron complex (shown in Fig. 7) consists of a broad band peaking at 60 – 65 m with a shoulder at 52 micron. In all disk sources, except for Roberts 22 (see Paper I), we find a prominent and sharp 69 micron feature, while this feature is much less prominent in the outflow sources. It is interesting to note that Roberts 22 also shows similarities to outflow sources in other respects, i.e. low crystalline over amorphous ratio (see MYW).
There are indications of a feature at 57 m, but this has not been measured separately. The strong, narrow peak seen at 63.18 m is due to the fine-structure transition of [O I].
Disk and outflow sources differ in the peak position of the 60 – 65 micron band. In the outflow sources, it generally peaks around 62 m, while in the disk-sources it peaks at about 65 micron (with Roberts 22 as the exception). The shift to longer wavelengths seems related to a decreasing 52 micron shoulder, and increasing strength of the 29.6 and 30.6 micron features.
3.8 Remaining features

In Fig. 8, we show the mean spectra of the other features which were not attributed to one of the complexes. Some of these features tend to appear in most stars (C-rich and O-rich) and always in emission like the ones at 11.05, 13.6 (with a shoulder at 13.8) and 14.2 micron and are therefore believed to be (partly) instrumental. The strength of these features differs from source to source. However, it should also be noted that in some C-rich stars some of these features are seen up to 50% times the continuum level, which is far more than expected for an instrumental artifact. In these cases the features are attributed to PAHs (Tielens et al. 1999). For most of our sources however, we can exclude this possibility, since there is absolutely no evidence for PAHs at shorter wavelengths, which should be prominent if PAHs are present.
Real features are present at 20.7, 21.5, 26.1, 47.7 (with a shoulder at 48.7) and 91 m.
The objects HD45677 and OH26.5+0.6 both show a feature around 38 m (see Paper I). The width of these two features is quite similar, but the peak positions differ about 0.4 m. Because of the wavelength difference and because it is not seen in any of the other stars in our sample, makes us doubt its reality.

4 Identification
In this section, we will first discuss some of the laboratory measurements of crystalline silicates that may be present in circumstellar shells. Waters et al. (1996) identified most of these features with olivines (Mg2xFe(2-2x)SiO4) and pyroxenes (MgxFe1-xSiO3), with . It turned out that the best match with the observed features was found for (see also Section 4.8); i.e. the minerals forsterite (Mg2SiO4) and enstatite (MgSiO3). We will show the similarities and the differences between different laboratory data sets of these materials. The origin of these differences will be discussed. Finally, we will discuss the identification for the different features per complex.
4.1 Laboratory measurements of crystalline silicates
In order to understand and identify the different features, which were found in the infrared spectra of the dust around evolved stars, good laboratory spectra are necessary. Most laboratory spectra do agree on a global scale, but detailed comparison often reveals quite some differences. In Fig. 9, 10 and 11, we show different laboratory results for materials with the same bulk composition. It is clear that, although the average trends are very similar, there are significant differences in the details; e.g., strength ratios.
The general trend in the 3 data sets of forsterite (taken from Jäger et al. 1998, Koike et al. 1993 and Koike et al. 1999) in Fig. 9 is the same. Forsterite has two strong features in the 10 micron region, two prominent features in the 18 micron region, a strong band in the 23 micron complex and a strong band in the 33 micron complex. Furthermore, there is a weaker contribution in the 28 micron complex. A more detailed examination reveals quite some differences between the laboratory data sets. Peak positions are not identical, this might be a grain shape effect, since the position (and shape) of the forsterite features are grain shape dependent. In particular, the difference in the peak position of the 23.7 micron feature for spherical particles and for a continuous distribution of ellipsoids is almost 1 m. Therefore small differences between the laboratory spectra and the ISO spectra can be expected and do not lead automatically to a rejection of the proposed identifications. The Jäger et al. data set of forsterite shows extra features at 9.3, 40.7 and 43.3 m. These are probably due to enstatite inclusions. The measured absolute and relative strength of the features also differ. Note that we rescaled the Jäger et al. data by a factor 2, in order to match the other studies. At the moment, the origin of this difference is unclear, but introduces substantial uncertainties in the derived relative abundances (paper III).
For enstatite there are two crystallographic configurations, the rhombic structure (ortho-enstatite) and the monoclinic structure (clino-enstatite). On Earth, ortho-enstatite is most common, but enstatite found in meteorites and produced via melting in laboratories is often of the clino-enstatite type. The structure of the enstatite grains is related to its thermal history, which makes them in principle a suitable candidate to explore the dust conditions when these grains were formed. Below 40 m, there is not much difference between the spectra of clino- and ortho-enstatite. The main differences are found in the 40 and 60 micron complexes.

In Fig. 10, we plot the mass absorption coefficients of clino-enstatite derived from three different laboratory samples (Jäger et al. 1998; Koike & Shibai 1998 and Koike et al. 1999). Again, the general trend is very similar: a lot of structure in the 10 micron complex, at least 7 different features can be found here, a strong feature peaking slightly longwards of 19 m and decreasing to longer wavelengths with a lot of substructure. Enstatite has several modes in the 40 micron complex, where forsterite is relatively smooth. In this wavelength region, it also becomes possible to distinguish between clino- and ortho-enstatite, which is very difficult below 40 m, and this spectral region provides a prime probe for enstatite particles. Unfortunately, the data sets do not agree in this wavelength region. The sample preparation of the Jäger 1998 sample is likely responsible for the absence of the 44.7 micron feature in their data (Jäger, private communication). A careful examination of the ISO spectra with the laboratory data convinced us that the Koike 1999 data set (Koike et al. 1999) best represents the features found in our ISO spectra.
The spectrum of ortho-enstatite (Fig. 11; data from Jäger et al. 1998, Koike & Shibai 1998 and Koike et al. 1999) is a clear example why the purity of the laboratory samples always should be checked. The data from Jäger et al. (1998) is contaminated by talc, producing various spurious features. Up to 40 m, the ortho-enstatite is very similar to the clino- enstatite. The feature at 33.0 m in the Koike 1993 data set (Koike et al. 1993) could not be reproduced by other measurements and is therefore not believed to be real. Therefore, the identification of ortho-enstatite to the 32.8 micron feature by Waters et al. (1996) is reconsidered.

Diopside (MgCaSi2O6) is another silicate with possible astrophysical relevance. This material shows peaks at 19.5, 20.6, 25.1, 29.6, 32.1, 33.9, 40.1, 44.8 and 65.7 m. In Fig. 12, we show two laboratory measurements of this material (Data from Koike et al. 1999 and Jäger private communication). Again differences are found between these two data sets, especially around 30 m.

These four examples show that one should be careful when applying a data set from the literature, especially if it has not been checked on chemical homogeneity, particle size and shape distribution. The homogeneity is not only important for the natural samples, which often contain inclusions of other materials (see e.g. Jäger et al (1998)), but synthetic samples are also not always homogeneous.
It is important to realize that differences in the formation history of the minerals may lead to different structures and IR spectral characteristics. Enstatite crystals which are formed from the vapour phase in a low density hot gas environment often produce structures in which one of the crystallographic axes is severely depressed (Bradley et al. 1983 and references therein). This is thought to be the situation in the outflows of mass losing stars. Therefore the absence or weakness of one of the laboratory bands in the stellar spectrum might be related to this phenomenon.
In the following subsection, we will use the Koike 1999 data set for the identifications, since that is thought to be the best and purest. However, one should realize that small wavelength shifts (2%) are found between the different laboratory samples, all of them claimed to be pure forsterite. Small defects in the ordering of the atoms might cause these differences. It is likely that similar differences are also found for the grains in space. One should also realize that the laboratory data sets were measured at room temperature, while most dust grains are much colder. A lower dust temperature often shifts the wavelengths of the peaks to shorter wavelengths and strengthen the features (see e.g. Henning & Mutschke 1997, Bowey et al. 2000).
4.2 10 micron complex (7 – 13 m)
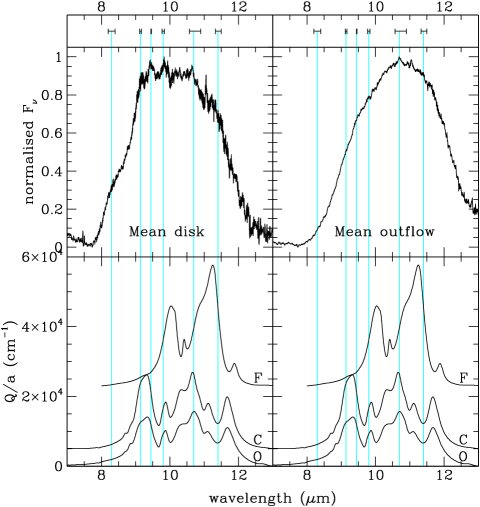

In Fig. 13, we show the mean disk and outflow source spectra together with the Koike 1999 data sets. We subtracted a continuum from these data sets, in the same way as we did for the infrared spectra of our sources, in order to get a better comparison between the laboratory and ISO data. This continuum subtracted data set is also used in the other complexes. Note the similarities between the clino and ortho-enstatite samples.
The broad feature in the 10 micron complex is thought to originate from amorphous silicates. This feature peaks at a relatively long wavelength (for both the average disk and outflow 10 micron complex) compared to the interstellar medium amorphous silicate absorption feature (which is at 9.7 m). This can be an indication for the presence of large grains in the dust around evolved stars (see e.g. Molster et al. 1999b). In Fig. 14 we show this effect for spherical olivine grains (MgFeSiO4; Dorschner et al. 1995). Note the shift in peak position and the broadening with increasing grain size. Besides grain size, the peak position and width of a feature can also be influenced by compositional changes (see e.g. Tielens 1990; Dorschner et al. 1995; Demyk et al. 1999). The redder peak position of the outflow sources is therefore probably not simply due to the presence of larger grains. NB, it is the disk sources which do show evidence for very large grains (see e.g. Molster et al. 1999a).
In the mean disk spectrum, several sharp features are present which might be identified with crystalline silicates. The forsterite feature, found in the laboratory data at 11.3 m, is slightly red-shifted, while the other strong forsterite feature, at 10.0 m in the laboratory data, is blue-shifted. These shifts are within the differences seen between the different laboratory data sets. According to the laboratory data enstatite would peak between and around the forsterite peaks, causing a severe blend of the features which hampers identification of the separate features. The strong band at 9.3 m in the enstatite laboratory data seems split into two components in the stellar spectrum. A hint of this splitting is already seen in the laboratory data. The 10.7 micron band in the ISO data coincides nicely with one of the strongest enstatite bands. In the mean disk spectrum, the 11.4 micron band is likely a blend of enstatite (at 11.7 m) and the strong forsterite feature (at 11.3 m). This blend might also explain the (apparent) red-shift of the forsterite band in our ISO-data.
4.3 18 micron complex (15 – 20 m)
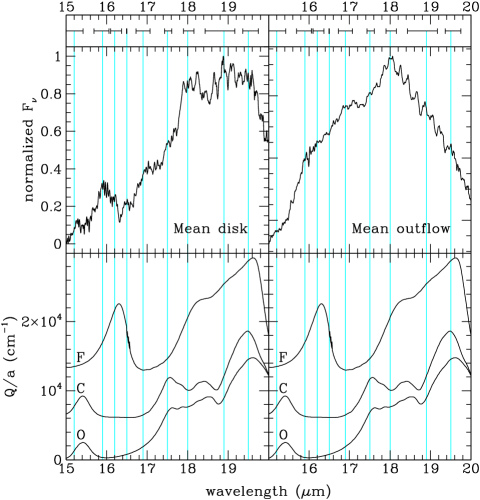
The mean spectra of the 18 micron complex are shown in Fig. 15 together with the laboratory spectra of forsterite and both types of enstatite. Note that the difference between clino and ortho-enstatite is only marginal, implying that these two forms cannot be distinguished in this wavelength region.
Forsterite shows features around 16.3, 18.2 and 19.6 and a shoulder at 19.0 m (Jäger et al. 1998; Koike et al. 1999;), while enstatite shows features around 15.4, 17.6, 18.5 and 19.5 m (Jäger et al. 1998; Koike et al. 1999). The laboratory data of these silicates are only slightly shifted from the peak positions found in our ISO-data. Because all expected peaks are found, not only in this wavelength range but also in the other complexes, the identification of enstatite and forsterite is unambiguous. However, the peak strength of the features is not as expected. According to the laboratory data the peak at 19.5 m should have been by far the strongest feature in this complex. This is not observed and cannot be explained by temperature effects. Since there are also unidentified features at 16.0 and 16.9 m it is likely that more dust components are present. These dust species might also contribute at other wavelengths in this complex and therefore change the apparent strength ratios of the different features. In particular, the 18.1 and 18.9 micron features likely have a component underlying the forsterite and enstatite features.
The 16.5 micron feature is only seen in two stars (NGC6537 and HD44179, see Paper I), which both show PAH emission at the shorter wavelengths. There is a known PAH feature at about 16.4 m (Van Kerckhoven et al. 2000), so we tentatively identify this feature with PAHs.
4.4 23 micron complex (22 – 25.5 m)
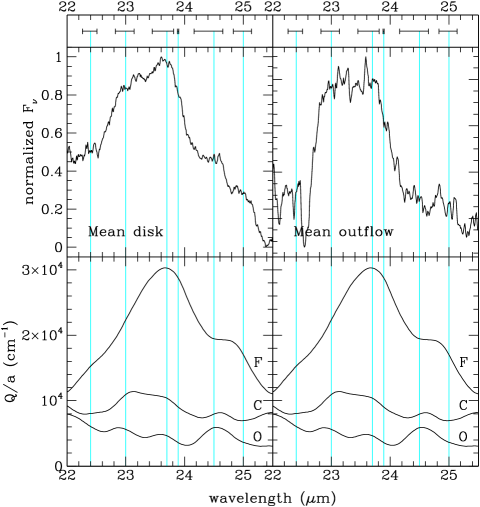
The mean spectra of the 23 micron complex are shown in Fig. 16 together with the laboratory spectra of forsterite and both types of enstatite. Clino and ortho-enstatite show similar weak spectral structure, but the strength ratio of the peaks is reversed.
Both forsterite and enstatite have solid state bands in this wavelength range. These two components can account for some of the observed structure. The 23.7 micron feature has been attributed to forsterite, while the 23.0 and 24.5 micron features coincide with enstatite features. However, since the strength of these two bands are not correlated (in the outflow sources the 24.5 micron feature is weak and the 23.0 micron relatively strong) it is expected that, at least one, of these two features has a contribution from another dust species.
The 22.4 and 25.0 micron features still lack identification, they seem not to be correlated with the other features in this complex. In most outflow sources we see a drop around 22.5 m. Since absorption at these wavelengths is not expected (for most sources), it is either caused by emission features at both sides, or due to responsivity. Since it is not seen in the disk sources and the two emission features are found in several sources, we attribute the 22.5 m drop to the narrowness of the crystalline silicate features in the outflow sources.
4.5 28 micron complex (26.5 – 31.5 m)
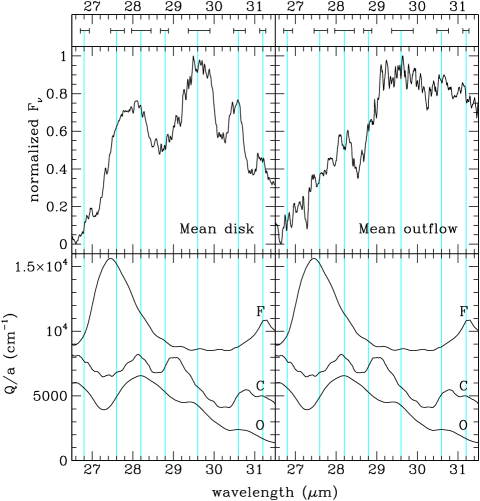
The mean spectra of the 28 micron complex are shown in Fig. 17 together with the laboratory spectra of forsterite and both types of enstatite. In this complex the spectra of ortho and clino-enstatite start to deviate slightly from each other.
Laboratory measurements show that forsterite has two features in this wavelength range: a strong band at 27.5 m and a weaker ( of the 27.5 m) feature at 31.2 m. This second feature seems to disappear if Fe is included in the lattice structure (see Jäger et al. 1998; Koike et al. 1993). The spectrum of NGC6537 (see Paper I) is remarkable in this respect, since it does show the typical forsterite features and even a 69.0 micron feature (indicating that the forsterite is very magnesium rich, (Sec 3.7 and Jäger et al. 1998), while there is no indication of a 31.2 micron feature. It is even more remarkable considering the fact that the spectrum of NGC6537 is very similar to that of NGC6302 (Paper I) which shows the most prominent 31.2 micron feature in our sample. This raises some doubt about the forsterite identification of the 31.2 micron feature in the ISO spectra and we leave this to future research.
The 28.2 micron feature, often blended with the 27.5 micron feature, is most likely due to enstatite, although it is not clear why there is no evidence for an almost equally strong 26.5 micron feature, which is seen in the laboratory transmission spectra (Jäger et al. 1998; Koike et al. 1999). The weak 26.9 and 28.7 micron features as well as the relatively strong 29.6 and 30.6 micron features are not well described by forsterite and/or enstatite. For the latter two features this is very clear in the fit to the spectra of NGC6537 and NGC6302 (Paper III). The strength of 29.6 and 30.6 micron features are correlated. This would imply that they are originating from the same dust species. No identification has been made yet.
4.6 33 micron complex (31.5 – 37.5 m)
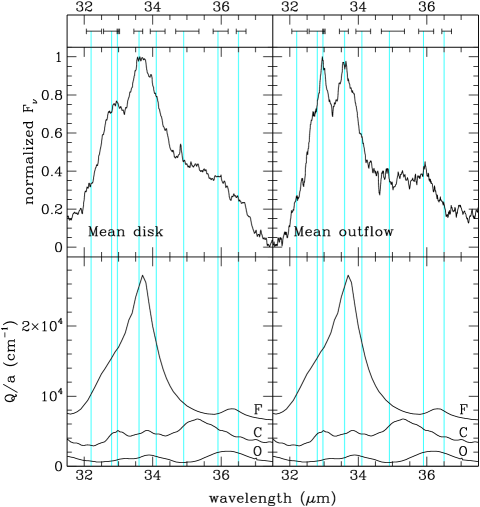
The mean spectra of the 33 micron complex are shown in Fig. 18 together with the laboratory spectra of forsterite and both types of enstatite. There is a small shift between the clino and ortho-enstatite features, which is most clear for their peak around 36 m.
Both forsterite and enstatite have features in this wavelength range. The band at 33.6 m is identified with the strong resonance peak of forsterite. The strongest enstatite peaks are found around 36 m (35.3 m for clino-enstatite and 36.1 m for ortho-enstatite). They might be the relatively warm carriers of the cold circumstellar 34.9 and 35.9 micron features. They are likely the main contributors to the plateau (see also the fits in paper III). The 36.5 micron peak also falls into the plateau regime. Forsterite does show a peak at these wavelengths, which would suggest that the long wavelength end of the plateau should correlate with the strength of the 33.6 micron forsterite peak. However, this correlation is not found in our sample. Also, the strength of the laboratory 36.5 micron feature is too weak to explain the strength of the 36.5 micron feature seen in some sources, e.g. MWC922 (Paper I). The fits to the plateau in Paper III make clear that we are also still missing a component that peaks around 34.5 m. However we were not able to extract that feature from our spectra, which indicates that is is probably very blended with other features.
If the red-edge of the plateau is due to ortho-enstatite, then the difference in the extension of the plateau (36.5 m for the outflow objects and 37 m for the disk sources) could be explained by a larger percentage of clino versus ortho enstatite. However, this is in contrast with what has been found in the analysis of the 40 micron complex (see Sec 3.6). So, we cannot be conclusive about this.
Laboratory spectra of enstatite do show peaks at 33.0 and 34.0 m, but these are much weaker than the enstatite features seen in the plateau. This is probably not a big problem for the 34.1 micron feature. Although the measured 34.1 micron feature is narrower than seen in the laboratory, this is the case for more features and might be a temperature effect. The 34.1 micron feature is a typical example of a feature that often does not show a sharp peak but seems necessary to add to fit the spectrum. Since there is no correlation found with the 33.6 or 34.9 micron feature it is not expected to be related to the non-Gaussian shape of these features. We note that the 32.97 micron feature in high flux sources is due to incorrect responsivity curves (see Section 3.5). . The 32.2, and 32.8 micron features still lack solid identification.
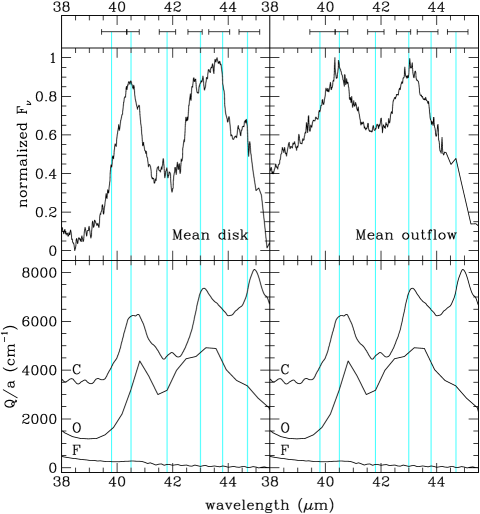
4.7 40 micron complex (38 – 45.5 m)
In Fig. 19 we show the mean spectra and the laboratory spectra of forsterite and both types of enstatite. Forsterite shows no features in this wavelength region. The clino-enstatite feature at 44.9 m, which we identify with the 44.7 micron feature, is the first feature which is completely different from the ortho-enstatite features and therefore a good benchmark for the clino- to ortho-enstatite ratio.
The 40.5 micron feature is probably caused by enstatite, since laboratory spectra of both ortho- and clino-enstatite show a peak at this position. The 40.5 micron feature shows large source to source variations in peak position for such a well defined feature, the extremes being IRAS09425-6040 (40.35 m) and HD179821 (40.80 m) (see Paper I). This may indicate that two different dust components are responsible for the emission in the 40.5 m range. It should be noted that these two components are not seen separately, which indicates that, if present, they severely blend. Although it cannot be excluded at the moment that it is just one solid state, which can shift quite dramatically, we have other indications for a second component in the 40.5 micron feature. The fit to the spectra of HD179821 and AFGL4106 in Paper III demonstrate that in these cases another dust component is necessary to explain the strength of the features.
The 43.8 micron feature can probably be explained with ortho-enstatite. The strength ratio between the 40.5 and 44.7 micron features might therefore give an indication of the clino-enstatite over ortho-enstatite ratio. However, one would expect that this difference is also seen at the long wavelength edge of the 35 micron plateau and there is no correlation found in that spectral regime. This indicates that other dust species influence the features attributed to enstatite features, as was already indicated for the 40.5 micron feature.
The 43.0 micron feature is attributed to crystalline H2O-ice and clino-enstatite. It should be noted that the wavelength of the crystalline H2O-ice feature can shift significantly with temperature, from 42.7 at 10 K to 44.7 at 140 K (Smith et al, 1994). Our peak positions indicate that the average ice temperature is around 40 K. This is a rather low temperature, although similar temperatures have been found for the H2O-ice in AFGL4106 (Molster et al 1999b) and HD161796 (Hoogzaad et al. in prep.), based on a comparison of the strength and position of the 43 and 60 micron bands of H2O-ice. The relative strength of the 43.0 micron feature in the outflow sources compared to the disk sources suggests that crystalline H2O-ice is more abundant in the outflow sources than in the disk sources.
The 39.7 micron feature lacks identification, but there are indications that its strength shows an anti-correlation with the strength of the 44.7 micron feature. We therefore speculate that this feature is due to a reaction product of clino-enstatite and another (dust) species.
4.8 60 micron complex (50 – 72 m)
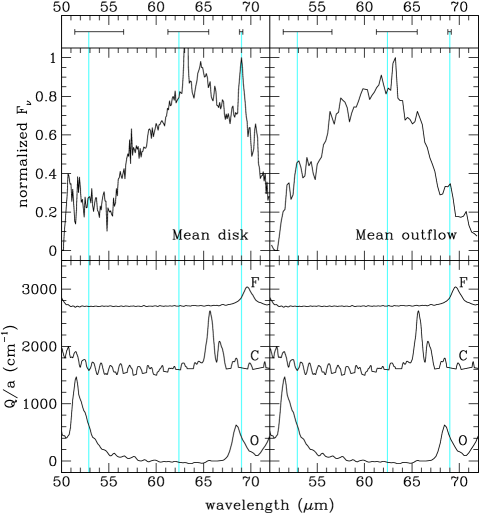
Fig. 20 shows the mean spectra of the 60 micron complex and the corresponding spectra of forsterite and enstatite. We note that these silicates only show sharp features in their lab spectra, while this complex is dominated by a broad feature.
The 62 micron feature and the shoulder at 52 m, which is hardly seen in the disk sources and much more prominent in the outflow sources, is identified with crystalline H2O-ice. In the disk sources the 62 micron band is red-shifted compared to the outflow sources. Laboratory data of crystalline H2O-ice show only a small shift in peak position of the 60 micron band with temperature. This shift is too small to explain the large differences in peak position between the disk and the outflow sources. This indicates that the 62 micron feature actually contains at least two solid state features: a 60 micron feature attributed to crystalline water ice and a 65 micron feature. The shift to shorter wavelengths in the outflow sources implies that the relative abundance of crystalline water ice is higher in the outflow sources, a conclusion which was also drawn on the basis of the 40 micron complex. The 65 micron feature is well fitted with diopside (Koike et al. 2000). Enstatite also shows some peaks in the 60-70 m wavelength range, but since they are quite sharp in the laboratory data (Koike et al. 1999) it is not likely that enstatite is the main contributor to the 65 micron band.
The 69.0 micron feature has been identified with forsterite. This peak shifts significantly by adding fayalite to the solid solution series (already to 73 m for a composition of 4% fayalite and 96% forsterite, see Jäger et al. 1998). This feature therefore indicates that the olivine dust particles are very pure forsterite with hardly any Fe. However, it should be noted that the laboratory peak position of pure forsterite at room temperature is 69.7 m, while we observe this feature around 69.0 m. Recent laboratory measurements at low temperatures (Bowey et al. 2000,2001; Chihara et al. 2001) indicate a shift to shorter wavelengths with decreasing temperature; e.g. at 4 K this feature narrows significantly and peaks at 68.8 m. This would provide a natural solution to the discrepancy between observed and laboratory data taken at room temperature, see also Paper III.
4.9 Remaining features

It was noted that the features around 14 m might be (partially) instrumental. The best indication for this statement would seem OH26.5+0.6 which shows these spurious features also in emission while all other features in this wavelength range are in absorption. In Fig. 21 we show its spectrum in this wavelength region, together with the spectrum of AFGL4106.
We would like to point out that the spectrum of OH26.5+0.6 could be very well fitted by the ‘absorption’ spectrum of enstatite. However the features around 14 m were also found in stars which only show emission like AFGL4106. In these cases the enstatite spectrum alone can not explain the structure anymore, and it looks more like a responsivity problem, also because it shows quite some similarities with the responsivity spectrum. Caution should therefore be taken for these features, since the are likely influenced by both enstatite and responsivity problems.
The 20.7 micron feature is seen in the forsterite and enstatite data, but not as strong as it is seen in some sources. Silica (SiO2) does show a very strong resonance at this wavelength and might therefore be a good candidate. If silica is present it can be an explanation for the 9.1, 15.9 and 26.1 micron features (Fabian et al. 2000). However, one would also expect to see a feature at 12.6 micron which is not the case. Therefore, a solid identification for this feature is still lacking.
The 21.5 micron feature is also seen as a weak feature in the enstatite and forsterite laboratory spectra. In some sources it is stronger than expected from these laboratory spectra. Therefore, it is likely that another material contributes to this feature. While the 20.7 micron feature is always present when the 21.5 micron feature is detected, this is not true the other way around. Therefore, they must originate from different dust species. Also, the strength ratio is not always the same.
Forsterite has a feature at 26.1 m (Jäger et al. 1998). We, therefore, identify the 26.1 micron feature with forsterite, although a contribution from silica cannot be excluded.
The blend of the 47.7 and 48.6 micron features has not yet been identified; enstatite nor forsterite have features at these wavelengths. Ferrarotti et al. (2000) identified the blend of the 47.7 and 48.6 micron band with FeSi. The 44.7 micron features might also be explained by this material. However, their fit is not completely satisfactory and the FeSi features around 30 m are also not well matched with features in our ISO spectra. We wonder if shape effects shifts (and reshapes) the bands as is seen for forsterite. This has not been tested. This identification was based on a condensation sequence in stellar outflows where free carbon and oxygen atomes are both underabundant. This can be either because the C/O ratio is close to 1 and all carbon and oxygen is locked up into CO, or in stars which expose their layers, which formerly have burnt hydrogen by the CNO-cycle. However, we observe the 48 micron feature in several stars, some of which are definitely O-rich (e.g. OH26.5+0.6). The proposed identification of the 48 micron blend with FeSi is an interesting identification, but not convincingly confirmed yet. Other (hydrous) silicates often have peaks around 48 m. However, no suitable candidate has yet been identified. Therefore, the identification of the 47.7 and 48.6 micron features remain open.
The longest wavelength feature which has been found in various stars is the 91 micron feature. Malfait et al (1998) suggested hydrous silicates; these materials often show a broad feature in this wavelength range, but a satisfying fit has not yet been achieved. It is also difficult to explain how hydrous silicates would form in these outflows, since liquid water seems necessary.
In 89 Her and HD44179 a broad (full width zero intensity m) solid state band which peaks around 33 m, hereafter called the 33 micron band, is found. It has not been included in Table 1, because its shape and appearance are very uncertain. It shows a relatively sharp rise on the blue side at about 27 m while it ends with a gentle slope on the red side at about 42 m. In the amorphous silicate data presented by Ossenkopf et al. (1992) a broad feature seems present around these wavelengths, but the limited wavelength resolution of this data set at these wavelengths prevents a firm identification. The strength of this feature in our ISO data is likely too strong to be solely explained by the feature in the Ossenkopf data set. Therefore, other materials are likely to contribute to this feature. The peak position and width bear some similarities with the 30 micron feature in C-rich sources, where it is attributed to MgS. Similar features are also seen in the direction of the galactic center and in the dust of Car. Note that the shape of the 28 micron complex seems influenced by this feature.
5 Discussion and conclusions
In this paper we have combined the spectra of 17 stars with oxygen-rich circumstellar dust environments. These combined spectra show a wealth of dust features, which now are studied in a systematic way. Most of the features cluster into one of seven complexes (at 10, 18, 23, 28, 33, 40 or 60 m). Each of these complexes is a convolution of a limited set of components, which vary independently.
Our conclusion from this work is that there is a clear distinction
between the disk and outflow sources. Not only in the strength of the
features and therefore in abundance of the crystalline silicates,
which was the original natural separator profile between these two groups
of objects, but also in the characteristics of the complexes.
10 + 18 micron complex:
The difference in shape, a smooth profile for the outflow sources and
narrow features for the disk sources, is mainly due to an abundance
difference between the crystalline and amorphous silicates in the disk and
outflow sources and is also directly connected to the strength of the features.
The outflow sources have a lower abundance of crystalline silicates.
23 micron complex:
The strength of the 23.0 micron feature with respect to the strength of the
23.7 micron feature is higher in the outflow sources. The 24.5 micron feature
is more prominent in the disk sources. In Paper III we will demonstrate
that in the (massive) outflow sources, the ratio of enstatite over forsterite
is higher. This would imply that the 23.0 micron feature results indeed from
enstatite and that although enstatite has a (weak) feature around
24.5 m, another material is (mainly) responsible for the
24.5 micron feature.
28 micron complex:
The 28 micron complex differs significantly from source to source and
several outflow sources are affected by a lack of data. Therefore,
no clear difference could be pointed out.
33 micron complex:
The features appear sharper in the outflow sources than in the disk sources.
This might have to do with the formation history of the crystalline
silicates (see Paper III).
The (post-)Red Supergiants separate out by almost equally strong 32.8 and
33.6 micron features, even after subtracting the spurious 32.97 micron feature.
This is not a characteristic of all outflow sources.
40 micron complex:
For the 40 micron complex the main difference is found in the strength ratio
of the 43.0 and 43.8 micron features. In the disk sources, the 43.8 micron
feature is more prominent and in the outflow sources the 43.0 micron feature.
This has to do with the high abundance of crystalline H2O-ice in the outflow
sources.
60 micron complex:
The main difference in this complex is found in the peak position of the
62 micron feature. This feature is probably a blend of
crystalline H2O-ice, peaking around 60 m (the outflow sources),
and diopside plus possibly other crystalline silicates,
peaking around 65 m (the disk sources).
Also, the 69.0 micron feature is much stronger in the disk sources than in
the outflow sources, which is probably an abundance effect.
It is likely that the different history of these dust grains are
responsible for the spectral differences. MYW suggested that low
temperature crystallization has taken place in the disk sources. In contrast,
the crystallization of silicates in outflow sources is likely to
have taken place close to the star; i.e., high temperature
crystallization.
Most features can be explained with forsterite and enstatite. It is clear that several other features lack a proper identification, and also the strength ratios are not always correct, suggesting the presence of more contributing materials. Diopside has been mentioned but the strength of several features attributed to diopside suggests that it is only a minor component.
The growth of enstatite crystals can occur in a preferential direction of one of the crystallographic axes. In chondritic porous interplanetary dust Particles (IDPs), which are believed to be the most pristine material of our solar system, enstatite has been found in which one or 2 directions of the crystallographic axes were severely depressed (Bradley et al, 1983). These enstatite crystals are likely formed from the vapour phase in a low density hot gas environment (Bradley et al, 1983 and references therein), in conditions which are similar to the conditions in the outflows of stars. It is therefore possible that one or two of the crystallographic axes ([010] and [001] according to what has been seen in IDPs) are depressed. This will change the emission spectrum of this material in such a way that certain feature will be weak, corresponding to the depressed crystallographic axis. This scenario might help to understand why the relative strength of some features differ from the lab spectra.
Another abundant species is H2O ice. Kouchi and Kuroda (1990) demonstrate that below 70 K the ice rapidly turns amorphous under the bombardment of UV- photons. Calculations based on their results and reasonable assumptions for the UV flux of the central stars would imply that all the crystalline water ice turns amorphous within a couple of days. Apparently the ice is efficiently shielded from the UV radiation of these stars. Also the low temperature of the ice is an indication for the shielding of the crystalline water-ice. If the material is very clumpy as is seen in e.g. the Helix Nebula (first seen by Baade and reported by Verontsov-Velyaminov (1968), it might provide a suitable environment to survive the UV radiation.
In the outflow sources the abundance of crystalline water ice seems much higher than in the disk sources. Assuming that initially the same amount of H2O was formed, this difference points to a scenario in which crystalline water ice is destroyed on time scales longer than the outflow time scales. In the outflow of stars, density enhancements has been found, where molecules and dust are protected from the harsh UV radiation. This might explain the crystalline water-ice content even for the cold dust. Also inside disks particles are protected against the UV radiation, but the turbulence in disks likely causes that most dust particles will ultimately be exposed to the destructive UV radiation, long before the disk has been blown away.
With about 80% of the features identified, see Table 1 for the identifications, the age of astromineralogy has now really started. Still, about 20% of the features lack a proper identification. There is also ample evidence that for a significant amount of the ‘identified’ features more dust components are necessary to explain the relative strength of the infrared bands. New laboratory measurements of cosmic relevant dust species up to at least 100 m are required to identify these features. We can now start to fully exploit the historical information of the conditions the dust experienced, by studying the composition and chemical structure of the grains. The differences found between the different laboratory datasets, are a significant obstacle in the quantitative interpretation of the spectra. The properties of the sample (e.g. the stoichiometry, size of the particles, number and size of the individual crystals in a particle) should all be well checked before and after the measurents of the optical constants. We would also recomend that the different astrophysical laboratories exchange their samples in order to have a better understanding of the possible sources of differences in their datasets.
Acknowledgements.
FJM wants to acknowledge the support from NWO under grant 781-71-052 and under
the Talent fellowship programm. LBFMW acknowledges financial support from an
NWO ‘Pionier’ grant.
References
- (1) Bowey J.E., Lee C., Tucker C. et al., 2000, in ISO beyond the peak, ed A. Salama, ESA SP-456, 339
- (2) Bowey J.E., Lee C., Tucker C. et al., 2001, MNRAS 325, 886
- (3) Bradley J.P., Brownlee D.E. and Veblen D.R., 1983, Nature 301, 473
- (4) Chihara H., Koike C., Tsuchiyama A., 2001 PASJ 53, 243
- (5) Clegg P.E., Ade P.A.R., Armand C. et al., 1996, A&A, 315, L38
- (6) Cohen M., Barlow M.J., Sylvester R.J. et al., 1999, ApJ 513, L135
- (7) Demyk K., Jones A.P., Dartois E. et al., 1999, A&A 349, 267
- (8) Dorschner J., Begemann B., Henning Th. et al., 1995, A&A 300, 503
- (9) Fabian D., Jäger C., Henning Th. et al., 2000, A&A 364, 282
- (10) Ferrarotti A., Gail H.-P., Degiorgi L. and Ott H.R., 2000, A&A 357, 13
- (11) de Graauw Th., Haser L.N., Beintema D.A. et al., 1996, A&A 315, L49
- (12) Henning Th., and Mutschke H., 1997, A&A 327, 743
- (13) Jäger C., Molster F.J., Dorschner J. et al., 1998, A&A 339, 904
- (14) Kessler M.F., Steinz J.A., Anderegg M.E. et al., 1996, A&A 315, L27
- (15) Koike C., Shibai H. and Tuchiyama A., 1993, MNRAS 264, 654
- (16) Koike C. and Shibai H., 1998, ISAS report no. 671
- (17) Koike C., Tsuchiyama A., Suto H. et al., 1999 in Proceedings of the 32nd ISAS Lunar and Planetary Symposium 32, p 175
- (18) Koike C., Tsuchiyama A., Shibai H. et al., 2000, A&A 363, 1115
- (19) Kouchi A and Kuroda T., 1990, Nature 344, 134
- (20) Malfait K., Waelkens C., Waters L.B.F.M. et al, 1998, A&A 332, L25
- (21) Molster F.J., Yamamura I., Waters L.B.F.M. et al., 1999a, Nature 401, 563 (MYW)
- (22) Molster F.J., Waters L.B.F.M., Trams N. et al., 1999b, A&A 350, 163
- (23) Molster F.J., Yamamura I., Waters L.B.F.M. et al., 2001, A&A 366, 923
- (24) Molster F.J., Waters L.B.F.M. Tielens A.G.G.M. and Barlow M., 2002a, accepted by A&A (Paper I)
- (25) Molster F.J., Waters L.B.F.M. Tielens A.G.G.M. et al., 2002b, accepted by A&A (Paper III)
- (26) Ossenkopf V., Henning Th. and Mathis J.S., 1992, A&A 261, 567
- (27) Smith R.G., Robinson G., Hyland A.R. and Carpenter G.L., 1994, MNRAS 271, 481
- (28) Tielens, A.G.G.M., 1990, in Proceedings of the symposium “From Mira’s tp Planetary Nebulae: Which path for stellar evolutiom?”, eds. M.O. Mennessier and A. Omont, Editions Frontiers, Gif sur Yvette Cedex, France, p 186
- (29) Tielens A.G.G.M., Hony S., Van Kerckhoven C., et al., 1999, in The universe as seen by ISO, eds. P.Cox, M.F.Kessler, ESA-SP 427, 579
- (30) Van Kerckhoven C., Hony S., Peeters E. et al., 2000, A&A 357, 1013
- (31) Verontsov-Velyaminov B.A., 1968, in Proc. IAU Symp. 34, Planetary Nebulae, Osterbrock D.E., O’Dell C.R. (eds.), Reidel, Dordrecht, 256
- (32) Waelkens C., Waters L.B.F.M., de Graauw M.S. et al., 1996, A&A 315, L245
- (33) Waters L.B.F.M., Molster F.J., de Jong T. et al., 1996, A&A 315, L361
- (34) Waters L.B.F.M., Waelkens C., Van Winckel H. et al., 1998, Nature 391, 868
- (35) Wright C.M., van Dishoeck E.F., Black J.H., et al., 2000, A&A 358, 689