Crystalline silicate dust around evolved stars††thanks: Based on observations with ISO, an ESA project with instruments funded by ESA Member States (especially the PI countries: France, Germany, the Netherlands and the United Kingdom) and with the participation of ISAS and NASA,††thanks: Tables 4 to 20 are only available in electronic form at the CDS via anonymous ftp to cdsarc.u-strasbg.fr (130.79.128.5) or via http://cdsweb.u-strasbg.fr/cgi-bin/qcat?J/A+A/
This is the first paper in a series of three where we present the first comprehensive inventory of solid state emission bands observed in a sample of 17 oxygen-rich circumstellar dust shells surrounding evolved stars. The data were taken with the Short and Long Wavelength Spectrographs on board of the Infrared Space Observatory (ISO) and cover the 2.4 to 195 m wavelength range. The spectra show the presence of broad 10 and 18 m bands that can be attributed to amorphous silicates. In addition, at least 49 narrow bands are found whose position and width indicate they can be attributed to crystalline silicates. Almost all of these bands were not known before ISO. The incredible richness of the crystalline silicate spectra observed by ISO allows detailed studies of the mineralogy of these dust shells, and is a telltale about the origin and evolution of the dust. We have measured the peak positions, widths and strengths of the individual, continuum subtracted bands. Based on these measurements, we were able to order the spectra in sequence of decreasing crystalline silicate band strength. We found that the strength of the emission bands correlates with the geometry of the circumstellar shell, as derived from direct imaging or inferred from the shape of the spectral energy distribution. This naturally divides the sample into objects that show a disk-like geometry (strong crystalline silicate bands), and objects whose dust shell is characteristic of an outflow (weak crystalline silicate bands). All stars with the 33.6 m forsterite band stronger than 20 percent over continuum are disk sources. We define spectral regions (called complexes) where a concentration of emission bands is evident, at 10, 18, 23, 28, 33, 40 and 60 m. We derive average shapes for these complexes and compare these to the individual band shapes of the programme stars. In an Appendix, we provide detailed comments on the measured band positions and strengths of individual sources.
Key Words.:
Infrared: stars - circumstellar matter - Stars: AGB and post-AGB; mass loss - Planetary Nebulae: general - Dust, extinctionPresent address: F.J. Molster, ESA/ESTEC, SCI-SO, Postbus 299, 2200 AG Noordwijk, The Netherlands
1 Introduction
Red giants and supergiants are characterized by low surface temperatures resulting in the presence of many different molecules in their atmosphere. These objects are also known to have dense stellar winds, presumably driven by a combination of pulsations and radiation pressure on the dust which forms in the cooling outflow. Since dust efficiently absorbes radiation at short wavelengths, the central star can easily become obscured and most of the luminosity of the star is re-radiated at mid-IR wavelengths. At these wavelengths, the most important ro-vibrational bands of abundant molecules can be found, and indeed many solid state bands from various dust components have been found using infrared spectrographs. The Infrared Space Observatory (ISO, Kessler et al. 1996) has allowed for the first time a comprehensive inventory of solid state bands in astrophysical objects with uninterrupted wavelength coverage from 2.4 to 200 m and with a spectral resolution which is well suited for the detection of solid state bands.
We have undertaken detailed studies of the dust emission and absorption spectra of evolved stars, ranging from Asymptotic Giant Branch (AGB) stars to Planetary Nebulae (PNe) and to (post) Red Supergiants (RSG). Preliminary results of these studies have been published elsewhere and can be summarized as follows: Many oxygen-rich evolved stars have a surprisingly rich spectrum of solid state emission bands between 10 and 100 m, dominated by both amorphous and crystalline silicates (e.g. Waters et al. 1996; Molster et al. 1999a; 1999b). The crystalline silicates were not known to be present in dust shells around evolved stars before ISO was launched, and allow for the first time a mineralogical analysis of the dust composition around these objects. Some objects show a very high abundance of crystalline silicates (e.g. Molster et al. 2001a), which seems to be related to the geometry of the circumstellar dust shell (Molster et al 1999a). Surprisingly, stars which were believed to have a carbon-rich dust chemistry also showed the presence of crystalline silicate emission, pointing to a complex chemical composition of the circumstellar environment, possibly due to rapid changes in the chemistry of the stellar photosphere (e.g. Waters et al. 1998; Cohen et al. 1999, Molster et al. 2001a). These observations demonstrate the use of the crystalline silicate bands for a better understanding of the evolution of late type giants and supergiants.
| Object | Type | Revolution | AOT | Tint | Comment |
|---|---|---|---|---|---|
| (AOT nr) | (sec) | ||||
| IRAS09425-6040 | C-rich AGB star with O-rich dust | 084 | SWS01 | 1816 | |
| 254 | SWS01 | 6538 | |||
| NGC 6537 | Planetary Nebula, hot central star | 470 | SWS01 | 1912 | mispointed |
| 470 | LWS01 | 1318 | |||
| 703 | SWS01 | 3454 | |||
| 703 | LWS01 | 2230 | |||
| NGC 6302 | Planetary Nebula, hot central star | 094 | SWS01 | 6528 | |
| 479 | SWS06 | 8532 | and m | ||
| 479 | SWS06 | 12165 | and m | ||
| 289-678 | LWS01 | 13243 | combination of rev 289, 482, | ||
| 489, 503, 510, 671, and 678 | |||||
| MWC 922 | Peculiar object | 153 | SWS01 | 1834 | combined with rev 703 |
| 478 | LWS01 | 1316 | |||
| 703 | SWS01 | 1912 | combined with rev 153 | ||
| AC Her | Binary post-AGB star | 106 | SWS01 | 1834 | |
| 471 | LWS01 | 1910 | |||
| 520 | SWS01 | 6538 | |||
| HD 45677 | B[e] star, nature unclear | 711 | SWS01 | 6538 | |
| 89 Her | Binary post-AGB star | 082 | SWS01 | 1044 | |
| 336 | LWS01 | 1860 | |||
| 518 | SWS01 | 6538 | |||
| MWC 300 | Evolved star, B supergiant | 516 | SWS01 | 3454 | |
| Vy 2-2 | Proto-planetary nebula | 320 | SWS01 | 1140 | |
| 547 | LWS01 | 1318 | arcsec mispointed | ||
| HD 44179 | Red Rectangle; binary post-AGB star | 702 | SWS06 | 1174 | m |
| 702 | SWS06 | 856 | m | ||
| 702 | SWS01 | 6538 | |||
| 709 | LWS01 | 3428 | |||
| 870 | SWS06 | 8406 | m | ||
| HD 161796 | Post-AGB star | 071 | SWS01 | 1044 | |
| 080 | LWS01 | 1554 | |||
| 342 | SWS01 | 1912 | |||
| 521 | SWS06 | 1744 | m | ||
| OH 26.5+0.6 | OH/IR star, high mass loss rate | 330 | SWS01 | 1912 | |
| 330 | LWS01 | 1268 | |||
| 340 | LWS01 | 822 | |||
| Roberts 22 | post-AGB star, A supergiant | 084 | SWS01 | 1044 | mispointed |
| 103 | LWS01 | 478 | |||
| 254 | SWS01 | 3454 | mispointed | ||
| HD 179821 | post-AGB or post-RSG star | 113 | SWS01 | 1834 | |
| 520 | SWS01 | 6538 | |||
| 319 | LWS01 | 1266 | |||
| AFGL 4106 | post-RSG, binary | 060 | SWS01 | 1130 | |
| 104 | SWS01 | 1834 | |||
| 104 | LWS01 | 476 | |||
| 249 | SWS01 | 3454 | |||
| NML Cyg | Red Supergiant, high mass loss rate | 052 | SWS01 | 6544 | |
| 342 | SWS01 | 1140 | |||
| 530 | SWS06 | 1688 | m | ||
| 555 | LWS01 | 2798 | |||
| 741 | SWS01 | 1140 | |||
| IRC+10420 | post-RSG, A supergiant | 128 | SWS01 | 3462 | |
| 316 | SWS06 | 1718 | m | ||
| 724 | LWS01 | 3430 |
This paper is the first in a series of three where we present a detailed and comprehensive overview of the solid state emission bands in oxygen-rich dust shells surrounding evolved stars and related objects. The purpose of these papers is to quantify as best as possible the presence and characteristics of the numerous new emission bands that have been discovered using the ISO data. In paper II (Molster et al. 2002a) of this series, we describe the average band profiles of seven ”complexes” that can be recognized in the combined Short- (de Graauw et al. 1996) and Long- (Clegg et al. 1996) wavelength spectrometers (hereafter referred to as SWS and LWS respectively) that were on board of ISO. Based on the strength of the crystalline silicate bands, we divide in paper II the sample of 17 stars into two groups. This division is also one which separates objects with a highly flattened dust distribution (referred to here as ”disk” sources) from those with a more spherical distribution of dust (the non-disk or spherical outflow sources, hereafter referred to as ”outflow” sources). In the present study, we present the 17 programme stars, we give an overview of the individual spectra, and we quantify the position and strength of the bands. In Paper III (Molster et al. 2002b) we will investigate several trends in the spectrum and correlate them with other information available about these sources.
This paper is organized as follows: Sect. 2 presents the sample, the observations and data reduction; Sect. 3 describes the nature of the individual sources, and the shape of the complexes as compared to the mean. Sect 4 summarizes the results of this study. In Appendix A we present the band strength data and some more detailed discussion about individual spectral features with respect to their reliability and blending.
2 The observations and data reduction
2.1 The sample
In order to get as broad as possible an overview of the O-rich dust features around evolved stars, we aimed for a sample covering the evolution of stars from the Asymptotic Giant Branch (AGB) to the Planetary Nebula (PN) phase, and also including some massive (post-) Red Supergiants (RSG). Several objects were also included whose evolutionary status is unclear (e.g. MWC 922, MWC 300 and HD 45677). We inspected the spectra for the presence of crystalline silicate bands. Since we are interested in (sometimes weak) bands on top of a continuum, we selected bright objects with fluxes higher than about 20 Jy in the 20 to 45 m region. We preferentially included objects for which both an SWS and an LWS spectrum are available. We finally arrived at a sample of 17 objects, listed in Table 1.
In several cases more than one observation was available. The boldface revolution numbers in Table 1 indicate which observations were used for the final spectrum. The other observations were less accurately reduced and only used as a reference in case of doubt in the main spectrum.
2.2 Data reduction


2.2.1 SWS and LWS data reduction
For a description of the SWS instrument and its operating modes we refer to de Graauw et al. (1996). The spectra used in this study were reduced using version 7.0 of the SWS offline processing software. For a description of flux and wavelength calibration procedures, see Schaeidt et al. (1996) and Valentijn et al. (1996). We used standard procedures for flatfielding, sigma-clipping and rebinning of the signals from the 12 detectors We removed the main fringes in SWS band 3 (12.0 – 29.5 m). The final resolution () of the spectrum depends on the observing mode and the quality of the spectrum, but was typically around 250 for a speed 1, 300 for a speed 2, 500 for a speed 3, 750 for a speed 4 AOT01 and 1500 for an AOT06 observation.
The LWS instrument and operating modes are described in Clegg et al. (1996). For a description of the flux and wavelength calibration procedures see Swinyard et al (1996). The LWS spectra were reduced with the LWS offline processing software version 7.0, and further processed using ISAP. The reduced and rebinned LWS spectra of NGC 6302 used in this study were taken from Molster et al. (2001b); those of OH 26.5+0.6 from Sylvester et al. (1999); those of AFGL 4106 were taken from Molster et al. (1999b); for HD 44179 from Hony et al. (in preparation), for HD 161796 from (Hoogzaad et al., in preparation), and for MWC 922 from Sylvester (private communication). We verified that these LWS spectra were reduced in a homogeneous way. The other LWS spectra were only sigma-clipped and rebinned and mainly used as a reference for the adjustment of SWS band 4 and the placement of the continuum (see section 2.2.2).
To match the individual sub-bands with each other, we used multiplications, when we expected the flux calibration to be the most important source of error, and a linear shift when we expect the the dark curents to be the main source for the discrepancy between the different bands. In all cases we tried to minimize the necessary shifts.


2.2.2 Determination of an underlying continuum
In order to enhance the visibility of the different features we have defined a continuum for the spectra in Fig. 1 and Fig. 2. We have used an eye-ball spline-fit continuum, maximizing the continuum and still be smooth (no sudden changes in the slope), both in and . We emphasize that this continuum has not necessarily a physical meaning but is only used here to enhance the sharp features on top of the spectrum. In principle, the strength of the features could be underestimated and there is a possibility that very broad features are treated as continuum. Whenever possible we tried to use the whole wavelength range (SWS + LWS) to determine the placement of the continuum. We have purposely not used (modified) blackbody-fits, because most spectra could not satisfactory be fitted by one (modified) blackbody (BB). This would have forced us to use multiple (modified) blackbodies, which would make it as arbitrary as the eye-ball fit and we had the feeling that we could be more consistent between the different spectra bye the eye-ball method than with BB-fitting. Finally, the BB-fitting results in a quite artificial physical parameter, the temperature, which is not always directly related to the real temperature of the dust species. In order to prevent confusion about this parameter, we prefered the meaningless eye-ball continuum.
In two sources, Roberts 22 and Vy 2-2, flux jumps were found due to a pointing offset of ISO. Pointing offsets result in flux jumps due to the change in aperture size of SWS with wavelength (see De Graauw et al. (1996)). In these cases we have fitted separate continua to each part of the spectrum, where we took into account the relative slope in the other parts of the spectrum. However, this may affect the shape of the complexes whose wavelength coverage extends over sub-bands with different SWS apertures.
The Planetary Nebulae NGC 6537 and NGC 6302 have strong emission lines that hamper the determination of the dust emission bands. We decided to remove most of these by subtracting a Gaussian fit to the (unresolved) lines. For very strong lines (some could be 100 times the continuum level) the subtraction procedure resulted in excessive noise after removal of the Gaussians. In these cases, we removed the noisy part of the spectrum.
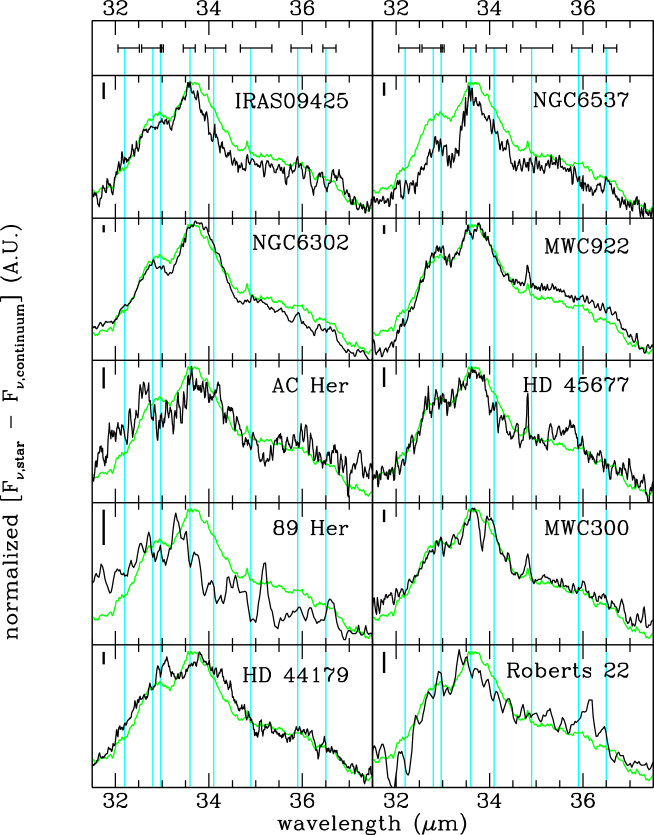
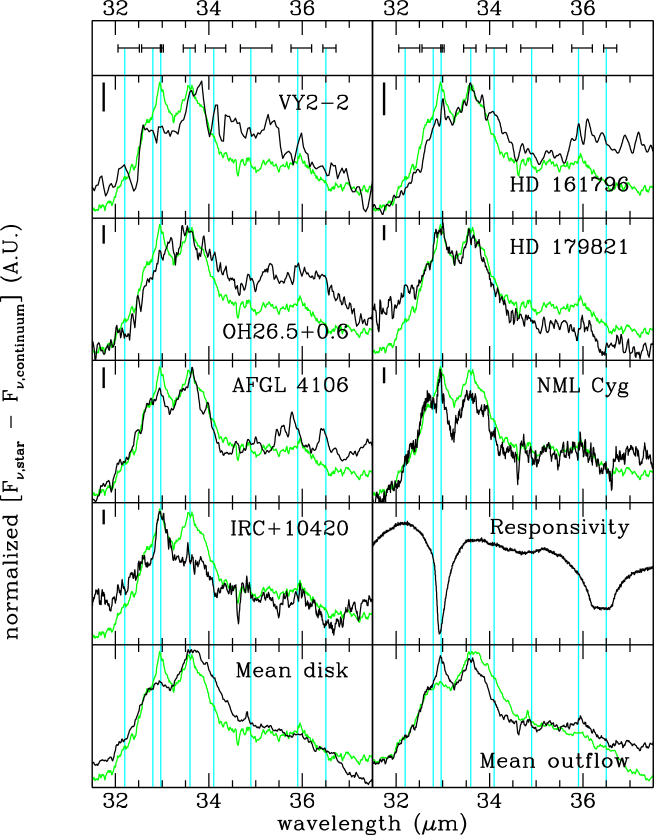
2.2.3 The ”final spectra”: disk and outflow sources
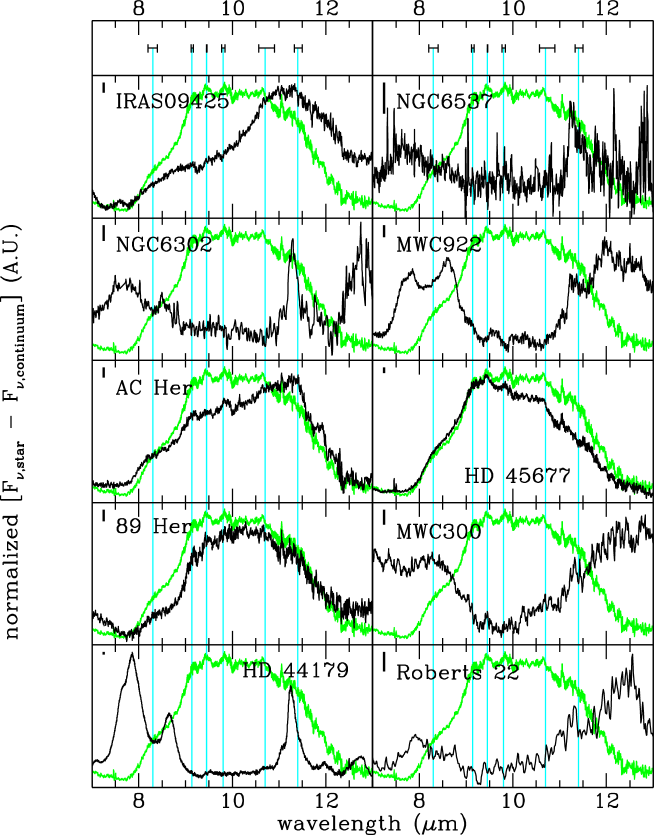
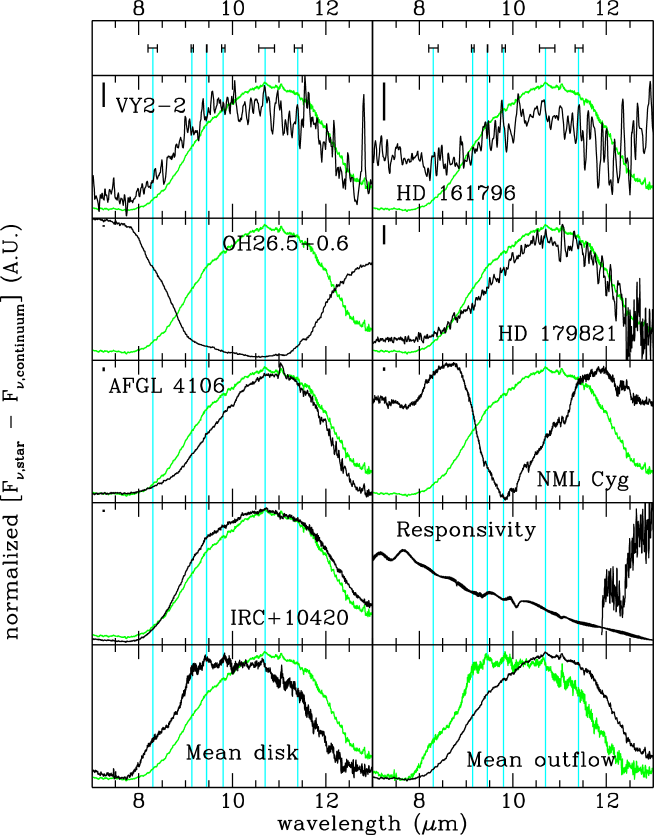
After some study of the stars in our sample, it became apparent that there is a wide range in band strengths of the different sources. We have accordingly ordered the spectra in sequence of decreasing strength of the 33.6 m band with respect to its local continuum. As we will show later (see Sect. 3) this naturally divides the spectra into objects that have a disk-like distribution of dust, and objects that have a more spherical dust distribution. We will use this division into ”disk” and ”outflow” sources in the remainder of this paper, and will group our sources accordingly. In Fig. 1 and Fig. 2 the final spectra are shown, and Figs. 3 and 4 show the continuum subtracted spectra, in both cases divided into disk and outflow sources.
2.3 Definition of complexes
A first inspection of the continuum subtracted spectra of our programme stars indicates that there is a multitude of emission bands. These bands are not evenly spaced in the spectrum, but tend to concentrate in a number of wavelength regions. Within these fairly narrow wavelength ranges, severe blending hampers the measurement of individual components. As an example we show in Fig. 5 the continuum subtracted spectrum of HD 179821. There is a clear concentration of bands near 10, 18, 23, 28, 33, 40 and 60 m. We therefore decided to define 7 regions, that we will refer to as ”complexes”, in which features tend to concentrate, and which we labeled with their central wavelength: the 10, 18, 23, 28, 33, 40 and 60 micron complex (see Table 2). We will refer to an individual emission band within a complex as ”feature” or ”band”. Note that individual bands can also occur outside a complex, and we will refer to these as ”features” or ”bands” as well.

2.4 Mean spectra
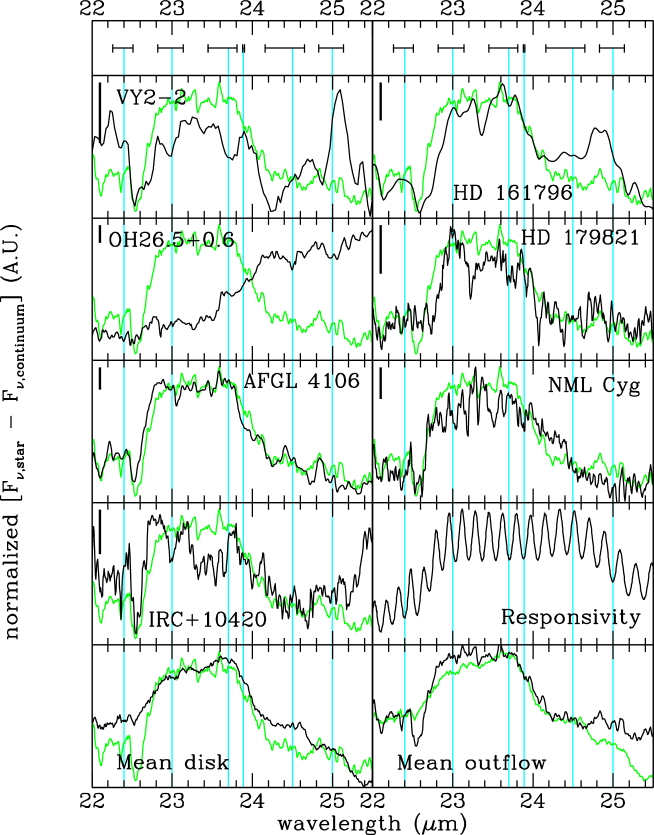
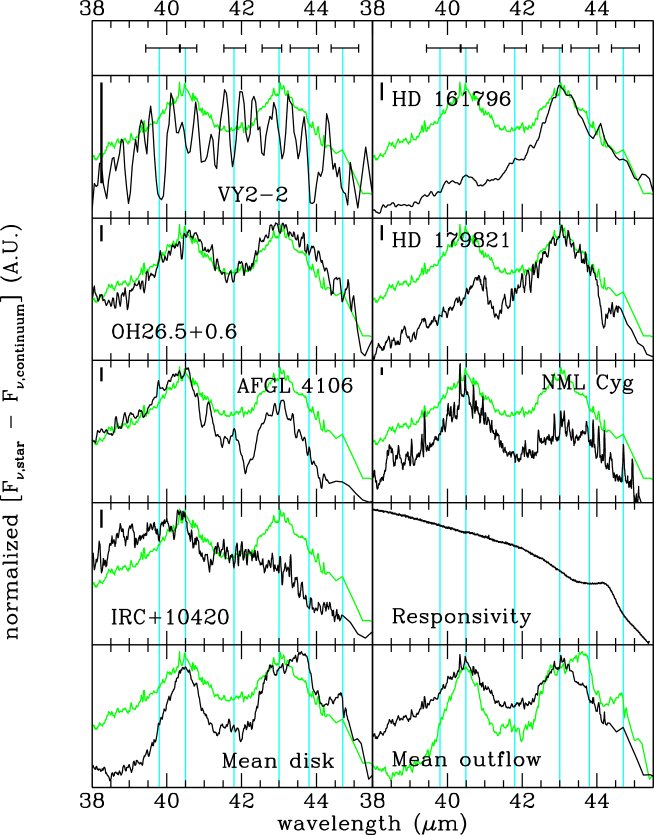
We have derived ‘mean’ spectra for each complex, by extracting the wavelength range around and including the complex from the continuum subtracted spectra for all stars. All these complex spectra were added, using a weighting factor proportional to the S/N of the spectrum, to create a ‘mean’ spectrum of each complex. This was done for both the outflow and the disk-sources.
We could only use 89 Her, AC Her and HD 45677 to calculate the mean 10 micron disk source complex, because all other disk sources did not show bands due to oxygen-rich dust. This is due to a contribution from hot, carbon-rich dust dominating the spectrum, or because the oxygen-rich dust was too cold to produce significant emission near 10 m. For the outflow sources we excluded OH 26.5+0.6 and NML Cyg, because they show the 10 m amorphous silicate band in strong absorption.
The source OH 26.5+0.6 has also been excluded from the average spectra of the 18 and 23 micron (outflow) complexes because the spectrum is in absorption. NML Cyg shows amorphous silicates in absorption in the 18 micron complex, but the crystalline silicates is already in emission. To avoid problems we have also excluded this object from the average outlfow spectrum for the 18 micron complex.
In Paper II an extensive discussion will be presented on the properties of the mean complexes and bands, for both outflow and for disk sources. Here we will compare the individual complex or band positions and shapes with the mean. In Paper II we will also present average properties and identify the bands using laboratory data of several materials. Most of the bands can be identified with forsterite (Mg2SiO4; the Mg-rich endmember of the crystalline olivine series) and enstatite (MgSiO3; the Mg-rich end member of the crystalline pyroxene series). About 20 percent of the bands still lack an identification.
| complex | ||
| name | m | m |
| 10 | 7 | 13 |
| 18 | 15 | 20 |
| 23 | 22 | 25.5 |
| 28 | 26.5 | 31.5 |
| 33 | 31.5 | 37.5 |
| 40 | 38 | 45.5 |
| 60 | 50 | 72 |
2.5 Measurement of solid state features
In order to get a consistent view of the strength and position of the features found in our spectra, we have fitted Gaussians to features, or multiple Gaussians in the case of complexes, with the ISAP-line fit programme. The fits have been applied to the original, i.e. non-continuum subtracted, spectrum in . In this way we prevent very broad features, extending over more than one complex, from contributing to the individual bands. We determined a local continuum, often a third order polynomial, for each spectral section and estimated the error on the measured wavelength, FWHM, peak to continuum ratio and integrated band flux for these features by multiple independent fits to the (local continuum subtracted) spectrum. For this purpose we varied the defined continuum, since this is likely to have the largest influence on the derived strength of the features. The drawback of this method is that the uncertainties in the spectrum are not taken into account. Therefore in a few low S/N cases the derived 1 errors for the wavelength position (see Appendix A), might be too low and should be a factor 2 to 3 higher. Still, for most cases the wavelength determination is indeed quite accurate. Sometimes the error in the strength of the features may have been overestimated, resulting in band strengths that are less than 3 sigma over the noise. However, careful inspection of the individual cases convinced us of their reality. Finally, we note that non-Gaussian shapes occur for certain bands, causing a systematic but reproducible error.
![[Uncaptioned image]](/html/astro-ph/0201303/assets/x6.png)
3 Description of the programme stars
Before discussing the bands and complexes, it is useful to summarize the properties of our programme stars. This is relevant when one tries to correlate the observed dust spectrum with other properties of the object. We have searched for correlations between the relative (to the local continuum) strength of the 33.6 m band (identified with forsterite, Waters et al. 1996), which is detected in all programme stars, and other properties of the star or its circumstellar shell. No obvious correlation could e.g. be found with the temperature of the star, or with the colour temperature of the underlying continuum (we will return to these points in Paper III). However, a correlation between the geometry of the circumstellar shell and the (relative) strength of the 33.6 m feature exists (Molster et al. 1999a). Objects with strong crystalline silicate emission bands have a highly flattened circumstellar geometry. This geometry is either derived from direct imaging at optical or near-IR wavelengths (e.g. in the case of the Red Rectangle: Osterbart et al. 1997; Monnier et al. 1997), or it is inferred from the shape of the spectral energy distribution (SED; e.g. in the case of IRAS09425-6040, Molster et al. 2001a).
Because of these differences we have divided the stars into disk and outflow sources and ordered them in decreasing 33.6 micron band strength. When discussing individual stars below, present evidence for either a disk or a more spherical geometry for the dust envelope.
3.1 Disk sources
3.1.1 IRAS09425-6040
This carbon-rich AGB star is one of the most intriguing stars in our sample. The source is discussed extensively by Molster et al. (2001a). It was classified as a post-AGB object based on its IRAS colours. The ISO-SWS spectrum however revealed a J-type carbon-star at wavelengths below 15 m (Molster et al. 2001a), while at longer wavelengths highly crystalline O-rich dust dominates the spectrum. It has the highest contrast crystalline circumstellar dust observed so far in the complete ISO sample (Molster et al. 1999a). The oxygen-rich dust probably originates from a previous mass loss phase before the star turned C-rich. Somehow this O-rich material was stored around the star. The IRAS 60 m measurement suggests that the spectral energy distribution is flat up to that wavelength. Both the shape of the energy distribution and the complex chemistry point to the presence of a disk instead of an ordinary outflow. Molster et al. (2001a) propose that IRAS09425-6040 is a binary and an evolutionary progenitor of the Red Rectangle.
The SWS spectrum of this source has already been shown by Molster et al (1999a;2001a).
3.1.2 NGC 6537
NGC 6537 is an extreme Type I planetary nebula (PN), which bears a lot of similarities to NGC 6302. It has a bipolar outflow structure, which is probably caused by a disk (Cuesta et al. 1995). He and N are overabundant while C is severely underabundant, the typical characteristic of Type I PN, but for both NGC 6537 and NGC 6302 these abundances are more extreme than in other Type I PN. Both NGC 6537 and NGC 6302 have very high excitation lines, e.g. [Si VI] (Ashley & Hyland, 1988) which are not found in other PNe. NGC 6537 is probably the evolutionary product of the most massive stars which end as a white dwarf and may have had an initial main sequence mass in the range 5-7 M⊙. Shocks are expected to be present due to the interaction of the fast wind and the disk. The infrared spectrum shows evidence for both carbon-rich dust (PAHs) and oxygen-rich dust (silicates).
3.1.3 NGC 6302
NGC 6302 or the ‘Butterfly Nebula’ is one of the infrared brightest PN. It has one of the hottest central stars known with T K (Casassus et al. 2000). Together with the high abundance of nitrogen and helium in the nebula (Aller et al. 1981) this points to a massive progenitor. It is a Type I PN, with a highly bipolar outflow and a thick dusty ‘disk’. The spectrum shows highly excited forbidden emission lines (up to [Si VII] for NGC 6302). Roche & Aitken (1986) already detected the PAH-features at 8.6 and 11.3 micron, and Cohen et al. (1989) presented evidence for the 6.2 and 7.7 micron PAH feature. Both observations indicate the presence of carbon-rich material. On the other hand Payne et al. (1988) detected an OH-maser, normally associated with oxygen-rich environments. This dichotomy in the dust is also present in our ISO spectrum, where we find the PAH-features and the crystalline silicates. The presence of an equatorial disk-like structure has long been known (Meaburn & Walsh 1980; Lester & Dinerstein 1984; Rodriguez et al 1985) and can also be seen as a dark (dust) lane on images of this PN. The 30 to 45 m part of the spectrum has first been published by Waters et al. (1996), Beintema (1998) showed the complete SWS spectrum while the LWS spectrum was shown by Barlow (1998).
The full ISO spectrum of NGC 6302 has been discussed by Molster et al. (2001b).
3.1.4 MWC 922
The evolutionary status of MWC 922 is unclear, it was placed among the unclassified B[e] stars by Lamers et al. (1998). Both a pre-main sequence (Thé et al 1994) as well as a post main sequence status (Voors 1999) have been suggested. The distance to this object is unknown. The star is projected on the Ser OB1 association, which is at 1.7 kpc. However, there is no independent evidence that MWC 922 should be associated with Ser OB1. Simon & Dyck (1977) found an infrared excess at 20 and 25 m. Meixner et al (1999) observed this object at 8.2 and 12.2 m and marginally resolved it. Its broad spectral energy distribution and rather high mm continuum flux are not compatible with a spherically symmetric (continuous) dusty outflow, and we classify the star as disk-like. Spectra taken with the Kuiper Airborne Observatory (KAO) data show strong PAH emission (Cohen et al. 1989), which usually is found in carbon-rich environments. The ISO spectrum shows that oxygen-rich material is also present.
The continuum divided LWS part of the spectrum was already shown by Barlow (1998), while the SWS part was shown by Voors (1999).
3.1.5 AC Her
AC Herculis is an RV Tauri star, with a stable pulsation period of 75.47 days (Zsoldos 1993). The star was found to be a binary with a period of 1194 days (van Winckel et al. 1998). The narrow velocity width of the CO rotational line emission (Jura et al. 1995) suggests Keplerian rotation in a disk rather than outflow. Also, very strong mm continuum flux (van der Veen et al. 1994) indicates the presence of large grains, which suggests a long storage time and therefore a (planet forming?) dust disk. The infrared spectrum of the binary star AC Her is strikingly similar to the spectrum of the comet Hale Bopp (Molster et al. 1999a). The SWS spectrum longwards of 7m has already been shown by Molster et al (1999a) and is briefly discussed by van Winckel et al. (1998). Recently, the evidence for a disk has been provided by Jura et al. (2000). They found a dust ring with a radius of approximately 300 AU in an image taken at a wavelength of 18.7 m.
3.1.6 HD 45677
HD 45677 is a well studied B2 star whose evolutionary status is still unclear. A pre-main sequence nature has often been suggested for this star, however its isolated position (HD 45677 is not associated with nebulosity) and the absence of Algol-like variations and ‘blueing’ effect make this questionable. Lamers et al (1998) also discuss this star and place it amongst the ‘unclassified’ B[e] stars. They propose that it is an extreme example of a classical Be star. Polarization measurements show that the circumstellar material is located in a disk (Schulte-Ladbeck et al. 1992). Also, the strong absorption cores of the Na I D and Ca II K lines indicate the presence of an optically thick disk at zero velocity (de Winter & van den Ancker 1997). This disk was already present before 1950 when a significant disruption took place. After this event, the star dimmed up to mag in 1981 without significant change in the colours. This is most easily explained by the production of large (= grey) particles (de Winter & van den Ancker 1997).
The spectrum of this star has already been published by Voors (1999) and Malfait (1999), who also modeled it.
3.1.7 89 Her
89 Her is a high galactic latitude F2 Ibe supergiant with a temperature of about 6500 K (Waters et al. 1993). Waters et al. (1993) confirmed the binary hypothesis of Arrelano Ferro (1984), finding an orbital period of 288.4 days. The CO(1-0) and CO(2-1) line observations show a narrow ( km/sec) central spike on top of a broader ( km/sec) weak component (Likkel et al. 1991). This profile is very different from the profiles seen from detached shells, and may represent gas orbiting in a flattened disk-like structure. Several other arguments for the presence of a disk, such as the lack of energy balance between the UV and IR, are given by Waters et al. (1993). Alcolea & Bujarrabal (1995) imaged 89 Her in CO(1-0) and found an outer shell, which likely originates from a heavy mass loss period experienced by the star in the past. This eruption of mass was probably triggered by the companion by a Roche lobe overflow or even by a common envelope phase, and ended the AGB evolution of 89 Her. It is likely that during this period also the disk was formed.
3.1.8 MWC 300
MWC 300 is classified as a B1 Ia+ hypergiant by Wolf & Stahl (1985). With a luminosity of L⊙ the star is at 15.5 kpc and about 500 pc above the Galactic plane. Henning et al. (1994) detected MWC 300 at sub-mm wavelengths and pointed out that for the derived distance of 15.5 kpc (Wolf & Stahl, 1985) the total dust mass in the circumstellar envelope would be in the order of 300 M⊙, which seems unrealistically high. Different attempts were made to spatially resolve this object (Skinner et al. 1993; Ageorges et al. 1997; Leinert et al. 1997; Pirzkal et al 1997), but they were all unsuccessful. This indicates that the dust is indeed circumstellar and not associated with nearby nebulosity. A more realistic circumstellar dust and gas mass of a few M⊙ would result in a much smaller distance (an order of magnitude) and therefore a luminosity of about 104 L⊙. This new luminosity together with its extended atmosphere characteristics would classify this star as an evolved low mass star (Voors 1999). Winckler & Wolf (1989) and Hamann and Persson (1989) both argue that MWC 300 is surrounded by a (slowly expanding) disk-like structure and a low density wind near the poles.
3.1.9 HD 44179
HD 44179 is the central star in the X-shaped Red Rectangle nebula (Cohen et al. 1975). It is an A type supergiant with an effective temperature of about 7500 K in a binary system (P=318 days), surrounded by a circumbinary disk (Waelkens et al. 1996), which we see (almost) edge on. The central star is heavily obscured by this disk and only seen in reflection by scattering lobes below and above the plane of the disk. The optically thick disk has been imaged with high resolution in the optical and near-IR by e.g. Roddier et al. (1995) and Osterbart et al. (1997). The CO(1-0) and CO(2-1) show very narrow ( km/sec) line emission (Jura et al. 1995), atypical for detached AGB remnants. The mm and cm continuum flux of this source is rather high and suggests the presence of large (mm-sized) grains (Jura et al 1997). These grains are likely to be formed in the long-lived circum-binary dust disk. The similarities with the disks around young stars lead to speculations about possible planet formation around this evolved star (Waters et al. 1998). The detection of a mysterious dust clump around HD 44179 by Jura & Turner (1998) feeds this interesting speculation. The star has both carbon-rich, as evidenced by the PAH-features, and oxygen-rich dust, as evidenced by the crystalline silicate features. The PAHs are predominantly present in the scattering lobes, while the crystalline silicates are expected to be present in the disk (Waters et al. 1998).
The SWS part of the spectrum was already shown by Waters et al. (1998).
3.1.10 Roberts 22
Roberts 22 is a bipolar reflection nebula, whose evolutionary status has recently been determined as being post-AGB (see e.g. Sahai et al. 1999). Allen et al. (1980) found that the central star is completely obscured by a central dust lane and they determined the spectral type of this object from the two reflection lobes, which gave identical spectra (A2 I). At a distance of 2 kpc (Allen et al. 1980; Sahai et al. 1999) its total luminosity is L⊙. From IR and the CO emission line data the progenitor (AGB) mass-loss rate was about M⊙/yr. Roberts 22 has a time-variable OH maser (Allen et al. 1980), which is mainly located in the central waist, but is also seen in the northern and southern scattering lobes (Sahai et al. 1999). The velocity distribution of the OH masers might be interpreted as a rotating disk, which is seen almost edge-on. The fact that the OH is also seen in the the lobes suggests that the disk is being disrupted, probably due to the fast wind (450 km/sec) seen in H (also time variable) arising from the central star. The spectrum of Roberts 22 also shows both PAH-features as well as the infrared features of crystalline silicates.
Part of the spectrum was shown by Molster et al. (1997).
3.2 Outflow sources
3.2.1 Vy 2-2
Vy 2-2 is classified as a compact planetary nebula surrounded by a fossil molecular envelope from the progenitor AGB star (Jewell et al. 1985 and references therein). Lamers et al. (1998) classified this star as a compact planetary nebula B[e] star. This very young PN has both an ionized zone and a neutral, molecular cloud. The ionized nebula has been resolved as a thin shell extending to both at 15 Ghz (Seaquist & Davis 1983) and in H (Sahai & Trauger 1998). The inner radius was estimated to be . Only the blue shifted OH maser component is detected in Vy 2-2. This is not in contrast with a homogeneous spherically symmetric outflow, because that scenario predicts that the red shifted component is absorbed (Seaquist & Davis 1983). Although the quality of the spectrum is low, due to mispointing, we decided to keep it in our sample since it was the only young O-rich PN.
3.2.2 HD 161796
HD 161796 is a high galactic latitude F3 Ib supergiant. Skinner et al (1994) determined a distance of 1.2 kpc and therefore a luminosity of 3600 L⊙. Its photosphere has low metallicity and an enhanced nitrogen abundance, implying that it is an evolved Population II object (Luck et al. 1990). The shape of the very strong CO emission found by Likkel et al. (1991) resembles the profile of mass-losing AGB stars and confirms the post-AGB nature of this object. The expansion velocity determined from this line is about 12 km/sec, a typical value for AGB stars. Skinner et al. (1994) resolved the envelope around this source in the mid-IR (10.5 and 12.5 m). They found an expanding dusty equatorial toroid in a final phase of strongly enhanced, equatorially concentrated mass loss, which stopped about 240 years ago. During this mass-loss burst the mass-loss rate was about M⊙/yr. Meixner et al. (1999) confirmed these results. The continuum divided LWS spectrum was already presented by Barlow (1998).
3.2.3 OH 26.5+0.6
OH 26.5+0.6 is an extreme OH/IR star, which shows evidence of two mass-loss regimes: a superwind phase in which the mass-loss rate is M⊙/yr which started about 200 years ago, and an earlier AGB phase with a mass-loss rate of about M⊙/yr (Justtanont et al. 1994, 1996a). The transition between these two phases was probably very short ( yr). The total mass lost during the superwind phase has been estimated to be M⊙ (Justtanont et al. 1996a). Infrared speckle interferometry at 9.7 m (in the silicate feature) gives an angular size for the circumstellar dust shell of , while the angular size of the dust shell outside this feature (at 8.7 m) is less than (Fix & Cobb 1988). This difference is caused by the enhanced opacity in the 10 m silicate feature, therefore the dust seen at these wavelengths is located at larger radial distances and is cooler than the dust seen on either side of the feature.
The spectrum of OH 26.5+0.6 has already been shown by Sylvester et al. (1999).
3.2.4 HD 179821
HD 179821 is a G5 Ia supergiant at a distance of about 6 kpc (Zuckerman & Dyck 1986; Hawkins et al. 1995; Jura & Werner 1999). At this distance the star would have a luminosity of about L⊙, far above the AGB luminosity limit. If the star is indeed massive, the origin of the dust envelope was probably the Red Supergiant phase. In that case, the star may evolve to the Wolf-Rayet phase, before exploding as a supernova. The dusty envelope has been resolved at MIR wavelengths (Hawkins et al, 1995; Jura & Werner 1999). A ring-like structure was found with an inner radius of ( cm at a distance of 6 kpc). This implies that the mass loss burst has stopped about 1500 years ago. In CO (Bujarrabal et al. 1992) and NIR scattered light (Kastner & Weintraub 1995) the dust envelope was found to extend to at least , indicating that the mass loss burst lasted for at least 6000 yr. With a derived gas mass loss rate of the order of M⊙/yr (Kastner & Weintraub 1995), about 6 M⊙ was lost by the star during this mass-loss burst. This value is similar to that found by Jura & Werner (1999) based on submillimetre measurements, if a gas-to-dust ratio of 200 is assumed. From infrared imaging (Jura & Werner 1999) and maps in CO (Bujarrabal et al. 1992), it is seen that the gas and dust distribution is not spherical. Part of the spectrum of this source was already shown by Waters et al. (1996).
3.2.5 AFGL 4106
AFGL 4106 has been discussed by Molster et al. (1999b), and is a high mass (15 to 20 M⊙) binary with two almost equally luminous stars with temperatures of about 3750 K and 7250 K. The binary is located at a distance of about 3.3 kpc. During about years, the more massive star in the system (now the warmer of the two) had a gas mass-loss rate of about M⊙/yr, which gives a total expelled mass of about 4 M⊙. This huge mass-loss burst ended about 450 years ago. Mid-IR imaging by Molster et al. (1999b) shows an asymmetric detached dust shell.
3.2.6 NML Cyg
NML Cyg is an M6 supergiant at a distance of 1.8 to 2 kpc (Morris & Jura 1983; Bowers et al. 1983) with a luminosity of L⊙, implying a main sequence mass of 50 M⊙. The present-day mass loss rate is between (from OH and IR; Netzer & Knapp 1987) and M⊙yr-1 (from CO; Knapp et al. 1982). The dust shell has been partially resolved by Fix & Cobb (1988) in the N-band (10 m). They found an outer radius of , which corresponds to about cm. Monnier et al. (1997) found the same value for their outer dust shell, and detected a second dust shell, located inside the first one, at about . The outflow velocity determined from the 1612 MHz OH maser line is 27.7 km/sec (Bowers et al. 1983). In the H2O maser map an asymmetry is found at subarcsecond-scales (Richards et al. 1996). This is also seen in the OH maser maps on scales of a few arcsec, indicating that this asymmetry comes from the inside and is not due to external factors. Parts of the ISO spectrum were already shown by Justtanont et al (1996b) and Waters et al. (1996).
3.2.7 IRC+10420
IRC+10420 is an A5 Ia+ hypergiant with a large IR-excess. It is found to be continuously evolving from a cooler (F8 Ia+; Humphreys et al. 1973) to a hotter spectral type (A5 Ia+; Oudmaijer 1998 and references therein). IRC+10420 is at a distance of kpc which gives it a luminosity of about L⊙, just below the Humphreys-Davidson limit. From CO and OH measurements, an outflow velocity of 40 km/sec has been derived (Nedoluha & Bowers 1992; Bachiller et al. 1988; Lewis et al. 1986). Kastner & Weintraub (1995) found from their near-IR polarimetric maps that the dust envelope extends to , which implies a dynamical age of the dust in the outer layers of about 5000 years. The mass loss rate that created the dust shell was of the order of M⊙/yr, and a total of 5 M⊙ of gas and dust is present in the shell: a significant fraction of the 40 M⊙ which it probably had on the main sequence. Bowers (1984) observed this star in the 1612 and 1667 MHz OH maser lines and found indications for multiple shells in OH extending out to . This suggests that the mass loss went in bursts and was not constant in time. The circumstellar dust shell has been resolved in the mid-IR at 8.7, 9.8 and 20.6 m (Fix & Cobb 1988; Jones et al. 1993; Meixner et al. 1999). In these images an elliptical structure is found, which Oudmaijer et al. (1994) attribute to a bipolar outflow, which is beamed into our direction.
4 Description of the complexes
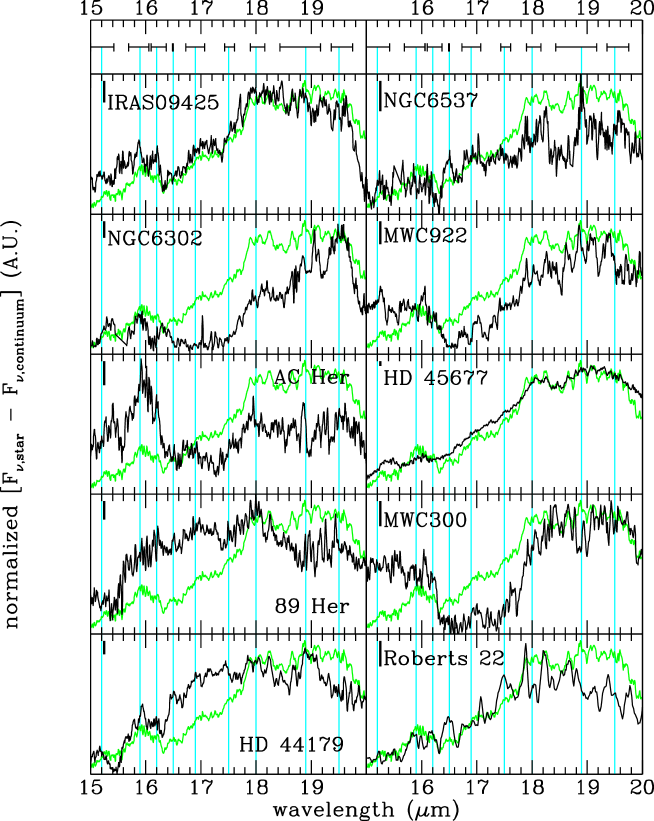
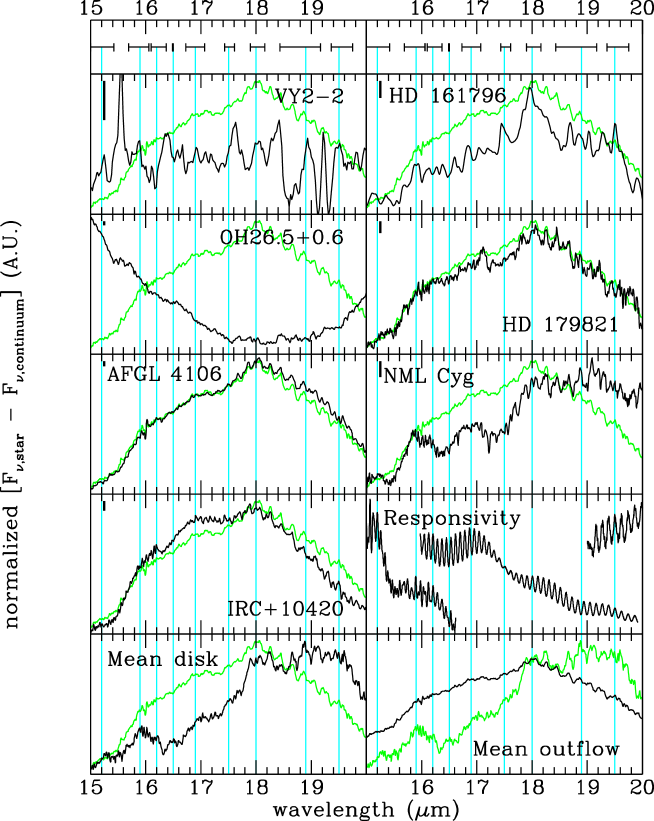
In this section we discuss the individual spectra with respect to the mean spectra and with respect to each other. In Fig. 6 to Fig. 20 we show the emission (and in a few cases the absorption) complexes of the individual stars and compare them with the mean spectra for every complex. In these figures we indicate the noise level and the wavelength (spread) of the individual features. The noise level is the mean 3 noise level, but might change with wavelength in one complex; e.g. due to a significant change in continuum level or to changes in SWS-band and therefore detector characteristics. These effects are particularly present in the 10 and 28 micron complexes. Here, we limit the discussion to the featuress that we are confident are real. In Appendix A we discuss some more dubious detections and artifacts.
4.1 The 10 micron complex
4.1.1 Disk sources
IRAS09425-6040: The 10 micron complex of IRAS09425-6040 is still dominated by the carbon star and its present outflow, therefore C-rich molecules are found in absorption and prominent SiC emission is seen in the 10 micron complex. No clear evidence for crystalline material has been found.
NGC 6537: The 10 micron complex of NGC 6537 is dominated by PAH features, and no evidence for (crystalline) silicate features has been found.
NGC 6302: The 10 micron complex of NGC 6302 is dominated by PAH features, and no evidence for (crystalline) silicate features has been found.
MWC 922: The 10 micron complex of MWC 922 is dominated by PAH features. Around 10 micron, absorption features seem to be present, which line up very well with the position of crystalline silicate emission features in other stars. Since crystalline silicates are not abundant in the ISM, this must be circumstellar material, It is one of the few sources where crystalline silicates are found in absorption in the 10 micron complex.
AC Her: The 10 micron complex of AC Her is one of the best examples of the presence of crystalline silicates. All crystalline silicate features are found in this source (in emission). This complex is well fitted by only crystalline silicates (paper III), but an amorphous component cannot be excluded.
HD 45677: Crystalline silicate features are found in the 10 micron complex of HD 45677. The 10 micron amorphous silicate feature peaks at shorter wavelengths than for e.g. AC Her.
89 Her: 89 Her is the third source showing a clear evidence of crystalline silicates in its 10 micron complex. Still, the weakness of the 8.3 micron feature suggests that the complex is dominated by the 10 micron amorphous silicate feature. The peak position is red shifted with respect to the ISM absorption feature (which is at 9.7 m), an indication of the presence of large grains.
MWC 300: The 10 micron amorphous silicate absorption feature is remarkable. There seems to be some substructure in the 10 micron complex, which might be explained by crystalline silicate features in emission. However, apart from the prominent 8.3 micron feature, these are always seen only in one scan direction and are therefore not trusted. The 8.3 micron feature is very similar to the ones in AC Her, 89 Her and HD 45677, all sources which have crystalline silicate emission in the 10 micron complex. In MWC 300 it seems that there is amorphous silicate absorption. The E(B-V) to this star is 1.19 (Voors 1999) which corresponds to an AV of 3.7, assuming a normal reddening law. This would correspond to a using the extinction law of Sandford et al. (1995). Based on the ISO spectra we derived . The interstellar extinction curve presented by Roche & Aitken (1984) would give , which still above the observed . The lower value from the ISO data suggests that the shape and strength of this feature is not only due to interstellar absorption. A natural explanation would be that the interstellar absorption profile is filled in by circumstellar emission. The central wavelength of this broad circumstellar emission feature is likely shifted from the 9.7 m interstellar absorption peak, because the observed profile does not look like the typical interstellar absorption profile. This shift to longer wavelengths might be explained by large grains (see Fig 8).

HD 44179: The 10 micron complex of HD 44179 is dominated by PAH-features. No crystalline silicates seem to be present. A possible crystalline silicate feature might be seen around 10.8 m, however at about the same position a feature is seen in genuine PAH-sources, and attributed to a PAH cation.
Roberts 22: The 10 micron complex is dominated by PAH features. The noise in the spectrum prevents us from reaching a conclusion about the presence or absence of crystalline silicate features.
4.1.2 Outflow sources
Vy 2-2: The 10 micron complex of Vy 2-2 is dominated by the amorphous silicate feature, which is relatively broad. This feature starts at relatively blue wavelengths which suggests that the 8.3 micron feature is present. Because of the noise level (increasing with wavelength) no statements could be made about the presence of other crystalline silicate features. At 12.8 m the [Ne II] line is found.
HD 161796: As in all outflow sources, the 10 micron feature in HD 161796 is dominated by the 10 micron amorphous silicate feature. The signal to noise level is too low to detect the crystalline silicate features.
OH 26.5+0.6: The 10 micron complex is dominated by amorphous silicate absorption. Some structure seems present, however the absorption pattern cannot be matched with the features of crystalline silicates seen in other stars. Emission is not expected here, since at longer wavelengths we do see crystalline silicate features in absorption. The origin of the substructure therefore remains unclear.
HD 179821: The 10 micron complex is dominated by the red-shifted amorphous silicate feature. The shape and position resembles the feature of AFGL 4106 where it has been attributed to the presence of large grains (Molster et al. 1999b).
AFGL 4106: This complex is characterized by the 10 micron amorphous silicate feature. The sharp feature at 11.06 m is instrumental; no correction, as in the other sources, has been applied to this feature. There is no evidence for crystalline silicate features.
NML Cyg: The 10 micron feature is dominated by amorphous silicate absorption. The emission wings, at both sides together with the location of the center of the absorption profile suggest that it is mainly self absorption. A (small) contribution from interstellar extinction cannot be excluded or confirmed. The substructure at 9.39, 9.54, 10.07, 10.33, 10.76 and 11.0 m is due to gas-phase NH3 (Yamamura private comm.).
IRC+10420: The 10 micron feature is dominated by amorphous silicate emission. It peaks at a wavelength significantly offset from the usual 9.7 micron feature. This might be due to large grains, as in AFGL 4106. Fix and Cobb (1988) also suggested the presence of large grains to explain the 10 over 20 micron amorphous silicate ratio (see Fig. 8). There are indications of substructure in the amorphous silicate feature, which is also seen in stars with prominent 10 micron crystalline silicate features. Interestingly enough no 11.3 micron feature (attributed to forsterite) is detected. This suggest that the forsterite abundance and/or temperature is probably very low, in contrast to the enstatite abundance. It should be noted that in the rest of the spectrum the forsterite features are weak or not detected.
4.2 The 18 micron complex
4.2.1 Disk sources
IRAS09425-6040: The 18 micron complex of IRAS09425-6040 is quite similar to the mean 18 micron complex of the disk sources, both with regard to the positions of the features as well as in the strength of the features.
NGC 6537: Because of the low dust temperature, the 18 micron complex is less prominent than in other sources. Still, most prominent features are easy to recognize. The 18.1 micron feature is relatively strong compared to the other features. The 18.9 and 19.5 micron features are nicely separated. The sharp feature at 18.88 m is unidentified; see the Appendix for more details on this feature.
NGC 6302: The 18 micron complex of NGC 6302 is dominated by crystalline silicates. The 19.5 micron feature is relatively strong compared to the 18.1 micron feature.
MWC 922: Compared to the mean disk spectrum, MWC 922 shows a drop around 16.5m. It is quite similar to what has been found for MWC 300. In Sec 4.1.1 it has been argued, that the 10 micron complex of MWC 300 is likely to be filledin interstellar absorption. MWC 922 has an E(B-V) (Voors 1999), which is higher than for MWC 300. It is not known which fraction is due to interstellar and which is due to circumstellar reddening, but this high value leaves the possibility of filled in interstellar absorption open. One would expect to see evidence for this hypothesis in the 10 micron complex. Unfortunately that complex is dominated by PAH features, which will fill in any absorption profile and make it more difficult to recognize, since these features are located on the slopes of the silicate absorption profile, masking its presence. The absorption by crystalline silicates in the 10 micron complex suggest that circumstellar amorphous silicates will also be in absorption at 10 and 18 m. Another indirect argument for interstellar absorption in the 18 micron complex is the peak wavelength of the absorption feature. It is much bluer than the peak wavelength of the amorphous silicates found in emission in the disk sources.
This is the only star where the 17 micron feature is clearly divided into a 16.7 and 17.0 micron feature. In other sources where these features are found, they are severely blended. A closer look at the mean disk spectrum indicates that this feature is a blend of 2 features, even if one excludes MWC 922 from this mean spectrum. It is also found in the two independent observations of MWC 922, so all these arguments make us confident about the reality of these two features. The 19.5 micron feature is the bluest found in our sample. There seems to be weak structure on top of the 18.1 micron feature, which is also found in HD 44179.
AC Her: The 18 micron complex is dominated by the 15.3, 15.9 and 16.2 micron features. These features are relatively strong because of the high temperature the crystalline silicates around this source attain. As in MWC 300 and 89 Her, the 18.9 micron feature is rather blue-shifted. This object has a low E(B-V) due to interstellar extinction (). This low value of the interstellar E(B-V), the strength of the 15.9 and 16.2 micron features, and the fact that the spectrum returns to the same level around 15 m, suggests that the spectral structure around 17 m in this object is caused by the 16.2 and 18.1 micron features. Note that in this source the spectrum drops at 18 m, while in MWC 300 and MWC 922 the spectrum still rises longwards of 18 m, indicating that in the latter sources the 18.1 micron feature is on a slope.
HD 45677: The 18 micron complex of HD 45677 is very similar to the mean disk spectrum. It shows evidence for the presence of amorphous silicates. On top of the amorphous silicate feature, weak crystalline silicate features are found. Among the disk sources, it is the object with the most distinct presence of amorphous silicates. The amorphous silicate feature peaks at a rather red wavelength, which might be an indication of relatively large grains. However, there is only a small shift in the 10 micron complex, which suggest that the grains are relatively small. Therefore a compositional difference of the dust particles is more likely to explain the red peak position. We can also not exclude that there are contributions from other materials, such as simple oxides and/or other silicates.
89 Her: The 18 micron complex of 89 Her shows a broad emission plateau, unlike most disk sources. This is evidence for the presence of amorphous silicates. Its profile is rather broad, with a prominent blue wing. On top of this amorphous feature, the crystalline features are present. The 18.0 micron feature is relatively strong. Similar to MWC 300 and AC Her, the 18.9 micron feature is severely blue-shifted (towards 18.49 m in this source), which makes the 19.5 micron feature rather prominent. The 16.9 micron feature is more pronounced than in most spectra.
MWC 300: The 18 micron complex of MWC 300 is characterized by (interstellar) silicate absorption together with circumstellar silicate emission. The circumstellar amorphous silicate emission profile is red-shifted with respect to the normal (=interstellar) amorphous silicate profile. This might indicate that large grains are present, a fact which can also be inferred from the high mm continuum flux (Henning et al. 1994). The different features of crystalline silicates are visible in the spectrum, although influenced by interstellar absorption. The clearest example of a feature influenced by interstellar absorption, is the 18.0 micron feature. In most sources it is one of the strongest features in the 18 micron complex, while in MWC 300 it is rather weak, since it has to fill up part of the interstellar absorption feature. The removal of the interstellar absorption profile is likely to reveal a prominent 18.0 micron feature in MWC 300 too. The shape of the 18.0 micron feature is also influenced by the blue-shifted 18.9 micron feature, a shift which was also found in AC Her and 89 Her. The 19.5 micron feature is prominently present and rather broad, as is also seen for the AC Her and 89 Her. In the spectrum of MWC 922 the often blended 16.9 micron feature is split into two sharp features at 16.7 and 17.0 m. In the spectrum of MWC 300 only the sharp 17.0 micron feature is present, while the 16.7 micron feature is missing.
Crystalline silicates also influence the shape of this complex. The 18.1 and 16.2 micron features are located at the positions of the rise in the ‘absorption’ feature. This also leads to a change in the feature appearance and is another proof of silicate emission together with interstellar absorption. We exclude the possibility of no absorption at all and only emission features, because this would lead to a broad emission plateau between the 10 and 18 micron region, which has not been observed in other stars. Narrow absorption like profiles are also found in the spectra of MWC 922, AC Her, IRAS09425-6040 and NGC 6302 (see Fig.9). However, in most of these cases it is caused by strong 16.2 and 18.1 micron features. This is evidenced by the decrease of the flux (in the continuum subtracted spectra) on the blue side of the blend of the 15.9 and 16.2 micron features. This drop is not seen in MWC 300 nor probably MWC 922.
HD 44179: It cannot be excluded that part of the features in this complex originate from a carbon based chemistry. The 18 micron complex differs in several respects from the mean disk spectrum. The 18.9 micron feature is the strongest seen in this sample. The spectrum around 15 m is influenced by CO2 absorption at 13.9, 14.9, 15.3 and 16.2 m. Without these absorptions the feature at 15 m would be very similar to the one found in 89 Her. The 15.9 and 16.2 micron features are rather prominent, although not as strong as in AC Her. The 16.5 micron feature, probably a PAH-feature (Van Kerckhoven et al. 2000), is present in both the AOT01 and the AOT06 spectrum and seems therefore rather secure. The only other star where this feature has been detected is NGC 6537. Also, longwards of 16.5 m these two stars look quite similar, with similar features at 16.9, 18.0 and 18.9 m. The 3 features found around 18 m (at 17.8, 18.0 and 18.2 m) are seen in both the AOT01 and the AOT06 spectra as well as in the up and the down scans and there is not much doubt about their reality. The 19.5 micron feature is rather weak in HD 44179.
Roberts 22: The 18 micron complex is rather noisy, preventing the measurement of the individual components. The gentle slope at the blue side of the amorphous silicate feature suggests the presence of some crystalline silicates around 16 m. Other crystalline silicate features might be present but the noise prevents their detection.
4.2.2 Outflow sources
Vy 2-2: Unfortunately no interesting features could be confirmed in this wavelength range, because of the low signal to noise ratio. The emission line at 15.56 m is [Ne III].
HD 161796: The 18 micron complex of HD 161796 is dominated by the 18.1 micron feature. However, one should be careful with the interpretation of this feature (see Appendix for more details). The 19.5 micron feature is relatively strong.
OH 26.5+0.6: The 18 micron complex of OH 26.5+0.6 is an absorption spectrum. Both the amorphous and the crystalline silicates are seen in absorption. We can recognize most of the features which are normally seen in emission. All absorption features are slightly red-shifted, we speculate that this red-shift is due to a temperature effect (Bowey et al. 2000). It is clear from the absorption profile that crystalline silicates only play a minor role in the spectrum (at these wavelengths).
HD 179821: This complex lies on a very steep slope. It shows the characteristic outflow source spectrum. It much resembles AFGL 4106 and IRC+10420, two other massive stars. It is dominated by the 18 micron amorphous silicate feature. On top of this feature, weak crystalline silicates can be detected.
AFGL 4106: The 18 micron complex of AFGL 4106 is very similar to the mean outflow spectrum, a broad amorphous silicate feature with weak crystalline silicate features on top. No differences between the mean spectrum and AFGL 4106 were found.
NML Cyg: The 18 micron amorphous silicate absorption is less prominent than for similar high mass star IRC+10420. This might indicate that the 18 micron amorphous silicate band is just in the regime between self-absorption and emission. Whatever the reason, it makes the crystalline silicates more apparent. Most crystalline silicate features are clearly seen. Still, the 19.5 micron feature seems absent.
IRC+10420: The 18 micron spectrum is very similar to the mean outflow spectrum. A strong amorphous component is seen with some weak crystalline silicate features on top of it.
4.3 The 23 micron complex
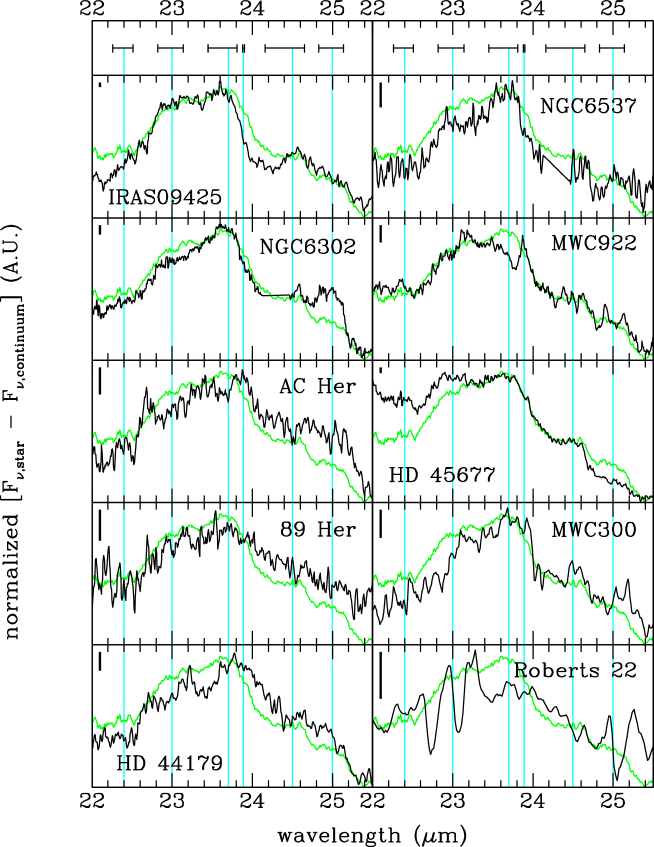
4.3.1 Disk sources
IRAS09425-6040: As for the 18 micron complex, the 23 micron complex in this source is also quite similar to the mean 23 micron complex for the disk sources. There are some differences: The slope to the short wavelength side continues to shorter wavelengths than in the mean disk spectrum and the plateau does not show the step-like structure seen in the mean (disk) spectrum. The 24.5 micron feature is relatively strong.
NGC 6537: The 23 micron complex of NGC 6537 is characterized by a very strong 23.7 micron feature and relatively weak 23.0 micron feature. Although the 24.5 micron feature is severely influenced by the [Ne V] emission line, the step-like structure is visible in the plateau.
NGC 6302: The main differences between the mean 23 micron complex and the 23 micron complex of NGC 6302, is found in the strength of the 23.0 and 25.0 micron features. The 23.0 micron feature is slightly weaker than average while the 25.0 micron feature is significantly stronger.
MWC 922: The most striking aspects of the 23 micron complex of MWC 922 is the strong 23.9 micron feature and thus the relative weakness of the 23.7 micron feature. Also the 23.1 micron feature is relatively strong. However, there is no correlation between these two features; e.g., compare MWC 922 with AC Her.
AC Her: The 23 micron complex differs in several respects from the mean spectrum. The feature at 22.69 m has a remarkable shape: it is sharp and rather prominent. It appears very similar to a feature in HD 44179, but there it is weaker. However, there are some questions about the reality in AC Her (see the Appendix). If this feature can be attributed to the 23.0 micron feature it is the most blue-shifted, which implies that also the 23.7 micron feature is significantly blue-shifted. Alike to MWC 922, there is a 23.89 micron feature present. The 24.5 micron feature in the spectrum of AC Her is not as prominent as in the mean spectrum.
HD 45677: The 23 micron complex of HD 45677 is rather similar to the mean 23 micron disk complex. Still there are two subtle differences. The 25.0 micron feature is weaker in HD 45677 than in the mean spectrum, while at the blue side of this complex the 23.0 micron feature is stronger than in the mean spectra. This is exactly the opposite of what is found in NGC 6302.
89 Her: The 23 micron complex of 89 Her is rather smooth and few individual structures can be recognized. The broadness of this complex is similar to the complexes, including the plateau, seen in other sources. The width of the features seems larger than in the average disk spectrum and this may cause severe blends. Still, better signal-to-noise will probably unveil similar structures to those found in the other sources,
MWC 300: The 23 micron complex attracts attention because of the absence of the red shifted 23.0 micron feature. Two of the components of the 25 micron plateau are quite clear in this object.
HD 44179: Where the 18 micron complex looks quite similar to NGC 6537, the 23 micron complex is rather different. It has a rather prominent 23.0 micron feature and the slope at the red side of the 23.7 micron feature is very gentle. There are indications for the step-function of the plateau but the noise level prevents strong conclusions. The 23.0 micron feature is rather prominent and blue-shifted with respect to the mean spectrum.
Roberts 22: The 23 micron complex is dominated by noise and by fringes. The strong structures around 23 m and 25 m are due to constructive interference of the fringes in the up and down scan, and the relatively flat structure around 24 m is due to destructive interference of the fringes. The width of the whole structure is quite similar to the mean spectrum width. This suggests that the complex is present but not much can be said about the structure of this complex.
4.3.2 Outflow sources
Vy 2-2: The spectrum in this wavelength range also suffers from a lot of noise. The comparison with the mean outflow spectrum suggests the presence of the 23.0 and 23.7 micron blend.
HD 161796: Apart from the 23.1 and the 23.7 micron features, the most striking feature is the 25.0 micron feature. It is rather blue-shifted with respect to the 25.0 micron features in other sources. Its presence is also confirmed in the rev071 dataset, although the feature there seems less blue-shifted and more in line with the other 25.0 micron features.
OH 26.5+0.6: As in the case of the 18 micron complex, the crystalline features appear as weak absorption features on top of the wing of the amorphous silicate absorption. The blend of the 23.0 and 23.7 micron features is rather narrow compared to the mean spectrum. The 23.89 micron feature seems present in absorption.
HD 179821: As for all outflow sources, the 25 micron plateau is also very weak in this source. The feature at 23.0 micron feature is surprisingly strong and the 23.7 micron feature rather broad. The sharp rise of the 23.0 micron feature, which is typical for the outflow sources, is evident here.
AFGL 4106: The 23 micron complex is somewhat remarkable. The 25 micron plateau is, as for most outflow sources, rather weak and ends already before 25 m. The features around 23 m produce a very flat plateau. Some structure can be detected, but together with IRAS09425-6040 it shows the flattest structure in our whole sample.
NML Cyg: The 23 micron complex is interesting in two ways. The 25 micron plateau is almost absent. However, the blend of the other features is the broadest seen in our sample. In this respect the spectrum is somewhat similar to the 23 micron complex of IRC+10420.
IRC+10420: The 23 micron complex is weak with respect to the continuum and therefore affected by noise. Still we could identify the different features. The complex is also quite broad and alike to what is seen for AFGL 4106 and NML Cyg.
4.4 The 28 micron complex
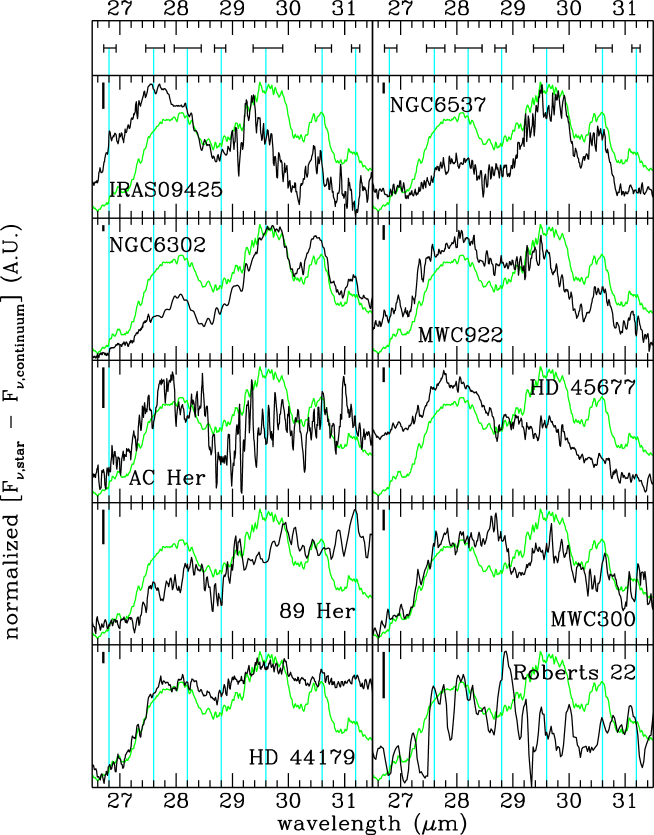
4.4.1 Disk Sources
IRAS09425-6040: The strength of its 27.6 micron feature is an intriguing aspect of the 28 micron complex. It is also very broad and blends with the 26.9 and 28.2 micron features. The 30.6 micron feature is relatively strong. There is a hint of the 31.2 micron feature in the rev084 data. However, this cannot be confirmed by the rev254 data because of the noise level in this area. The 29.6 micron feature peaks at the very blue side of the feature in the mean disk spectrum.
NGC 6537: One of the most interesting aspects of the 28 micron complex in NGC 6537 is the absence of the 31.2 micron feature. The 29.6 and 30.6 micron features are both very strong relative to the 27.6 and 28.2 micron features.
NGC 6302: The 29.6 and 30.6 micron features are very strong compared to other sources, but very similar to NGC 6537. In contrast to NGC 6537, the 31 micron feature is prominent in this source. The strength ratio of the 27.6 micron feature to the 28.2 micron feature is rather low compared to the average.
MWC 922: The 27.6 and 28.1 micron features are relatively strong in this star. Compared to other spectra, the 29.6 micron feature ‘misses’ intensity at the long wavelength side. If the 29.6 micron feature is indeed a blend of two features, then the reddest feature is severely depressed in MWC 922. The 30.6 and 31.2 micron features are clearly present and relatively strong.
AC Her: The 28 micron complex is rather noisy, especially longwards of 29 micron, where band 4 starts, but all features seem present. The 27.6 and 28.2 micron feature are still well visible and rather strong. The 29.6 and 30.6 micron features are hardly detectable above the noise. The sharp and strong peak at 31.0 m is questionable. Still, there are indications of an underlying 31.2 micron feature.
HD 45677: The 28 micron complex of HD 45677 is interesting due to the strong 27.6 and 28.2 micron features. The ratio between the flux of these two features and the 29.6 micron feature is the highest found in our sample. The 30.6 micron feature is also weak, therefore the dust species that causes the prominent 29.6 and 30.6 micron features in NGC 6302 and NGC 6537 must be only a minor component in HD 45677.
89 Her: The 28 micron complex is dominated by the rise of the broad 33 micron band. On top of this feature are the 27.6 and 28.2 micron features. We have possibly found a broad structure around 29.7 m and no indications for a 30.6 micron feature. The 33 micron band together with the low S/N for Band 4 make this a problematic part of the spectrum.
MWC 300: MWC 300 is again a source where the 27.6 and 28.2 micron features are stronger than the 29.6 and 30.6 micron features. The 28.8 micron feature is present in this source, but the sharp peak (at 28.7 m) on top of the 28.8 micron feature has significant uncertainties (see Appendix). Neglecting this peak, the remaining feature lines up very well with the weak feature found in NGC 6537.
HD 44179: The 28 micron complex is, like that of 89 Her, dominated by the onset of the broad 33 micron band. On top of the blue rise of this broad band, the 27.6 and 28.2 micron features are rather prominent (in contrast, for example, to NGC 6302). The 29.6 micron feature seems less pronounced and also the 30.6 micron feature is just above the noise level. The 31.2 micron feature is not detected.
Roberts 22: Because of the flux jumps around band 3E, it was difficult to subtract a reliable continuum for band 3E. We have tried to maintain the relative slope after a jump in the flux. In this way we were able to subtract the continuum, but the relative strength of the features in the different bands (3D, 3E and 4) in this wavelength range is severly influenced by these flux jumps. We measured the bands in this wavelength range using a local continuum. We found the 27.6, 28.2 and 28.8 micron features, all three of which were seen in both the rev254 and the rev084 spectra. The 28.8 micron band is interesting since it is the most red-shifted one from the four stars where this band is found.
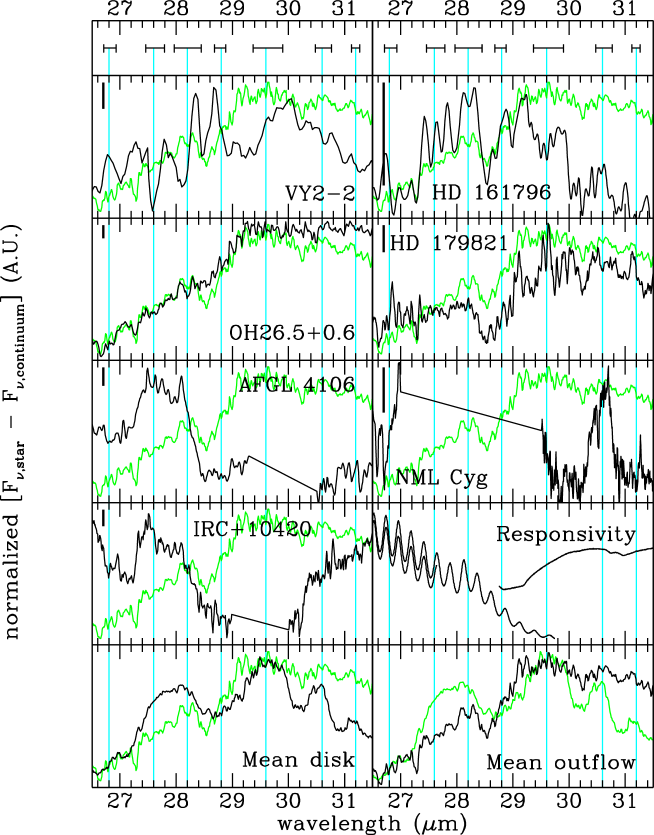
4.4.2 Outflow Sources
Vy 2-2: The beginning of band 4 is less effected by noise. Band 4 has a larger aperture and is therefore less influenced by the mispointing. The 29.6 and 30.6 micron features can be identified.
HD 161796: The noise is rather severe in this part of the spectrum. Still, some features can be identified. The blend of 27.6 and 28.2 micron features is present. The 29.6 micron feature is detected but has an extension at the short wavelength side, in both the up and down scan, which is not seen in the rev071 data. This leaves some uncertainty on the reality of this extension.
OH 26.5+0.6: This is the complex where the absorption spectrum of this source goes into an emission spectrum. The 29.6 micron feature, the first feature in this star which appears in emission, is rather blue-shifted. No 30.6 or 31.2 micron feature is found.
HD 179821: The 27.6 and 28.2 micron features are relatively weak with respect to the 29.6 micron feature. Whether this is a typical outflow source characteristic is difficult to say, because the mean outflow spectrum is rather influenced by this spectrum (see paper II).
AFGL 4106: because of badly corresponding up and down scans we have removed the first part of band 4 (29 to 30.5 m). Still, the 27.6 and 28.2 micron features stand out very prominently, with sharp drops on either side of the blend.
NML Cyg: The end of band 3D and the beginning of Band 3E suffer from spectral leakage from shorter wavelengths, therefore no features are measured in this wavelength range. The 30.6 micron feature is prominent in this spectrum, while, on the other hand, there is no indication of the 31.2 micron feature.
IRC+10420: Part of the spectrum has been removed due to deviating up and down scans. The 27.6 and 28.2 micron features are clearly present, but rather blue-shifted. As in many outflow sources, there is no evidence for a 30.6 or 31.2 micron feature.
4.5 The 33 micron complex
4.5.1 Disk Sources
IRAS09425-6040: The 33 micron complex follows the mean spectrum very well. There are two major discrepancies, the 32.2 micron feature is stronger than in the average spectrum and the plateau drops more steeply at the end, which might be an indication of the 36.5 micron forsterite feature. It should be noted that the peak to continuum ratio of the 33.6 feature is the highest found so far in the ISO database.
NGC 6537: The 33 micron complex of NGC 6537 is characterized by sharp features. The 33.6 micron feature is very prominent The peak caused by the 32.8 micron feature is rather sharp, and much weaker than the 33.6 micron peak. The plateau ends at almost 37 m due to the presence of a 36.5 micron feature. The 34.1 micron feature is seen as a small plateau on the 33.6 micron feature.
NGC 6302: In general, the complex in this source is quite similar to the mean complex structure. However, the 32.8 micron feature is weaker than average in this source.
MWC 922: The 33 micron complex of MWC 922 is characterized by a prominent plateau. The weak structure (at about 33.5 m) on top of the 33.6 micron structure is likely the [S III] emission line. The 32.8 micron feature is slightly stronger than average. The feature at 34.8 m is the [Si II] line.
AC Her: It should be noted that the band 4 data is of low quality, although a lot of spurious points (glitches and glitch-tails) have already been removed by hand. As in the 23 micron complex there is some doubt about one of the most prominent features, the one at 32.6 m (see for more details the Appendix). We note that the 33 and 23 micron complexes have a similar appearance. In the 23 micron spectrum of this source, a sharp feature has also been found at the short wavelength side.
HD 45677: The 33 micron complex of HD 45677 is that of a typical disk source. It has a rather strong 33.6 micron feature and a relatively weak 32.8 micron feature. The main difference is found in the strength of the 35.9 micron feature, which is much stronger in this source than in the mean spectrum. As for NGC 6537, the red side of the 33.6 micron feature shows evidence for the 34.1 micron feature. The plateau extends beyond 37 m.
89 Her: Interpretation of the 33 micron complex suffers from the low flux levels. The three main features (the 32.8 and 33.6 micron features and the plateau) are present. Any substructure is difficult to quantify due to the low S/N. The 32.8 and 33.6 micron features are rather blue-shifted.
MWC 300: The overall shape is very similar to the mean spectrum. The 33.6 and 34.1 micron bands are clearly split in this source, and the structure nicely correlates with the structure seen in AFGL 4106. The plateau extends to almost 37 m and the sharp feature at 34.81 m is the [Si II] line. The 32.8 micron feature is weak but clearly present.
HD 44179: The 33 micron complex can be described as a very broad feature peaking at 33.6 m, a sharp 32.8 micron feature and a plateau extending to wavelengths larger than 37 m. This very broad feature is a blend of the 33.6 and 34.0 micron features. In the 35 micron plateau the different components can be identified.
Roberts 22: The general shape is roughly equal to the mean disk spectrum. We masked the unreliable narrow (0.1 m) peak at 33.3 m (see Appendix for more details), but still the 33.6 micron feature peaks at rather blue wavelengths like 89 Her, which shows a similar complex. The 36.0 micron feature, which is mostly found in outflow sources, is rather strong. It was already stated before that this source shows a lot of outflow characteristics. On the other hand, the strength ratio of the 32.8 micron feature to the 33.6 micron feature is more like that of the disk sources.
4.5.2 Outflow Sources
Vy 2-2: The 33 micron complex suffers also from a low signal-to-noise ratio, but the general structure can be distinguished. The ratio of the 32.8 micron feature to the 33.6 micron feature is rather low in comparison with the rest of the outflow sources. The plateau is relatively strong.
HD 161796: The 33 micron complex of HD 161796 is more like the disk sources than the outflow sources. The 33.6 micron feature is stronger than the 32.8 micron feature. Also the gentle slope at the red side of this last blend resembles the disk sources better than the outflow sources. On the other hand, the 36.0 micron feature is more typical of the outflow sources.
OH 26.5+0.6: The 33 micron complex of OH 26.5+0.6 is rather similar to that of HD 161796; especially the broadness of the whole structure. The main difference between these two stars is found in the 35 micron plateau. The 36.0 micron feature seems present in both sources, but there is some extra absorption around 35.0 m in OH 26.5+0.6.
HD 179821: The 33 micron complex is characterized by the two relatively sharp features at 32.8 and 33.6 micron and, as in the 23 micron complex, a weak plateau. The 33.6 micron feature is one of the sharpest in our sample. We note that there seems to be no evidence for the 36.5 micron feature in both datasets. The strength ratio of the 32.8 to 33.6 micron features suggests that this star is massive and likely a post-red Supergiant.
AFGL 4106: At first sight, the 33.6 micron feature looks much stronger than the 32.8 micron feature, in reality they do not differ so much, because of the presence of a broad 35 micron band in the spectrum of AFGL 4106. This is in accordance with most other outflow sources, where equal strengths for these two features are found. The broad underlying 35 micron band might be similar to the one seen in 89 Her and HD 44179. While it seems to start at a longer wavelength than in the other two sources, this might be an artifact because the data around 30 m have been ignored in this analysis.
NML Cyg: The spurious 32.97 micron feature gives the 33 micron complex its unique appearance. Apart from this detector respons structure the 32.97 micron feature looks normal. The 34.1 micron feature is very clear. Because the 33.6 and 34.1 micron features are found in both the up and down scans of the AOT06 and the AOT01 data, we are confident about their reality. This makes this source one of the stars where they are most clearly separated. At 34.6 m, the OH maser pump line can be found in absorption as was already reported by Justtanont et al. (1996b).
IRC+10420: The 33 micron complex is dominated by the strong 32.97 micron feature, which is predominantly seen in high flux sources, both in the carbon-rich as well as in the oxygen-rich dust environments. Therefore we assume that it is an artificial feature caused by the detector responsivity for high fluxes. Underneath this feature, the usual 33 micron complex is visible, although at a rather low level. The 34.1 micron feature seems rather strong with respect to the 33.6 micron feature, although this last feature is also influenced by the presence of the 32.97 micron feature. Alike to the features found in the 28 micron complex, these features are also blue-shifted with respect to the mean spectrum. In the 35 micron plateau, in which the different components can be detected, the 34.6 m OH maser pumping line is nicely detected in absorption (see Sylvester et al. 1997).
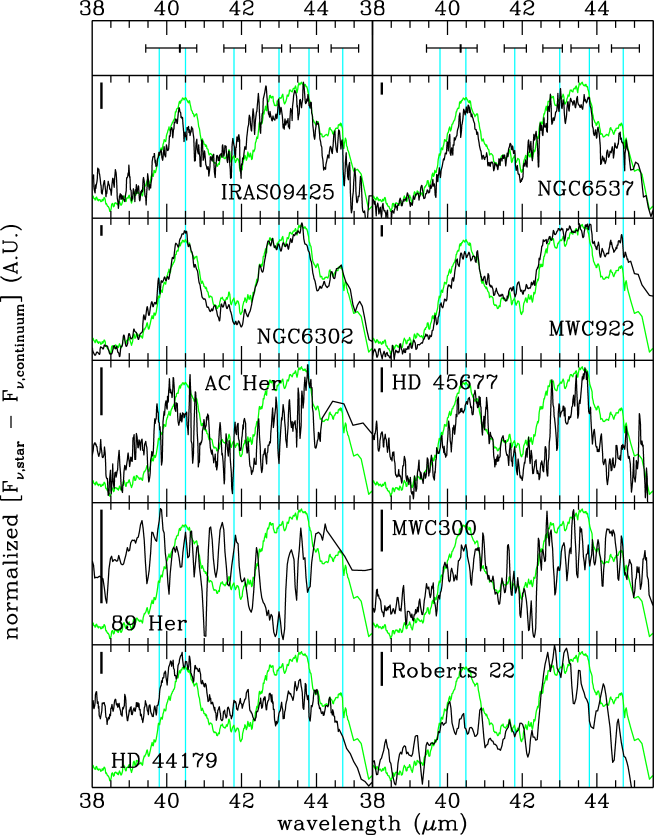
4.6 The 40 micron complex
4.6.1 Disk Sources
IRAS09425-6040: The 40 micron complex is similar to the mean. The most prominent difference is in the strength of the 43.0 micron feature, which is also very blue shifted. This suggests a significant (cold) crystalline water-ice contribution. This would be strange for a disk source and it is very unfortunate that this claim cannot be confirmed by a spectrum of the 60 micron complex.
Another difference is the long wavelength side of the 40.5 micron feature. The short wavelength side of this feature fits the mean spectrum very well, and peaks at a rather blue wavelength. This feature might be a blend (see Paper II). While noisy, this might imply that in IRAS09425-6040 the short wavelength component is dominant over the long wavelength component.
NGC 6537: The 40 micron complex is rather similar to the mean disk complex. The main difference is that the 43.8 micron feature is somewhat weaker than on average. The 41.7 micron feature is rather pronounced in this star.
NGC 6302: The 40 micron complex is also rather similar to the mean disk spectrum. The features in NGC 6302 seem a little sharper than in the mean spectrum. Because of the sharpness of the features, the enstatite and crystalline water ice peaks around 43 m are nicely separated.
MWC 922: The 40 micron spectrum of MWC 922 is rather similar to the mean disk spectrum. All features in the mean spectrum are also seen in MWC 922, and the feature strength ratios are comparable. Only the 44.7 micron feature seems somewhat stronger, but this might be due to the continuum subtraction.
AC Her: The noise in this part of the spectrum makes it very difficult to say more about this feature than that the 40.5 micron feature and the 43.8 micron feature are present. There seems some evidence for the 43.0 micron crystalline water ice feature, which is supported by the LWS data, showing evidence for the 60 micron feature. The 44.7 micron feature is, also visible in the LWS spectrum.
HD 45677: The 40 micron complex does show the usual features, i.e. the 40.5, 41.8, 43.0, 43.8 and 44.7 micron features. The 43.0 and 43.8 micron feature are rather narrow. The 43.0 micron feature is relatively weak. Unfortunately, there is no LWS data to check for the presence and shape of the 60 micron feature.
89 Her: The 40 micron complex is completely dominated by noise and therefore no conclusions can be drawn.
MWC 300: The 40 micron complex of MWC 300 suffers from the low flux level in this part of the spectrum. Still we can disentangle the 40.5 micron feature, the blend of the 43.0 and 43.8 micron features and the 41.8 micron feature.
HD 44179: The 40 micron complex of HD 44179 is interesting because it shows a prominent 40.5 micron feature, but the 43.0 and 43.8 micron features are much less pronounced. The steep slope at the red side suggests that they are present, but part of the spectrum between the 40.5 and 43.0 micron features must have been filled in. This might be due to an exceptionally strong 41.8 micron feature, but the width and wavelength of this feature as measured in the other stars indicate that it is not sufficient to solely account for the closing of the gap between the 40.5 and 43.0 micron features.
Roberts 22: The 40 micron complex is dominated by the 43.0 micron feature, indicating that there is a lot of crystalline water ice. In this respect the spectrum looks somewhat similar to that of HD 161796, although the relative strength of the 40.5 micron feature in Roberts 22 is much stronger than in HD 161796.
4.6.2 Outflow Sources
Vy 2-2: The low signal to noise ratio in this part of the spectrum prevents us from reaching firm conclusions about the structure in this complex. It seems that the 40.5 micron feature and the 43.0 + 43.8 micron blend can be distinguished.
HD 161796: The 40 micron complex is completely dominated by a very strong 43.0 micron (crystalline water ice) feature. There might be a red-shifted 43.8 micron feature in the strong 43.0 feature, but this is difficult to quantify. Most of the features found in other 40 micron complexes are present in this complex. There is an indication that the 40.5 micron feature is in fact a blend of 2 separate bands. Closer inspection of the spectrum suggests that there is a broad band underlying the strong crystalline H2O band. A suitable candidate for this feature might be amorphous H2O ice. This helps the fitting of the 40.5 micron band (Paper III).
OH 26.5+0.6: The spectrum of OH 26.5+0.6 looks very similar to the mean outflow spectrum. Where the spectra of OH 26.5+0.6 and HD 161796 were very similar for the 33 micron complex, they look quite different in the 40 micron complex. The strength ratio of the 40.5 and 43.0 micron features is dramatically different. Still, as for all outflow sources, the 43.0 micron feature is stronger than the 43.8 micron feature. The 44.7 micron feature is also weakly present in this spectrum.
HD 179821: Like HD 161796, the spectrum of HD 179821 is dominated by the 43.0 micron crystalline water ice feature. However, the 40.5 micron feature is much stronger, rather red-shifted, and shows a very gentle slope on the blue side. The 43.8 enstatite feature produces some recognizable structure.
AFGL 4106: The 40.5 micron feature looks strong, but again this is partly due to the broad feature peaking around 35 m. As for HD 179821, the 40.5 micron feature has a gentle slope; a characteristic feature of outflow sources. The 43.8 micron feature is weak and almost completely overwhelmed by the 43.0 micron water ice feature.
NML Cyg: The general shape of the complex is quite similar to what has been found for other sources. The 40.5 micron feature is relatively strong with respect to the 43.0 + 43.8 micron blend. However this is seen in more sources, with HD 44179 as the most extreme case. The gas-phase rotational water lines, seen in emission, are most striking in this wavelength region (Justtanont et al. 1996b). The modeling of these lines is outside the scope of this paper. Besides gas phase water, crystalline water ice is also present, as evidenced by the presence of the 43.0 micron feature.
IRC+10420: The 40 micron complex suffers more from the noise than the other complexes. Still the main features can be distinguished. The 42.8 micron feature is difficult to disentangle, but there seems hardly any 43.6 micron feature.
4.7 The 60 micron complex
The 60 micron complexes of the disk sources and the outflow sources are plotted in figures 19 and 20.
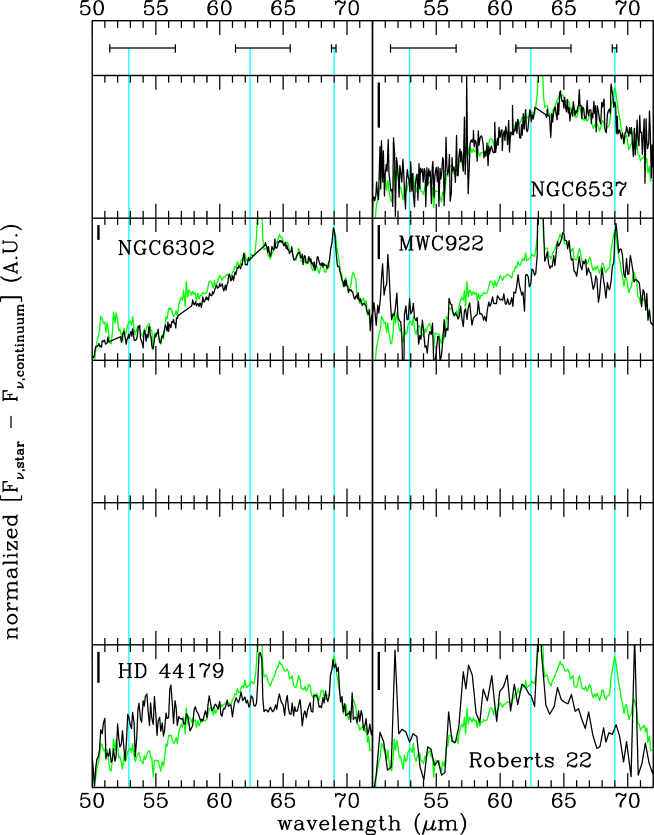
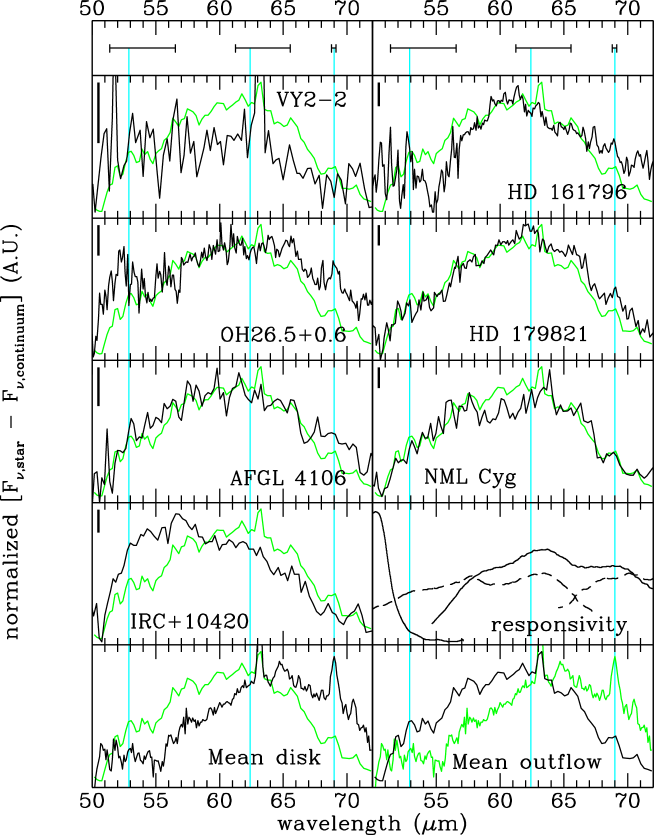
4.7.1 Disk Sources
NGC 6537: The 60 micron complex is rather smooth and peaks at about 65 m. The 69 micron forsterite feature is clearly present. The gentle rise at the blue side of this feature indicates that crystalline water ice is present, as was already indicated by the 43.0 micron feature in the 40 micron complex. Another dust component is necessary to explain the peak position and the red side of this feature, and diopside might be a good candidate for this (Koike et al. 2000). The forbidden emission lines were removed by hand, but in the original spectrum the following lines were found: [O III] at 51.79 m, [N III] at 57.31 m and [O I] at 63.16 m. It is interesting to note that all lines are blue shifted (in both scan directions). We probably see here the fast outflow from the star. Based on the shifts, the outflow velocity in our direction is km/sec. This is comparable to the velocity found by Cuesta et al. (1995). They came up with a model, based on [N II] profiles at 6584 Å, which predict a velocity of km/sec in the direction of the observer ( km/sec total outflow velocity).
NGC 6302: The 60 micron complex is very similar to the mean disk spectrum and lines up pretty well with those of NGC 6537 and MWC 922. Compared to MWC 922, NGC 6302 shows a little more intensity on the blue side, which probably indicates that there is a larger contribution from crystalline water ice as is expected from the 40 micron complex. The 69.0 micron forsterite feature is very prominent and quite narrow.
MWC 922: The 60 micron complex of MWC 922 peaks at very long wavelengths, implying that crystalline water ice does not play an important role at these wavelengths. This is in contrast with the 40 micron complex, where a band at 43.0 micron has been found. In Paper III we will show that the 40 micron complex of this source can nicely be fitted with only enstatite, confirming the absence of crystalline water ice.
The 69 micron feature is very prominent and seems broadened at its red side, which might be an indication for another dust component. The rather sharp 65 micron feature seems flanked by another feature at 66.5 m.
HD 44179: The 60 micron complex is rather flat and does not show much structure, apart from the prominent 69 micron feature and the [O I] line at 63.18 m. Because of this broad flat complex it is likely that there is only a small amount of crystalline water ice together with an extra dust component radiating at these wavelengths.
Roberts 22: While most disk sources do peak at a wavelength around 65 m, Roberts 22 seems to peak around 60 m. This is very much alike to the outflow sources and HD 161796 in particular. The 63.18 m [O I] line is also visible. In correspondence with the outflow sources, there is hardly any 69 micron feature.
4.7.2 Outflow Sources
Vy 2-2: The 60 micron complex is typical of an outflow spectrum. It peaks around 60-62 m and the 69 micron feature is absent.
HD 161796: The 60 micron spectrum is characterized by the crystalline water ice structure. It peaks at m, which is much bluer than the disk sources, but in better agreement with the expectation that there is crystalline water ice around this star. There is a hint of a 69 micron feature. We have measured it, but better data seem necessary for this feature.
OH 26.5+0.6: The 60 micron complex has 2 peaks, one at about 60 m, probably due to crystalline water ice, and one at 65 m, more like MWC 922. The 69 micron feature is clearly present, which is somewhat unexpected for an outflow source.
HD 179821: The 60 micron complex peaks at rather blue wavelengths, indicating the presence of a lot of crystalline water ice; as was already concluded from the 40 micron complex.
AFGL 4106: The 60 micron complex peaks around 60 micron. This is typical for sources which are dominated by crystalline water ice, and in agreement with the 40 micron complex spectrum.
NML Cyg: The 60 micron feature is very similar to the mean outflow spectrum, indicating that most of this feature is formed by emission from crystalline water ice.
IRC+10420: The 60 micron complex peaks at very short wavelength, indicating that there is crystalline water ice and a relatively low abundance of crystalline silicates, as was also found in the other complexes.
4.8 Remaining Bands
We chose not to show the individual remaining bands of our programme stars. However, in Paper II we show the average band profiles of the disk and outflow sources of the most prominent remaining bands, near 14, 21, 26, 48 and 90 m.
4.8.1 Disk Sources
IRAS09425-6040: The (instrumental) features around 14 m are weak or absent in IRAS09425-6040. The 20.7 and 21.5 micron features are clearly distinguishable in the spectrum. The 26.1 micron feature is also rather prominent. We unfortunately have no data for features at wavelengths longer than 45 m.
NGC 6537: As in IRAS09425-6040, the (instrumental) features around 14 m are weak or absent in NGC 6537. The 20.7 and 21.5 micron feature are present. The 26.1 micron feature is one of the reddest in our sample. The 47.7 and 48.6 micron features are separately identified. Finally there is clear evidence for the presence of a 91 micron feature, with the [O III] line at 88.35 m.
NGC 6302: NGC 6302 has very nice 20.7 and 21.5 micron features. The 26.1 micron feature is obscured by the presence of a strong emission line ([O IV]) and its presence cannot be confirmed at the moment. The 48 micron features is split up into its separate components, i.e. the 47.7 and 48.6 micron features. The 91 micron feature is present and even rather prominent.
MWC 922: The 3 (instrumental) features around 14 micron are all detected in this source. The 20.7 and 21.5 micron are clearly present and are only slightly less prominent than in IRAS09425-6040. The 26.1 micron feature is also rather prominently present.
AC Her: The 20.5 and 21.5 features are more blended than in other stars and the final result looks somewhat similar to the responsivity profile. This might point to a problem in the dark-current subtraction. However, there are some remarkable differences between the data and the responsivity at the edges of this structure and also the same kind of profile is found in the rev106 data. Therefore, we believe it is real.
HD 45677: The 3 features around 14 m, the 13.5, 13.8 and 14.2 micron features, are clearly present in the spectrum. The 20.7 and 21.5 micron feature are rather prominent and almost as strong as the 23 micron complex.
89 Her: The (instrumental) features around 14 m are all present, but the 20.7, 21.5 and 26.1 micron features are not detected.
MWC 300: The (responsivity) features around 14 m are all present in this source. This is one of the few sources where the 21.5 micron feature is not present, while the 20.7 micron feature is rather prominent. This is evidence that these two features are (at least partially) caused by different dust species. The 26.1 micron feature is present and rather prominent.
HD 44179: The 13.5 and 14.2 micron features are found, but might be due to carbon rich material that also peaks at these wavelengths (Hony et al. 2000). There is no indication of a 13.8 micron feature. There is a weak 26.1 micron feature present. In the LWS regime a 48 micron feature is found, but it could not be resolved into the two separate components. No 91 micron feature could be detected because the spectrum was unreliable at these wavelengths.
Roberts 22: Interestingly the 14.2 feature seems present but without the 13.6 feature. The 26.1 micron feature seems absent and there is also no indication for features around 48 m. The presence of the other feature are uncertain and will be discussed in the Appendix. There is some uncertainty over the presence of a 91 micron feature.
4.8.2 Outflow Sources
Vy 2-2: The features around 14 m and the 26.1 micron feature are not detected. Whether this is due to the noise level or that they really are absent is difficult to say. A comparison with other stars suggests the first possibility. While the 20.7 and 21.5 micron features are somewhat uncertain, they fit the average profile quite well. Nevertheless, the noise around these wavelengths makes them suspect.
HD 161796: The 21.5 micron feature is affected by the differences seen in the up and down scan. Comparison with the rev071 and other data suggests that the 21.5 micron feature is probably real, while other features in this wavelength region are probably not. The two features around 48 micron are found as a blend.
OH 26.5+0.6: Although all features are in absorption, the 3 features around 14 m appear in emission. This strengthens our suspicion that these features are instrumental. The 20.7 micron feature is thought to be in absorption, although it is rather blue-shifted with respect to the emission spectra from other sources. The 26.1 micron feature might have some self-absorption.
HD 179821: There are indications of a broad feature around 13 micron, which is also seen in HD 161796 and AFGL 4106. However, it is more likely that it is just continuum and that the 18 micron amorphous silicate feature already starts around 14.5 m. The 14 micron (responsivity) features were not found in this source. A 20.7 micron feature has been found, without a 21.5 micron feature. Also the 26.1 micron feature has been found. The 2 features around 48 m were nicely split and therefore measured separately.
AFGL 4106: There is a broad feature around 13 m which is also seen in HD 161796 and HD 179821. It is thought to be just continuum and probably induced by an early onset of the 18 micron amorphous silicate feature. On top of this broad structure, we see the (instrumental) features around 14 m. The 20.7 and 21.5 micron features are found as well as the 26.1 micron feature, which is rather broad. We also detect the 48 micron blend.
NML Cyg: The 13.6 and 14.2 micron features are blended with absorption features from HCN at 14.02 m and an unknown broad absorption at 13.25 m. These features are seen in all datasets. The 20.7 and 21.5 micron features were detected. The 48 micron blend has also been detected (and measured).
IRC+1042: The features around 14 m are all found. The 20.7 and 21.5 micron feature are also present, although the first one is the broadest one found in our sample. The 26.1 micron feature is weak but present. The 47.7 and 48.6 micron feature are also found, with the last one, in contrast to what has been found for other silicate features in this star, the most red-shifted found in our sample.
5 Discussion and conclusions
We have made an extensive study of the infrared spectra of O-rich environments of evolved stars. The spectra show a remarkably rich variety of features, most of which never seen before. We have defined seven complexes at 10, 18, 23, 28, 33, 40 and 60 m. Each of these complexes is a convolution of several contributions, which vary independently, giving each spectrum a unique appearance. We have derived average shapes for the complexes. The large sample enabled us also to identify weak structures. We have quantified the properties of the complexes and of the components that make up these complexes in terms of peak position, band strength and band width. We find that the band strength correlates with the geometry of the circumstellar environment, and have accordingly conducted a systematic separate inventory of the bands and complexes for disk sources and outflow sources. We have presented a detailed description of the shapes of the bands and complexes of the individual stars, and how the spectra of individual objects differ from the average complex shapes. In Paper II, we will discuss, compare and identify the average complexes.
The richness of the spectra undoubtedly contains important information related to the conditions in which the grains were formed and their thermal history. The crystalline nature of the carriers of most of the narrow bands (see also papers II and III) allows a detailed chemical analysis of these components, in a way which is unprecedented. In this way, it may become possible to trace the evolution and processing of grains from their place of birth (in the outflows of evolved stars), through the interstellar medium, into star forming regions and proto-planetary disks. For instance, Molster et al. (1999a) suggested that in the disk sources low temperature crystallization takes place. The crystallization of the silicates in outflow sources is likely to have taken place close to the star, i.e. high temperature crystallization. Therefore the difference found in the spectra and thus dust properties might have to do with the main crystallization process in these sources.
The data set presented in this study will serve as a starting point for more detailed investigations relating to the identification of the carriers of the bands, and for correlation studies. These will be presented in papers II and III. In Paper II we will discuss the average complexes and will identify the carriers of the bands using laboratory spectra of a variety of plausible components. In Paper III we will study the correlations between the wavelengths and strengths of the bands, and derive fits to the bands using simple radiative transfer and laboratory spectra.
Acknowledgements.
FJM wants to acknowledge the support from NWO under grant 781-71-052 and under
the Talent fellowship programm. LBFMW acknowledges financial support from an
NWO ‘Pionier’ grant.
References
- (1) Ageorges N., Eckart A., Monin J.-L. and Ménard F., 1997, A&A 326, 632
- (2) Alcolea J., Bujarrabal, 1985, A&A 303, L21
- (3) Allen D.A., Hyland A.R. and Caswell J.L., 1980, MNRAS 192, 505
- (4) Aller L.H., Ross J.E., O’Mara B.J. and Keyes C.D., 1981, MNRAS 197, 95
- (5) Arrelano Ferro A., 1984, PASP 96, 641
- (6) Ashley M.C.B. and Hyland A.R., 1988, ApJ 331, 532
- (7) Bachiller R., Gómea-González J., Bujarrabal V. and Martin-Pintado J., 1988, A&A 196, L5
- (8) Barlow M.J., 1998, A&SS, 255, 315
- (9) Beckwith S.V.W., Sargent A.I., Chini R.S., Guesten R., 1990, AJ 99, 924
- (10) Beintema D.A., 1998, A&SS, 255, 507
- (11) Bowers P.F., 1984, ApJ 279, 350
- (12) Bowers P.F., Johnston K.J. and Spencer J.H., 1983, ApJ 274, 733
- (13) Bowey J.E., Lee C., Tucker C. et al., 2000, in proceedings of ISO beyond the peaks: The 2nd ISO workshop on analytical spectroscopy, eds. A. Salama, M.F.Kessler, K. Leech & B. Schulz, ESA-SP 456, 339
- (14) Bujarrabal V., Alcolea J. and Planesas P., 1992, A&A 257,701
- (15) Casassus S.P., Roche P.F. and Barlow M.J., 2000, submitted to MNRAS
- (16) Clegg P.E., Ade P.A.R., Armand C., et al., 1996, A&A 315, L38
- (17) Cohen M., Anderson C.M., Cowley A., et al., 1975, ApJ 196, 179
- (18) Cohen M., Tielens A.G.G.M., Bregman J. et al., 1989, ApJ 341, 246
- (19) Cohen M., Barlow M.J., Sylvester R.J. et al., 1999, ApJ 513, L135
- (20) Cuesta L., Phillips J.P. and Mampaso A., 1995, A&A 304, 475
- (21) Dorschner J., Begemann B., Henning Th. et al., 1995, A&A 300, 503
- (22) Fix J.D. and Cobb M.L., 1988, ApJ 329, 290
- (23) de Graauw Th., Haser L.N., Beintema D.A. et al., 1996, A&A 315, L49
- (24) Hamann F. and Persson S.E., 1989, ApJS 71, 931
- (25) Hawkins G.W., Skinner C.J., Meixner M.M. et al., 1995, ApJ 452, 314
- (26) Henning Th., Launhardt R., Steinacker J. et al., 1994, A&A 291, 546
- (27) Hony S., Van Kerckhoven C., Peeters E., et al., 2000 in proceedings of ISO beyond the peaks: The 2nd ISO workshop on analytical spectroscopy, eds. A. Salama, M.F.Kessler, K. Leech & B. Schulz, ESA-SP 456, 63
- (28) Humphreys R.M., Strecker D.W., Murdock T.L. and Low F.J., 1973, ApJ 179, L53
- (29) Jewell P.R., Schenewerk M.S., Snyder L.E., 1985, ApJ 295, 183
- (30) Jones T.J., Humphreys R.M., Gehrz R.D. et al., 1993, ApJ 411, 323
- (31) Jura M., Balm S.P., Kahane C., 1995, ApJ 453, 721
- (32) Jura M., Turner J. and Balm S.P., 1997, ApJ 474, 741
- (33) Jura M. and Turner J., 1998, Nature 395, 144 (1998)
- (34) Jura M. and Werner M.W., 1999, ApJ 525, L113
- (35) Jura M., Chen C., Werner M.W., 2000, ApJ 541, 264
- (36) Justtanont K., Skinner C.J. and Tielens A.G.G.M., 1994, ApJ 435, 852
- (37) Justtanont K., Skinner C.J., Tielens A.G.G.M. et al., 1996a, ApJ 456, 337
- (38) Justtanont K., de Jong T., Helmich F.P. et al.,1996b, A&A 315, L217
- (39) Kastner J.H. and Weintraub D.A., 1995, ApJ 452, 833
- (40) Kessler M.F., Steinz J.A., Anderegg M.E. et al., 1996, A&A 315, L27
- (41) Knapp G.R., Phillips T.G., Leighton R.B. et al., 1982, ApJ 252, 616
- (42) Koike C., Tsuchiyama A., Shibai H. et al., 2000, A&A 363, 1115
- (43) Lamers H.G.J.L.M., Zickgraf F-J., de Winter D. et al, 1998, A&A 340, 117
- (44) Leinert C., Richichi A. and Haas M., 1997, A&A 318, 472
- (45) Lester D.F. and Dinerstein H.L., 1984, ApJ 281, L67
- (46) Lewis B.M., Terzian Y. and Eder J., 1986, ApJ 302, L23
- (47) Likkel L., Forveille T., Omont A., and Morris M., 1991, A&A 246, 153
- (48) Luck R.E., Bond H.E. and Lambert D.L., 1990, ApJ 357, 188
- (49) Malfait K., 1999, PHD thesis, Katholieke Universiteit Leuven
- (50) Meaburn J. and Walsh J.R., 1980, MNRAS 191, 5P
- (51) Meixner M., Ueta T., Dayal A. et al, 1999, ApJS 122, 221
- (52) Molster F.J., Waters L.B.F.M., de Jong T. et al, 1997, in “Planetary nebulae”, Proc. IAU180, Habing H.J. and Lamers H.J.G.L.M. Lamers (eds), Kluwer, Dordrecht, p 361
- (53) Molster F.J., Yamamura I., Waters L.B.F.M. et al., 1999a, Nature 401, 563
- (54) Molster F.J., Waters L.B.F.M., Trams N. et al., 1999b A&A 350, 163
- (55) Molster F.J., Yamamura I., Waters L.B.F.M. et al., 2001a, A&A 366, 923
- (56) Molster F.J., Lim T.L., Sylvester R.J. et al., 2001b A&A 372, 165
- (57) Molster F.J., Waters L.B.F.M., Tielens A.G.G.M., 2002a accepeted by A&A (Paper II)
- (58) Molster F.J., Waters L.B.F.M., Tielens A.G.G.M. et al., 2002b, accepted A&A (Paper III)
- (59) Monnier J.D., Bester M., Danchi W.C. et al., 1997, ApJ 481, 420
- (60) Morris M. and Jura M., 1983, ApJ 267, 179
- (61) Nedoluha G.E. and Bowers P.F., 1992, ApJ 392, 249
- (62) Netzer N. and Knapp G.R., 1987, ApJ 323, 734
- (63) Osterbart R., Langer N. and Weigelt G., 1997, A&A 325, 609
- (64) Oudmaijer R.D., 1998, A&AS 129, 541
- (65) Oudmaijer R.D., Geballe T.R., Waters L.B.F.M. and Sahu K.C., 1994, A&A 281, L33
- (66) Payne H.E., Phillips J.A. and Terzian Y., 1988, ApJ 326, 368
- (67) Pérez M.R., Grady C.A., van den Ancker M.E. et al., 1993, in “Frontiers of Space and Ground-Based Astronomy, The Astrophysics of the 21st Century”, Longair M.S., Kondo Y. and Wamstekker W. (eds.), Kluwer, Dordrecht, The Netherlands, p563
- (68) Pirzkal N., Spillar E.J., and Dyck H.M., 1997, ApJ 481, 392
- (69) Richards A.M.S., Yates J.A. and Cohen R.J., 1996, MNRAS 282, 665
- (70) Roche P.F. and Aitken D.K., 1984, MNRAS 208, 481
- (71) Roche P.F. and Aitken D.K., 1986, MNRAS 221, 63
- (72) Roddier F., Roddier C., Graves J.E. and Northcott M.J., 1995, ApJ 443, 249
- (73) Rodriguez L.F., Garcia-Baretto J.A., Canto J. et al, 1985, MNRAS 215, 353
- (74) Sahai R. and Trauger J.T., 1998 AJ 116, 1357
- (75) Sahai R., Zijlstra A., Bujarrabal V. and te Lintel Hekkert P., 1999, AJ 117, 1408
- (76) Sandford S.A., Pendleton Y.J., Allamandola L.J., 1995, ApJ 440, 697
- (77) Schaeidt S.G., Morris P.W., Salama A. et al, 1996, A&A 315, L55
- (78) Schulte-Ladbeck R.E., Shepherd D.S., Nordsieck K.H. et al., 1992, ApJ 401, L105
- (79) Seaquist E.R. and Davis L.E., 1983, ApJ 274, 659
- (80) Simon T. and Dyck H.M., 1977, AJ 82, 725
- (81) Skinner C.J., Meixner M.M., Hawkins G.W. et al., 1994, ApJ 423, L135
- (82) Skinner S.L., Brown A., Stewart R.T., 1993, ApJS 87, 217
- (83) Swinyard B.M., Clegg P.E., Ade P.A.R. et al., 1996, A&A 315, L43
- (84) Sylvester R.J., Barlow M.J., Liu X.W., et al., 1997, MNRAS 291, L42
- (85) Sylvester R.J., Kemper F., Barlow M.J. et al., 1999, A&A 352, 587
- (86) Thé P.S., de Winter D., Pérez M.R., 1994, A&AS 104, 315
- (87) Valentijn E.A., Feuchtgruber H., Kester D.J.M. et al., 1996, A&A 315, L60
- (88) Van Kerckhoven C., Hony S., Peeters E., et al., 2000, A&A 357, 1013
- (89) Van Winckel H., Waelkens C., Waters L.B.F.M. et al, 1998, A&A 336, L17
- (90) van der Veen W.E.C.J., Waters L.B.F.M., Trams N.R. and Matthews H.E., 1994, A&A 285, 551
- (91) Voors R.H.M., 1999, PHD thesis, University of Utrecht
- (92) Waelkens C., Van Winckel H., Waters L.B.F.M. and Bakker E.J., 1996, A&A 314, L17
- (93) Waters L.B.F.M., Waelkens C., Mayor M. and Trams N.R., 1993, A&A 269, 242
- (94) Waters L.B.F.M., Molster F.J., de Jong T. et al., 1996, A&A 315, L361
- (95) Waters L.B.F.M., Waelkens C., Van Winckel H. et al., 1998, Nature 391, 868
- (96) Winckler H. and Wolf B., 1989, A&A 219, 151
- (97) de Winter D. and van den Ancker M.E., 1997, A&AS 121, 275
- (98) Wolf B., Stahl O., 1985, A&A 148, 412
- (99) Zsoldos E., 1993, A&A 268, 149
- (100) Zuckermann B. and Dyck H.M., 1986, ApJ 311, 345
6 Appendix; Notes on individual stars
6.0.1 IRAS09425-6040
We have 2 SWS AOT01 observations for this star, and unfortunately no LWS data. We have slightly tilted band 2A so that the different subbands were nicely connected with each other.
There is C2H2 absorption at 7.8 m, also HCN absorbs around these wavelengths. The change in slope around 10.64 m suggests the presence of a 10.7 micron feature. However, no other features are found, which makes it somewhat doubtful. The 11.3 SiC feature prevents the detection of the 11.4 micron feature associated with forsterite. But, because of the absence of structure at shorter wavelengths, it is likely not present.
Because of the noise level, the 15.3, 15.9 and 16.2 micron features are measured as one, but they seem all present in this star. There are indications in the spectrum that there is a 17.5 micron feature, but this feature has not been measured separately. There might be an underlying amorphous silicate feature, but it has not been measured. The 24.0, 28.8 and 34.1 micron features might be present but have not been measured separately. There is a hint of the 31.2 micron feature in the rev084 data. However, this cannot be confirmed on the basis of the rev254 data because of the noise level in this area.
6.0.2 NGC 6537= HD 312582= Hen 2-340= IRAS18021-1950
For NGC 6537 we have 2 SWS and 2 LWS spectra. Unfortunately, the second SWS spectrum was mispointed and could hardly be used, even to check uncertain features in an independent dataset.
The origin of the sharp feature at 18.88 m is unknown. A rise in the spectrum is found in both the up and the down scan. A similar feature is seen in AC Her, but only in one of the two datasets. No other stars show this feature, including NGC 6302, which is almost a twin to this source. Therefore, we still have some doubts about this feature. Independent of the status of this feature, it influenced our measurement of the broad 18.9 micron feature underneath. The 24.5 micron feature is severely influenced by the [Ne V] emission line. The 27.6 and 28.2 micron features are measured as one.
6.0.3 NGC 6302= Butterfly Nebula= HD 155520= Hen 2-204= IRAS17103-3702= CD-36∘11341
Since NGC 6302 was one of the calibration sources, a lot of data was available. We had an AOT01 and a complete wavelength coverage in AOT06, together with 7 LWS datasets. The SWS pointings were slightly offset from the centre. Therefore, we multiplied the whole SWS spectrum to fit the LWS spectrum. The final spectrum is in agreement with the IRAS broad band fluxes.
The 13.6 and 14.2 micron features seem to be present in the AOT01 dataset, while in the AOT06 dataset only the 14.2 seem to be present. However, strong atomic lines at these wavelengths make a clear detection of these features impossible. The spectrum of NGC 6302 shows features at 15.3 and 15.8 m. However, the strong [Ne III] line in between these features influences them. The difference in the up and down scans also made this a problematic area. The feature at 16.3 m feature is only seen in band 3C of the AOT01 speed 4 dataset, and not in band 3A of the same dataset. These last 3 features are also not visible in the AOT06 spectrum, therefore we decided not to include them. The sharp feature at 19.1 m is found in both the up and down scans. Also the AOT06 spectrum shows evidence for a narrow feature at that wavelength. The source of this feature is unknown. It seems too narrow for a dust feature. We cannot exclude a forbidden emission line, although it is quite broad with respect to the other lines in this wavelength region and we don’t have a clear identification yet. The 24.5 micron feature is difficult to measure since there is another [Ne V] line close to it. Also for the 26.1 micron feature we face the problem of a rather strong line on top of it ([O IV]), which prevents us from getting a reasonable estimate for this feature. If the 40.5 micron feature is a blend of 2 features, as is suggested in paper II, these two features nicely blend into one structure peaking at 40.5 m.
6.0.4 MWC 922= Hen 3-1680= AFGL2132= IRAS18184-1302
The SWS spectrum of MWC 922 is derived from a combination of 2 AOT01 speed 2 observations. Features were treated as real if they were seen in both observations.
The 9.1 and 9.5 micron absorption features seem to form a blend, this might be caused by a known instrumental feature at about 9.35 m. The 9.8 micron feature is very clear and seen in both datasets (up and down scan), the same holds for the 10.6 micron feature. The 11.3 micron feature, if present, is completely overwhelmed by the 11.3 micron PAH feature.
As discussed in the text, the 18 micron complex might suffer from interstellar absorption. It was impossible to disentangle the circumstellar amorphous silicate feature from the interstellar absorption and the circumstellar crystalline silicate emission and therefore it has not been measured. The (interstellar) absorption by amorphous silicates prevents us from measuring the features around 16 m. Based on a comparison with other stars, these features seem to be present, but there remains uncertainty about their strength and FWHM. The 18.0, 18.9 and 19.5 micron features are clearly present. The small structure (3 features) on top of the 18.1 micron feature is located at the same position as in HD 44179. The presence of a weak feature at 17.43 m is uncertain, since the two datasets do not fully agree around this wavelength. The feature at 33.5 m is the [S III] line. No separate 36.0 micron feature can be distinguished in the plateau. The 47.7 and 48.6 micron features were difficult to disentangle and therefore measured as one. The [O I] line is visible at 63.18 m. There is a small extension at the long wavelength side of the 69.0 micron feature. It might be caused by an unknown dust component, or by a population of relatively warm forsterite grains, which will emit at a slightly longer wavelength (Bowey et al. 2000).
6.0.5 AC Her= HD 170756= SAO 86134= IRAS18281+2149
For AC Her, we have two SWS and one LWS datasets. No special treatments were necessary during data reduction.
The feature at 18.85 micron is only seen in the rev520 dataset and not in the rev106 data. Although a similar feature has been found in NGC 6537, it makes this feature questionable. There is a hint in the spectrum of the 22.4 micron feature and we have measured it, but the reader should be aware of the noise level in this part of the spectrum. The strong feature at 22.69 m looks rather prominent and seems also to be present in HD 44179, where this feature is seen in both the AOT01 as well as the AOT06 data. However, there is no indication of this feature in the rev106 spectrum of AC Her. It should be noted that the responsivity drops around that wavelength. It is clear that this feature should be treated with caution. The reality of the sharp peak around 31.0 m is questionable. This noise peak sits probably on top of a genuine 31.2 micron feature, which seems also present in the rev106 spectrum. The shape of the underlying 31.2 micron feature corresponds rather well with the mean shape of the 31.2 micron feature. The prominent feature at 32.61 m is present in both the up and down scans of rev520 (although much more prominent in the up scan). However, nothing is seen in the rev106 dataset and we have some doubt about its reality. Nevertheless, it should be noted that its wavelength position is not atypical for a 32.8 micron feature. The 33.7 and 34.1 micron features are measured together. In the rev520 dataset, there is an indication of the presence of a 35.9 micron feature and the absence of the 34.9 micron feature. However, it seems vice versa for the rev106 data, where a 34.9 micron feature seems present but hardly anything at 35.9 m. It is clear that the noise level in both datasets play tricks on us here. We interpret this as evidence for the presence of the 35 micron plateau although it is not clear where this plateau ends.
6.0.6 HD 45677= FS CMa= MWC 142= SAO 151534= AFGL 5195= IRAS06259-1301
For HD 45677 we only had one SWS dataset and unfortunately no LWS data. Band 2 B has been rotated to let all the bands nicely match.
In general, the features of HD 45677 are rather sharp compared to the other stars. The 34.1 and 34.9 micron features are both present but blend in this object and are therefore measured as one. The same applies for the 35.9 and 36.5 micron features. The sharp line at 34.81 m is due to [Si II].
6.0.7 89 Her= V441 Her= BD+26∘3120= HD 163506= IRAS17534+2603= AFGL 2028= SAO 85545
For 89 Her, we also have redundancy in the SWS domain with two datasets. For the LWS wavelength range, we have only one dataset. To match the different bands with each other, we are forced to slightly tilt band 2B.
There is uncertainty about the 15.2 micron feature. The structure seen at these wavelengths seems real, because it is found in both the rev082 and the rev518 data. However, it is rather blue-shifted and also very broad. Therefore, the question arises whether the feature found at 15.0 m in this object is the same as the 15.2 micron feature.
We have fitted the smooth 23 micron complex with 3 features but these were not well constrained. Therefore caution should be taken in interpreting the results of this complex, even though the errors might look small.
The 31.2 micron feature is not detected. The structure that is seen around this wavelength is noise.
6.0.8 MWC 300= V431 Sct= AFGL 2170= IRAS18267-0606
For MWC 300 we unfortunately have only one SWS spectrum and no long wavelength data. The substructure found in the 10 micron complex, which might be attributed to crystalline silicates, is always seen in only one scan and we therefore do not trust its appearance. We have therefore not measured them. There might be structure around 16 m, but this is severely blended by interstellar silicate absorption and has therefore not been measured. The amorphous silicate feature detected at 17.03 m is probably due to interstellar absorption and not a circumstellar amorphous silicate emission feature, which has therefore not been measured. The up and down scans differ for the sharp peak at 28.68 m; in one it is present, but in the other it is not. But the drop around 28.9 m is seen in both the up and down scan, confirming the presence of the 28.8 micron feature. There is an indication of the 32.2 micron feature but at a very low level. Therefore it has not been measured. The up and down scans do not correspond at 42.5 micron. Therefore, we have removed this feature before measuring the 40 micron complex. The shallow slope of the blue side of the 40.5 micron feature suggests the presence of a 39.8 micron feature. The presence of the 44.7 micron feature can neither be proven nor rejected.
6.0.9 HD 44179= Red Rectangle= BD-10∘1476= IRAS06176-1036= AFGL 915= SAO 151362
For this source we have an AOT01 spectrum and some parts done with a higher resolution (AOT06). Also an LWS spectrum is available.
The feature at 17.07 m is likely to be a blend of the 16.7 and 17.0 micron features. The reality of the 20.7 micron feature is uncertain since it is very broad in the AOT01 spectrum (although seen in both the up and down scans), but nothing is seen in the AOT06 spectrum. Therefore, caution should be taken in interpreting this feature in this star. The structure around 23.2 m is not found in all datasets and differs between the up and the down scans. Therefore, we masked this part before measuring the complex. Comparing the 28 micron complex with 89 Her suggests that the 26.8 micron feature is also present on the blue side of the 27.6 micron feature.
6.0.10 Roberts 22= Hen 3-404= Wray 15-549= AFGL 4104= OH284.18-0.79= IRAS10197-5750
When ISO observed Roberts 22 with the SWS it was offset, and a lot of flux was missed. Increasing apertures gave also flux jumps between the different subbands. In total, we have 2 SWS and 1 LWS spectrum for this source.
We have measured the 18 micron amorphous silicate band. However, it is likely that the 18.0, 18.9 and 19.5 micron features are present and are therefore included in this measurement, but the noise level prevents firm conclusions about their presence. The 15.9 and 16.2 micron features are measured together. The 23 micron complex has been measured as one feature, since it was too noisy to separate the different features. The 28 micron complex suffers from flux jumps between the different bands. Therefore, there is some uncertainty about the continuum in band 3E. Still, we were able to measure the features in this band since we used a local continuum for these measurements. However their relative strength is questionable. All 3 features found in band 3E were seen in both the rev084 as well as the rev254 datasets. Before measuring the 33 micron complex, we masked the narrow (0.1 m) peak at 33.3 m, since it was only found in one scan direction and not in the rev084 data. The 35.9 + 36.5 micron features were measured as one, alike to the 39.8 + 40.5 micron features. The 20.7 and 21.5 micron features are found in rev254, where their shape resembles the average shape of these features quite well. However, because nothing is found in the rev084 dataset, and because of the low S/N in this part of the spectrum, these features are suspect. There is some concern about the data beyond 80 m. Therefore, the detection of the 90 micron feature in Roberts 22 is uncertain.
6.0.11 Vy 2-2= IRAS19219+0947
Vy 2-2 is the other source on which ISO was not centered correctly. This resulted in flux jumps and intensity losses. We had one SWS and one LWS spectrum. The whole SWS spectrum suffered from the mispointing of the satellite. This reduced the flux level and therefore the signal to noise ratio.
The reality of the feature at 11.6 m is severely doubted, since the up and down scans do not agree with each other. It is therefore a good indicator of the noise-level in that part of the spectrum. The amorphous silicate features, clearly present in the 10 micron complex, could not be detected at the 18 micron complex, likely due to the noise level.
The feature at 25.1 m is too broad to be a forbidden emission line. However it also seems narrower than the normal 25.0 micron feature. The noise in this part of the spectrum is quite severe, therefore we have some doubts about this feature. If other data confirm this to be the 25.0 micron feature, it would be the strongest 25.0 micron feature in the sample. The overall intensity from 24.2 to 25.2 m suggests that the plateau is present and this has been measured (excluding the uncertain strong peak at 25.1 m).
There were a lot of spurious features in band 4, which were removed by hand during the data reduction. There are hints in both the up and down scans for the different features in the 35 micron plateau, therefore we have measured them. However, the signal to noise ratio in this region makes these features somewhat uncertain and therefore no firm conclusions should be drawn based on these features alone. Also the 40 micron complex suffers from the high noise level. The features seen in the spectrum provided by the ISO-data archive in Vilspa are probably due to glitches and glitch tails, which were found in this part of the spectrum. We have removed these spurious points by hand. We have tried to split the 40 micron complex into a 40.5 micron feature and a 43.0 + 43.8 micron blend and measured the result.
6.0.12 HD 161796 = V814 Her= BD+50∘2457= IRAS17436+5003= AFGL 5384= SAO 30548
We got a nice dataset for HD 161796, including an AOT06 observation of band 4. In the final spectrum we attached this AOT06 spectrum between 29.03 and 43.17 m.
A broad feature around 13 micron may be present, which is also seen in AFGL 4106 and HD 179821, however in the latter spectra it resembles continuum with an early rise of the 18 micron silicate feature, starting at about 14.5 m. The 18 micron complex is located on the slope of a steep spectrum and there is some uncertainty about the strength of the 18 micron feature. The up and down scans do not completely agree around this feature. Still the peak position and FWHM agree very well with the feature seen in the mean outflow spectrum. So we conclude that it is likely that there is a feature at this wavelength, but its strength is somewhat controversial. Because of the presence of the crystalline silicate features, it is more difficult to measure the amorphous silicates. This dust feature also hampers from our method of measurement. We fitted Gaussians while this feature is not a Gaussian. The small feature which is seen at 17.5 m is noise. The shape of the 20.5 micron feature is similar to the shape in the mean spectrum, however its strength is similar to the features at 22.0 and 22.4 m, for which the up and down scans differ significantly. Therefore, the detection of the 20.5 micron feature is only marginal. Because of the reasonable uncertainty about the 22.4 micron feature, it has not been measured. The 28.8 micron feature might be present but one should take into account that we only measured it after masking the spurious feature at 29.2 m. It should be noted that the 30.6 micron feature is found in the AOT06 data and in the rev342 data but nothing is seen in the rev071 dataset. The spectrum between 29.03 and 43.17 m is from the AOT06 observation. The 35.9 and 36.5 micron features have been measured as a blend. The 35.1 micron feature is probably somewhat underestimated and blue-shifted. The status of the feature at 44.09 m is not completely sorted out. It is seen in all data sets, but the up and down scans do often differ at this point. For now, we assume that it is the result of a blend of the 43.8 and the 44.7 micron features.
6.0.13 OH 26.5+0.6= V347 Sct= IRAS18348-0526= AFGL 2205
For OH 26.5+0.6 we got 2 LWS and one SWS dataset.
Up to 28 m all features are in absorption. The amorphous 10 micron feature suffers from a high degree of absorption and no Gaussian profile is fitted to it, the centre of the absorption is at m. The substructure in the 10 micron absorption band might be real, it is seen in both the up and down scans, but the positions do not match with other sources in our sample. The 23.0 and 23.7 micron features are measured as a blend. It is not completely clear whether the 27.6 and 28.2 micron features are present or not. They are located at the border where the spectrum goes from absorption to emission. It seems that there is some excess emission at these wavelengths, but no clear peak has been seen. This suggest that they suffer from self absorption, which makes it impossible to measure them with Gaussians. So we have not measured these features, although they seem to be present. The 33 micron complex without the plateau has been measured as one feature, since it was not possible to make sure how to separate the different features, for which are indications for their presence. Although there is an indication of 2 different features in the 60 micron complex of OH 26.5+0.6 we have measured it as one. There seems to be self-absorption in the 26.1 micron feature, which hampers the measurements of this feature. The 48 micron blend has again been measured as one due to the noise level in that part of the spectrum.
6.0.14 HD 179821 = V1427 Aql= BD-00∘3679= IRAS19114+0002= AFGL 2343= SAO 124414
Our data products of HD 179821 consist of two SWS and one LWS spectrum.
The 18 micron complex lies on a very steep slope, which makes it difficult to identify and measure the different features. The 18 micron amorphous silicate feature might be about 10% too strong since it has been measured including the crystalline silicate features. The 15.9 and 16.2 micron features were measured together, since it appeared very difficult to separate them. The 17.0 micron feature is very weak, but its width corresponds well with the mean feature shape. The detection of the 18.9 micron feature is uncertain, it has therefore been measured together with the 18.0 micron feature. The 24.5 and 25.1 micron features have been measured as one. The 40.5 micron feature shows a relatively shallow slope towards the shorter wavelengths, this is fitted with an extra Gaussian, which is attributed to the 39.8 micron features. This extra Gaussian influences the strength and probably also the derived width of the 40.5 micron feature. The sharp drop around 67 m might have to do with the border between two different bands in the LWS spectrum. We remind the reader that we have not performed any shift of the sub-bands for this LWS spectrum.
6.0.15 AFGL 4106= HD 302821= CPD-58∘2154= IRAS10215-5916
There are three SWS datasets for AFGL 4106 and one LWS dataset. We had to rotate band 3E to match band 3D and 4.
The 18 micron amorphous silicate feature might be about 10% - 20% too strong, since it has been measured including the crystalline silicate features. Again some features have been measured as a blend, such as the 15.9 + 16.2 micron features, the 16.7 + 17.0 micron features and the 47.7 + 48.6 micron blend. There are slight indications of a 22.4 micron feature, however we decided not to measure it because of the noise level, which makes this feature rather uncertain.
6.0.16 NML Cyg= V1489 Cyg= IRC+40448= OH80.8-1.9= AFGL 2650
For NML Cyg there was a nice dataset available, with 4 SWS, of which one was an AOT06 observation of band 4, and 3 LWS observations. We have included this high resolution spectrum in our final spectrum. Band 2A has been tilted to fit the other bands.
The 8.3 micron feature might be present, but is difficult to separate from the amorphous silicate feature which still peaks at these wavelengths. The structure around 10.07 m coincides with a feature in the responsivity and is therefore not trusted. The structures around 11.05 m are due to the apparently not completely correctly removed 11.1 micron responsivity feature.
The 13.6 and 14.2 micron features are influenced by molecular absorption features at 13.25 and 14.02 m.
We assumed that there was no 13.8 micron feature and that therefore the flux at that wavelength was continuum. The features were measured with respect to that continuum.
The 16.9 and 17.2 micron features are measured as one. If there is a very weak 19.5 micron feature it has been measured together with the 18.9 micron feature. At 14.96 m gas phase CO2 absorption has been detected.
The 18 micron amorphous silicate could not be extracted from the data, it is probably between emission and self absorption. The 24.5 micron feature is rather blue-shifted and strong compared to the other 24.5 micron features. It gives NML Cyg the broadest appearance for this complex of all sources. We cannot exclude that this feature is not the same as the other 24.5 micron features.
The end of band 3D and the beginning of Band 3E are not OK due to leakage, therefore no features are measured in this wavelength range There might be a 39.8 micron feature present, however this is difficult to measure with so many water lines present in that region. Therefore we measured it as one feature, neglecting the presence of the water lines. This might lead to an overestimation of the flux level of the features.
The 47.7 and 48.6 micron features were measured as a blend.
6.0.17 IRC+10420= V1302 Aql= IRAS19244+1115= AFGL 2390
The last source in our sample is IRC+10420. We got complete spectral coverage in the SWS and LWS wavelength range. Part of the SWS-spectrum was done with an AOT06 which is included in our final spectrum. The infrared spectrum of IRC+10420 shows some structure in the 10 micron complex which lines up quite nicely with crystalline silicates in other sources. The weak 10.6 micron feature is uncertain, since it is not consistent with the feature seen in the mean disk spectrum feature. The 11.3 micron feature is consistent with a feature seen in AC Her but very weak.
The 16.2 micron feature is somewhat unsure, since it is clearly seen in band 3c (up and down scan), but not in band 3A (neither in the up nor in the down scan). The amorphous feature has been measured without the crystalline features and the strength is therefore somewhat overestimated, however this effect is negligible compared to the uncertainty in continuum level. The 18.0 + 18.9 micron features are measured as one.
Band 3D was not corrected for leakage problems in the calibration sources, because the flux level in IRC+10420 is so high that it is very likely that also here leakage has its influence. Band 3E is tilted to fit the AOT06 and LWS on one side and the rest of the data at the other side. The 20.7 micron feature is the broadest one found in our sample, still the data seem valid, since the up and down scans show exactly the same trend.
The up and down scans of the AOT06 spectrum differ severely between 29.3 and 30 m, probably due to memory effects for this high flux source. Therefore we have removed this part of the spectrum, since also the AOT01 suffered from the same problems in this part of the spectrum.
There is a possibility of a 39.8 micron feature however the different datasets contradict each other around these wavelengths. Therefore we have measured this feature as a 40.5 micron feature.