Nova Cygni 2001/2 = V2275 Cyg††thanks: Based on the data obtained at the David Dunlap Observatory, University of Toronto
We present an analysis of low- and medium resolution spectra of the very fast nova, Nova Cygni 2001/2 (V2275 Cyg) obtained at nine epochs in August, September and October, 2001. The expansion velocity from hydrogen Balmer lines is found to be 2100 km s-1, although early H profile showed a weak feature at 3500 km s-1, too. The overall appearance of the optical spectrum is dominated by broad lines of H, He and N, therefore, the star belongs to the “He/N” subclass of novae defined by Williams (1992). Interstellar lines and bands, as well as photometry taken from the literature yielded to a fairly high reddening of . The visual light curve was used to deduce MV by the maximum magnitude versus rate of decline relationship. The resulting parameters are: , days, days, M. Adopting these parameters, the star lies between 3 kpc and 8 kpc from the Sun.
Key Words.:
stars: novae, cataclysmic variables – stars: individual: V2275 Cyg1 Introduction
Nova Cygni 2001/2 was discovered by A. Tago on two T-Max 400 films taken on Aug. 18 at 88 apparent brightness. One day before discovery, nothing was visible at the nova location down to 12 mag (Nakamura et al. 2001). The spectroscopic confirmation was given by subsequent optical spectroscopy revealing hydrogen Balmer emission lines with deep P Cygni profiles. The H line profile suggested an early expansion velocity of 1700 km s-1 (Ayani 2001). The nova was also discovered independently by K. Hatayama (Nakano et al. 2001). A possible progenitor with USNO red magnitude 188 and blue mag magnitude 196 was identified by P. Schmeer (Schmeer et al. 2001).
Early photometric data consist of photographic and CCD photometric data published in the IAU Circulars. The full light curve can be reconstructed using visual data collected by the VSNET group111http://www.kusastro.kyoto-u.ac.jp/vsnet. The visual maximum occured at 68 on 2001 Aug. 19.9 UT. Simultaneous color measurements were published by Sostero & Leopardo (in Nakano et al. 2001), who gave =11 in the maximum, suggesting substantial reddening. The color remained around during the first week after the maximum, when the apparent brightness decreased down to 92 (Samus et al. 2001).
The main aim of this paper is to present optical and far red spectra taken after the maximum, between t = +2.3 d to t = +59.1 d. The low- and medium resolution spectra were used to determine the main outburst properties, the expansion velocity and the interstellar reddening. We also make use of all publicly available visual photometric data collected by the VSNET group to estime the rates of decline and to check the photometric phases of the obtained spectra.
2 Observations
The spectroscopic observations were carried out with the Cassegrain-spectrograph attached to the 1.88-m telescope of the David Dunlap Observatory (Richmond Hill, Canada). The spectra were obtained on nine nights between August and October, 2001. The detector was a Thomson 10241024 CCD chip (with a 6 e- readout noise). The slit width was 303 corresponding to 18 on the sky. As the typical observing circumstances at DDO are non-photometric, we did not attempt to flux calibrate the data. All spectra presented throughout the paper were continuum normalized, with few exceptions where the normalization was impossible due to the short wavelength span. Further observational details (the gratings, wavelength range, photometric phase) are given in Table 1. The same instrument and setup was used earlier for spectroscopic investigation of two recent novae (V1494 Aql - Kiss & Thomson 2000; CI Aql - Kiss et al. 2001).
| Date | MJD | grating | range | ||
|---|---|---|---|---|---|
| 2001 | ln/mm | (Å) | (d) | ||
| Aug. 22 | 143.70 | 831 | 6300–6800 | 6000 | +2.3 |
| 143.74 | 600 | 3900–4500 | 7000 | +2.3 | |
| Sep. 5 | 157.85 | 100 | 4200–7900 | 1400 | +16.5 |
| 157.87 | 1800 | 5800–6000 | 9800 | +16.5 | |
| Sep. 7 | 159.57 | 1800 | 6500–6700 | 11000 | +18.2 |
| Sep. 9 | 161.64 | 1800 | 6500–6700 | 11000 | +20.2 |
| Sep. 10 | 162.53 | 600 | 8350–8950 | 11000 | +21.1 |
| Sep. 12 | 164.57 | 831 | 6400–6900 | 6000 | +23.2 |
| Oct. 8 | 191.56 | 100 | 4300–8000 | 1400 | +50.2 |
| 191.66 | 831 | 6300–6800 | 6000 | +50.3 | |
| 191.72 | 1800 | 6450–6650 | 11000 | +50.3 | |
| Oct. 15 | 198.53 | 1800 | 6450–6650 | 11000 | +57.1 |
| Oct. 17 | 200.53 | 1800 | 6450–6650 | 11000 | +59.1 |
The spectra were reduced with standard IRAF tasks, including bias removal, flat-fielding, aperture extraction (with the task doslit) and wavelength calibration. For the latter, FeAr, ThAr and FeNe spectral lamp exposures were used (depending on the actual wavelength range), which were taken immediately before and after every stellar exposures. The integration times varied between 5 and 30 minutes, according to the apparent brightness, wavelength range and resolving power.
3 Description of the spectra
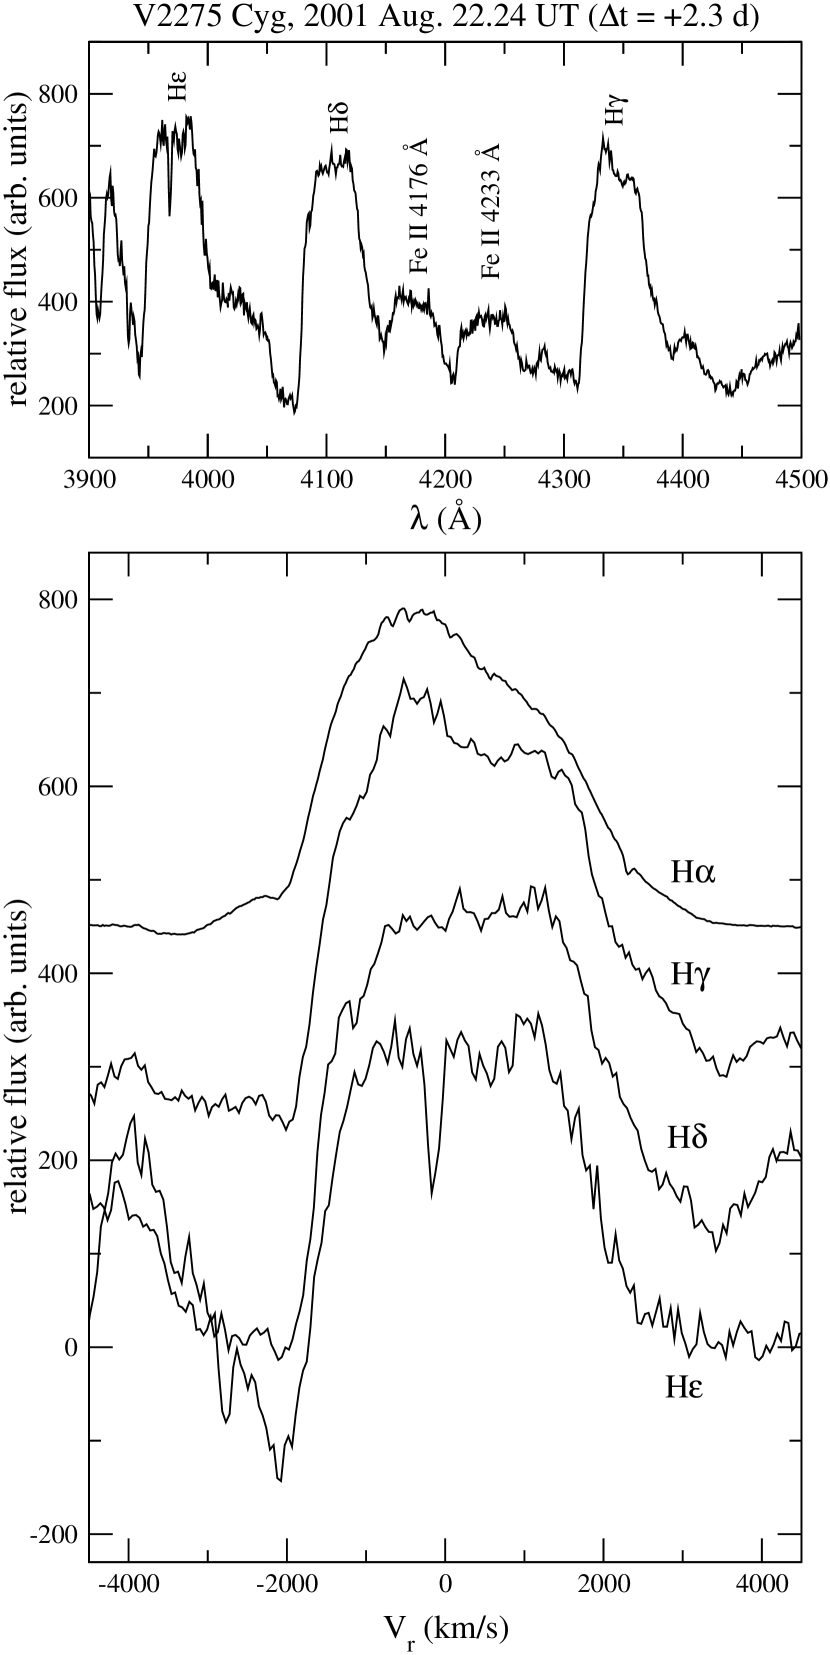
The first spectroscopic measurements were carried out on Aug. 22, approximately 2 days after the visual maximum. We recorded a 600 Å long spectrum in the blue region and an H profile. The blue spectrum showed the prominent hydrogen Balmer series lines (H, H, H) and two broad iron lines. Because of the presence of overlapping broad emission lines, the continuum level is uncertain. Therefore, this spectrum could not be normalized. It is plotted in Fig. 1, where the individual hydrogen line profiles (both H and those from the blue spectrum) are shown in the bottom panel. The P Cygni absorption is very similar in all four lines suggesting expansion velocity about 2100 km s-1, though a weak feature in the H is also visible at 3500 km s-1 (the velocity resolution is about 50 km s-1).
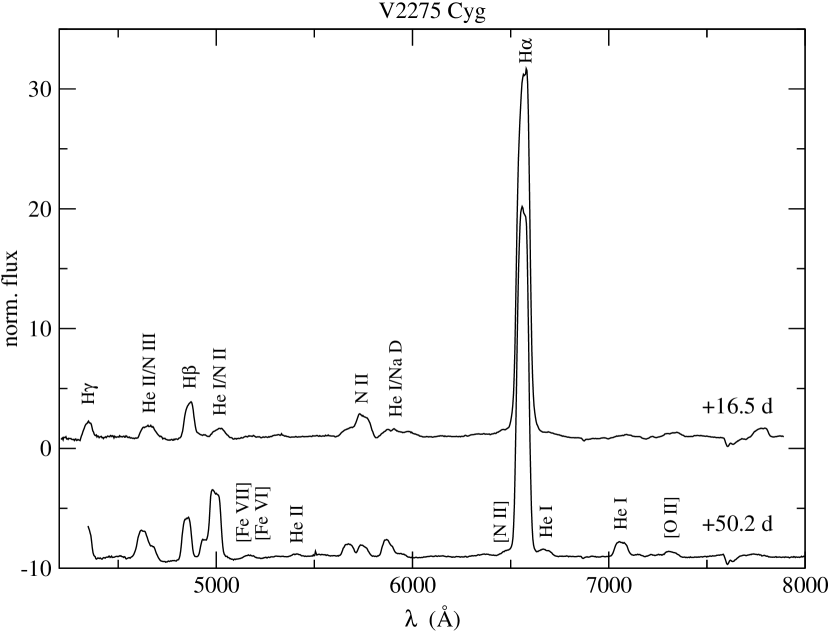
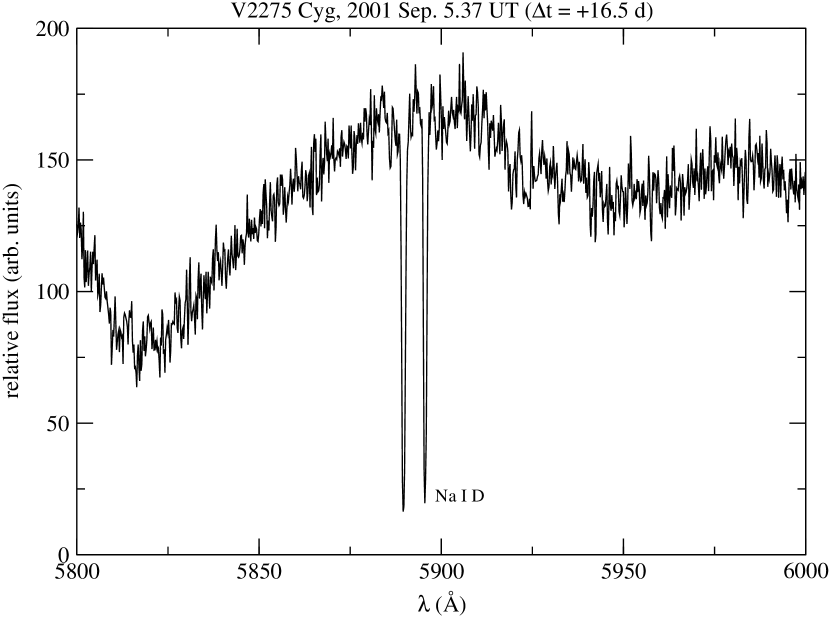
The next run was on Sep. 5, when the whole optical region between 4200 Å and 7900 Å was recorded together with a medium-resolution spectrum of the He I 5876/Na I D blend. Further low-resolution spectrum was obtained on Oct. 8 providing a rough picture of the changing spectral appearence after maximum (see Fig. 2). Using the extensive observational material published by Williams and his co-workers (Williams et al. 1991, Williams 1992, Williams et al. 1994) we could identify the following lines/blends: hydrogen Balmer series from H to H, N III 4640/He II 4686, N II 5001/He I 5016, N II 5679, He I 5876/Na I D. The later spectrum showed significant differences in strength of lines and some additional emission features appeared: [Fe VII] 5159 + [Fe VI 5176], He II 5412, [N II] blended with H, He I 6678, He I 7065, [O II] 7325. The single Na I D observation revealed very strong interstellar component (Fig. 3), which can be used as a reddening indicator (Sect. 4). Here the unknown continuum level again disables the continuum normalization
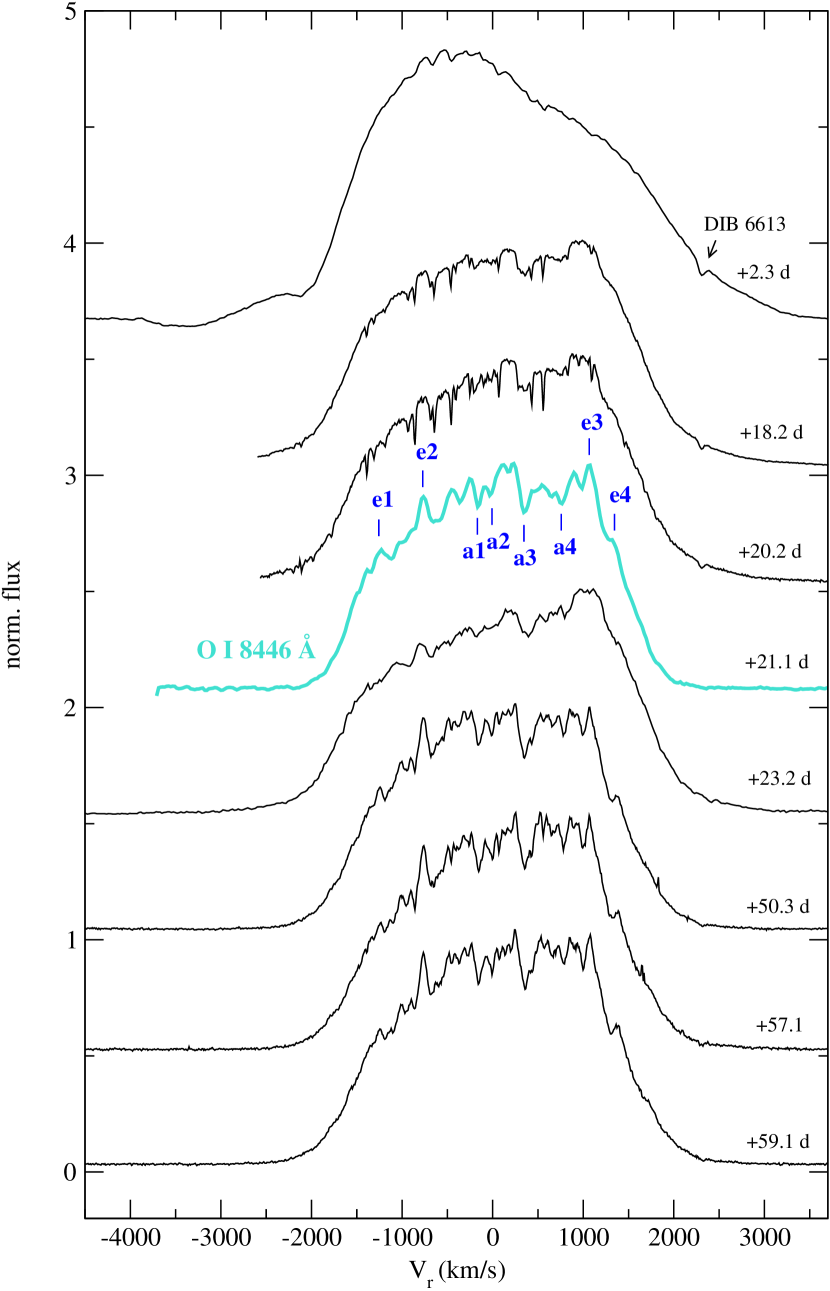
The largest number of spectra addressed the evolution of the H line. Being the strongest emission line, it could be well observed even at later phases in October, 2001, when the apparent magnitude decreased below 120. Fig. 4 summarizes the observed line profile variations. As in the case of CI Aql (Kiss et al. 2001), we detected the strong diffuse interstellar band (DIB) at 6613 Å. The general appearence of the line profile remained essentially the same, only the maximum of the continuum normalized flux changed between 15 and 35. We note the remarkably stable system of narrow absorption and emission features which can be identified in every H profiles. The existence of this system is supported by the single far red spectrum (8350 Å-8950 Å) obtained on Sep. 10. It covers the prominent O I 8446 emission line showing exactly the same system of narrow components (see Fig. 4). We have determined the component radial velocities, though it is difficult to judge which features are in absorption and which are in emission. The radial velocities of the marked features are presented in Table 2 (the velocity resolution of spectra shown in Fig. 4 is between 20 and 60 km s-1, depending on the actual spectral resolution – see Table 1).
The presented spectroscopic behavior of V2275 Cyg will be compared with other similar objects in Sect. 6, here we only mention that the spectral properties correspond to a “He/N” nova in the classification system of Williams (1992).
| Component | (km s-1) | Component | (km s-1) |
|---|---|---|---|
| a1 | 160 | e1 | 1250 |
| a2 | 0 | e2 | 760 |
| a3 | +360 | e3 | +1080 |
| a4 | +760 | e4 | +1380 |
4 The interstellar reddening
Since the most interesting parameters of a nova system depend critically on the inferred luminosity and distance, it is of paramount importance to estimate the interstellar reddening and visual extinction. In this section, we follow a similar discussion as in the case of CI Aql (Kiss et al. 2001), where similar observations resulted in an estimated . In this study three different reddening determinations were applied.
First, we have surveyed all medium-resolution spectra to identify DIBs from the list of Jenniskens & Désert (1994). The only one DIB that could be identified unambiguously is the one at 6613 Å. Although the sodium D spectrum covers the good reddening indicator DIB 5849 (Oudmaijer et al. 1997), it was hidden in the higher noise level of the sodium D spectrum. We measured the equivalent width (EW) of DIB 6613 with the IRAF task splot and found EW6613=21020 mÅ. This results in an (using the quoted uncertainty of the EW/ ratio in Jenniskens & Désert 1994).
Second, two interstellar lines of Ca II 3933.66 and Na I D lines were detected. The EWCaII can be converted into EW5780 with the empirical relationship EWCaII/EW0.81 (Jenniskens & Désert 1994). Therefore, although we have not detected DIB 5780, we could estimate its strength from the calcium line, yielding to an . The Na I D doublet provides reliable excesses only in the moderately reddened regions (up to =04, Munari & Zwitter 1997), thus it is of lower significance. The measured equivalent widths are EW Å and EW Å. Their ratio is 1.16, being in good agreement with the asymptotic behavior at high reddenings (Munari & Zwitter 1997). Therefore, the strong sodium doublet can only be used to place a lower limit on the reddening as (see Fig. 2 in Munari & Zwitter 1997).
Finally, the published colors can be also used to estimate the color excess. The color of novae around maximum tends to be about =023006 with a dispersion of 016 (Warner 1995). Two magnitudes below maximum the dispersion decreases, therefore the relation can be used. As mentioned in the Introduction, Sostero & Leopardo measured =11 and 10 at maximum light and three days later (without explicitly given uncertainties). The resulting photometric reddening lies between 09 and 10.
All of the reddening estimated scatter around 10. Despite the very good agreement of the mean values (10, 103, 09, 10), there might be higher systematic errors. In the following discussion we adopt the unweighted mean of the spectroscopic and photometric reddenings (estimated uncertainty).
5 The light curve
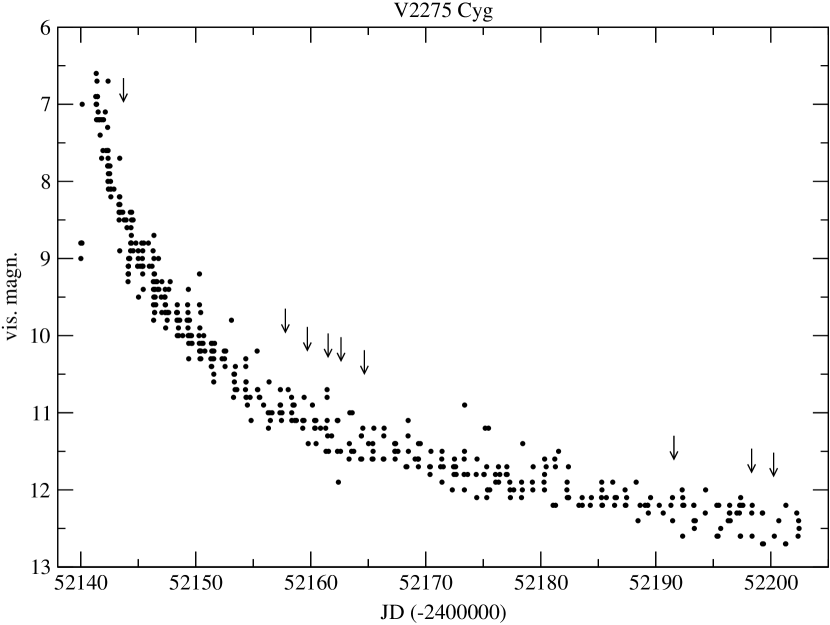
In order to estimate the main photometric properties (epoch of maximum, rates of decline), we used the visual observations collected by the VSNET group. The observational record consists of 494 individual visual estimates between the discovery and Oct. 19, 2001.
The light curve is plotted in Fig. 5. The epoch of maximum and decline rates were determined both from the original data and 0.1-day means. Unfortunately, there are only few data around the maximum, thus, the inferred epoch, (2001 Aug. 19.9 UT) is uncertain by d. The mean apparent maximum brightness was 68. The fast decline is reflected by d and d. Consequently, V2275 Cyg is a very fast nova. In fact, Table 5.2 of Warner (1995) lists only 3 faster novae (V1500 Cyg, V838 Her and MU Ser). The epochs of spectroscopic observations are also marked in Fig. 5.
Three maximum magnitude versus rate of decline (MMRD) relations were used to calculate visual absolute magnitude (Della Valle & Livio 1995, Capaccioli et al. 1989, Schmidt 1957). They result in 94, 106 and 90. The constant absolute magnitude 15 days after the maximum (Capaccioli et al. 1989) gives 99. The unweighted average is (formal error). The adopted reddening corresponds to a total visual extinction . Therefore, the estimated distance (using ) kpc is quite inaccurate. A more meaningful distance value needs proper modelling of the light curve in order to improve the calculated luminosity at maximum.
6 Discussion
Based on the presented spectroscopic behavior of V2275 Cyg we identify the star as a member of the “He/N” subclass of classical novae following the definition by Williams (1992). All of the defining characteristics are satisfied: broad lines (HWZI 2500 km s-1) dominate the spectrum, the prominent lines are flat-topped with little absorption, a few forbidden lines occurred and . On the other hand, the very fast decline is also typical among the “He/N” novae. According to Williams (1992), this means that the broader lines of the “He/N” emission spectrum originate in a discrete shell ejected at high velocities from the white dwarf surface at the peak of the outburst. The stable system of narrow components in the H and O I profiles support the presence of one or more discrete shells, as provided by the emission line profile calculations of Gill & O’Brian (1999). An alternative to the rings+polar caps geometry is inhomogeneous ejecta with knots or clumps (see, e.g., Shore et al. 1997).
Since typical recurrent novae are classified as “He/N” novae, it is a natural consequence that the overall spectral appearance of V2275 Cyg is very similar to some well-observed recurrent novae. The most recent example is CI Aql (Kiss et al. 2001), where the gross spectral characteristics are very similar. Furthermore, close similarity is evident from a comparison with other recurrent novae, such as U Sco (Munari et al. 1999) or V394 CrA (Sekiguchi et al. 1989). The question arises: could V2275 Cyg be a recurrent nova, observed in outburst for the first time? We consider this to be quite unlikely. If the progenitor is indeed the star identified by Schmeer et al. (2001) with 188 USNO-A2.0 red magnitude, and our calculated absolute magnitude is approximately correct, then the resulting absolute magnitude for the progenitor is M mag. This excludes the possibility of a red giant secondary as usual in recurrent novae. To fit the suggested progenitor with a typical red giant star, the outburst should have a visual absolute magnitude over 12 mag, much brighter than any nova outburst ever observed. If the progenitor was fainter and hidden by the suggested USNO-A2.0 star, then the recurrent nova status is even less likely.
As expected from the very fast decline, V2275 Cyg closely resembles in some aspects the well-studied fast nova, V1500 Cyg. Strittmatter et al. (1977) presented a comparison of H and O I 8446 profiles, where they found a similar agreement between the line profiles to those presented in Fig. 4. They concluded that the O I 8446 line is due to Lyman fluorescence in clouds with high H optical depth. The strong resemblence suggest similar explanation in the case of V2275 Cyg.
Further photometric as well as spectroscopic observations are expected to extend the data baseline yielding to a better understanding of V2275 Cyg. At present, neither the unambiguously identified progenitor, nor the orbital period of the binary is known – both are crucial for a reliable description of the system. On the other hand, theoretical light curve modelling may place stronger constraints on the luminosity of the outburst.
Acknowledgements.
This research was supported by the “Bolyai János” Research Scholarship of LLK from the Hungarian Academy of Sciences, FKFP Grant 0010/2001, Hungarian OTKA Grants #T032258 and #T034615, Pro Renovanda Cultura Hungariae Grant DCS 2001. ápr/6. and Szeged Observatory Foundation. The NASA ADS Abstract Service was used to access data and references. We also acknowledge the data service of the VSNET group. The authors express their sincere thanks to Dr. M. De Robertis, who obtained one of the nova spectra during his visit at DDO. This research has made use of Simbad Database operated at CDS-Strasbourg, France.References
- (1) Ayani, K., 2001, IAUC No. 7686, 3
- (2) Capaccioli, M., Della Valle, M., D’Onofrio, M., & Rosino, L. 1989, AJ, 97, 1622
- (3) Della Valle, M., & Livio, M. 1995, ApJ, 452, 704
- (4) Gill, C. D., & O’Brian, T. J. 1999, MNRAS, 307, 677
- (5) Jenniskens, P., & Désert, F.-X. 1994, A&AS, 106, 39
- (6) Kiss, L. L., & Thomson, J. R. 2000, A&A, 355, L9
- (7) Kiss, L. L., Thomson, J. R., Ogloza, W., et al. 2001, A&A, 366, 858
- (8) Munari, U., & Zwitter, T. 1997, A&A, 318, 269
- (9) Munari, U., Zwitter, T., Tomov, T., et al. 1999, A&A, 347, L39
- (10) Nakamura, A., Tago, A., & Abe, H. 2001, IAUC No. 7686, 2
- (11) Nakano, S., Hatayama, K., Kato, T., et al. 2001, IAUC No. 7687
- (12) Oudmaijer, R. D., Busfield, G., & Drew, J. E. 1997, MNRAS, 291, 797
- (13) Samus, N., Kato, T., Yoshida, H., et al. 2001, IAUC No. 7691
- (14) Schmeer, P., Hornoch, K., Pereira, A., et al. 2001, IAUC No. 7688
- (15) Schmidt, T. 1957, Z. Astrophys., 41, 182
- (16) Sekiguchi, K., Catchpole, R. M., Fairall, A. P., et al. 1989, MNRAS, 236, 611
- (17) Shore, S.N., Starrfield, S., Ake, T.B., III, & Hauschildt, P.H., 1997, ApJ, 490, 393
- (18) Strittmatter, P. A., Woolf, N. J., Thompson, R. I., et al. 1977, ApJ 216, 23
- (19) Warner, B. 1995, Cataclysmic variable stars (Cambridge University Press, Cambridge)
- (20) Williams, R. E., Hamuy, M., Phillips, M. M., et al. 1991, ApJ, 376, 721
- (21) Williams, R. E. 1992, AJ, 104, 725
- (22) Williams, R. E., Phillips, M. M., & Hamuy, M. 1994, ApJS, 90, 297