A Galactic Wind at 11affiliation: Based on observations made at the W.M. Keck Observatory, which is operated as a scientific partnership among the California Institute of Technology, the University of California and the National Aeronautics and Space Administration. The Observatory was made possible by the generous financial support of the W.M. Keck Foundation.
Abstract
We report the serendipitous detection in high–resolution optical spectroscopy of a strong, asymmetric Ly emission line at . The detection was made in a 2.25 hour exposure with the Echelle Spectrograph and Imager on the Keck II telescope through a spectroscopic slit of dimensions 1″ 20″. The progenitor of the emission line, J123649.2621539 (hereafter ES1), lies in the Hubble Deep Field North West Flanking Field where it appears faint and compact, subtending just 03 (FWHM) with . The ES1 Ly line flux of ergs cm-2 s-1 corresponds to a luminosity of ergs s-1, and the line profile shows the sharp blue cut–off and broad red wing commonly observed in star–forming systems and expected for radiative transfer in an expanding envelope. We find that the Ly profile is consistent with a galaxy–scale outflow with a velocity of km s-1. This value is consistent with wind speeds observed in powerful local starbursts (typically to km s-1), and compares favorably to simulations of the late–stage evolution of Ly emission in star–forming systems. We discuss the implications of this high–redshift galactic wind for the early history of the evolution of galaxies and the intergalactic medium, and for the origin of the UV background at .
1 Introduction
Following the epoch of recombination, the Universe settled into the comparatively dormant dark ages, during which the primordial glow had begun to fade but the first present–day astronomical objects had yet to form. This tranquil epoch proved short–lived, however, as the formation of the first stars and quasars ushered in the first era of cosmological heating and enrichment at (e.g. Gnedin & Ostriker, 1997; Haiman & Loeb, 1997, 1998; Ostriker & Gnedin, 1996; Valageas & Silk, 1999). Evidence of these processes in the form of galaxy–scale outflows is abundant in spectroscopy of the high–redshift Universe. Both optical/IR spectra of the Lyman–break population (e.g. Pettini et al., 2001) and optical spectra of lensed Ly–emitting galaxies at (Frye, Broadhurst, & Benitez, 2001) show metal absorption lines which are blueshifted by hundreds of km s-1 with respect to the stellar rest frame of the galaxy, and Ly emission lines which are shifted similarly redward. These observations, as well as the characteristic P–Cygni profile of the Ly emission lines (e.g. Bunker, Moustakas, & Davis 2000; Dey et al. 1997, 1998; Dickinson 1998; Ellis et al. 2001, Lowenthal et al. 1997; Weymann et al. 1998) paint a coherent picture of optically thick expanding regions surrounding star–forming galaxies, most naturally driven by the starbursts that render them visible in the first place (e.g. Heckman et al., 2000, and references therein).
We present a direct observation of such an outflow at in high–resolution optical spectroscopy of the serendipitously detected star–forming galaxy J123649.2621539 (hereafter ES1, for Echelle Spectrograph and Imager serendipitous detection number one). The sharp blue cut–off and broad red wing of the ES1 Ly emission line are consistent with the profile expected for the transfer of line radiation in an expanding envelope (e.g. Surdej, 1979). The suggested outflow velocity of km s-1 is in broad agreement with simulations of the late evolution of Ly emission and absorption in star–forming galaxies (e.g. Tenorio–Tagle et al., 1999), and is consistent with observations of powerful nearby starbursts (e.g. Heckman, Armus, & Miley, 1990). The spectrum of ES1 therefore presents evidence for both a high star–formation rate and a high–redshift, starburst–driven galactic wind, fitting well within the expectations of current models for the early history of galaxy formation.
In §2 we discuss the detection of ES1 and we give a description of the spectrum and the available archival imaging. In §3 we detail the properties of the ES1 Ly emission line, and we present a model for the emission line profile consistent with the expanding shell scenario introduced above. We conclude in §4 with a discussion of the implications of the evidence for a strong outflow in ES1 for both the evolution of galaxies and the intergalactic medium (IGM) at high redshift, and for the origin of the UV background at . Throughout this paper we adopt the currently favored –cosmology of and , with km s-1 Mpc-1 (e.g. Riess et al., 2001). At , such a universe is only 1.10 Gyr old — corresponding to a look–back time of 92.1% of the age of the Universe — and an angular size of 10 corresponds to 6.31 kpc.
2 Observation and Data Reduction
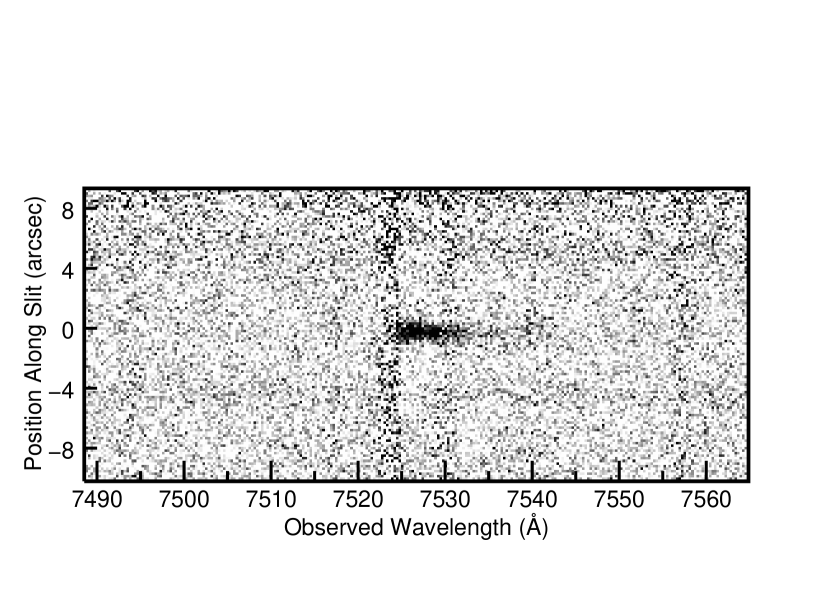
ES1 was detected in a 2.25 hour exposure made with the Echelle Spectrograph and Imager (ESI; Sheinis et al., 2000) at the Cassegrain focus of the Keck II telescope on UT 2001 February 25. The instrument was configured in its medium–resolution echellete mode with a spectroscopic slit of dimensions 1″ 20″, yielding a spectral resolution of Å (78 km s-1) at 7500 Å. The 2.25 hour exposure was broken into four integrations of 1800 seconds and one integration of 900 seconds; we performed 3″ spatial offsets between each integration to facilitate the removal of fringing at long wavelengths. We used IRAF111IRAF is distributed by the National Optical Astronomy Observatories, which are operated by the Association of Universities for Research in Astronomy, Inc., under cooperative agreement with the National Science Foundation. (Tody, 1993) to process the echellogram, following standard slit spectroscopy procedures (e.g. Massey, Valdes, & Barnes, 1993)222A User’s Guide to Reducing Slit Spectra with IRAF, available online at http://iraf.noao.edu/iraf/web/docs/spectra.html. Some aspects of treating the ten individual orders of the spectrum were facilitated by the software package BOGUS333BOGUS is available online at http://zwolfkinder.jpl.nasa.gov/stern/homepage/bogus.html., created by D. Stern, A.J. Bunker, and S.A. Stanford. Wavelength calibrations were performed in the standard fashion using Xe, HgNe, and CuAr arc lamps; we employed telluric sky lines to adjust the wavelength zero–point. The night was near photometric with 06 seeing, and we performed flux calibrations with observations of standard stars from Massey & Gronwall (1990) taken with the instrument in the same configuration as the target observation. A portion of one order of the discovery spectrum, centered on the ES1 emission line, is shown in Figure 1.
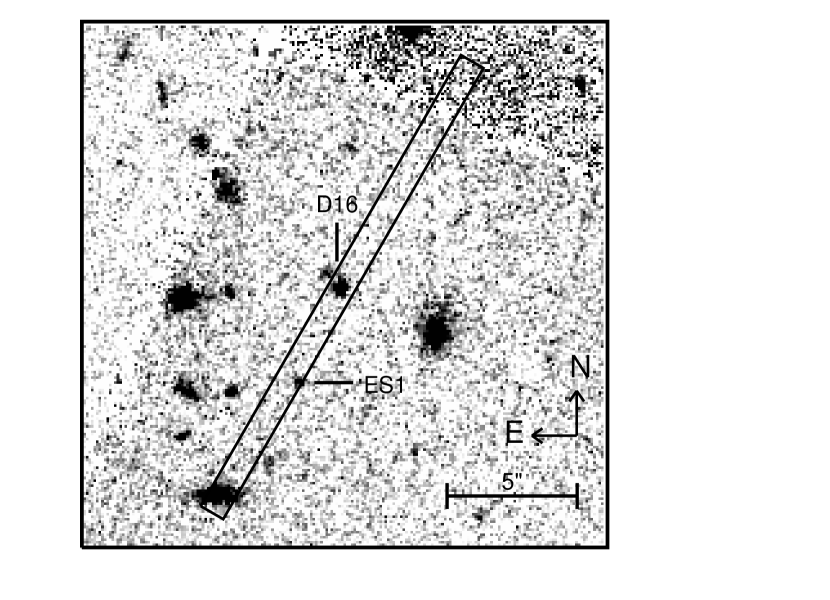
The target object for this observation was a Lyman–break galaxy at (D16; Steidel 2001, private communication), located in the Hubble Deep Field North West Flanking Field (Williams et al., 1996). ES1 was fortuitously placed on the spectroscopic slit roughly 4″ south of D16, along the parallactic angle of 150∘ (Figure 2). Upon making the observation, we immediately noticed a strong, serendipitously detected emission line near 7527 Å whose asymmetric profile suggested redshifted Ly at . As the spectrograph configuration for the discovery spectrum covered only 20 arcsec2 — suggesting a surface density of high redshift Ly–emitters roughly 30 to 90 times in excess of current estimates (e.g. Cowie & Hu 1998; Dawson et al. 2001; Stern & Spinrad 1999; Thompson, Weymann, & Storrie–Lombardi 2001) — we consider the detection of ES1 to be highly providential.
Careful inspection of the reduced spectrum failed to reveal emission lines at other wavelengths. Though the galaxy continuum is faintly detected redward of the emission line, the observation did not achieve sufficient signal–to–noise to confirm the presence or absence of interstellar absorption lines. The non–detection of high–ionization state emission lines typically observed in AGN spectra, e.g. N V , C IV , or He II , strongly suggests that the Ly emission in ES1 is due to the Lyman continuum flux of OB stars, rather than the hard UV spectrum of an AGN. For , the nebular emission lines typically associated with star–forming galaxies are inaccessible to optical spectroscopy.
We were fortunate that ES1 is located in the HDF North West Flanking Field. Figure 2 displays a portion of the single–orbit Hubble Space Telescope (hereafter HST) image of that region with a projection of the spectroscopic slit. ES1 is faint and compact, typical for a very distant galaxy (Steidel et al., 1996). By running the source extraction algorithm SExtractor (Bertin & Arnouts, 1996) on the Flanking Field image and employing the conversion from data number to AB magnitude given in Williams et al. (1996), we determine an isophotal magnitude for ES1 of . This is challengingly faint, comparable to the first detected galaxies at , e.g. HDF 3–951 with (Spinrad et al., 1998). Moreover, as an appreciable fraction of the –band radiation for the source is from the Ly emission line, the true continuum magnitude must be still fainter than that determined from the source extraction. ES1 appears marginally resolved, subtending 03 (FWHM) on the Flanking Field image, while stars on the same image have a FWHM near 02. Thus, the physical size of the emitting region appears to be only kpc in diameter.
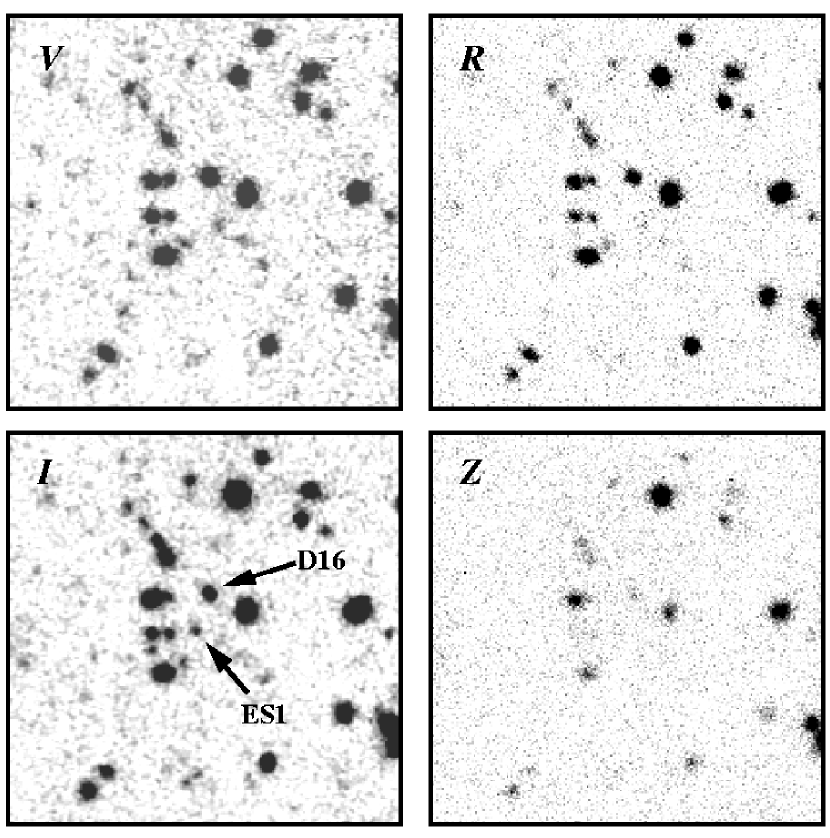
We present ground–based , , , and images of ES1 in Figure 3 and we give the ground–based photometry in Table 2. The and images are from the Canada France Hawaii Telescope imaging campaign of Barger et al. (1999); the and images are from our own Keck imaging campaign of the HDF and its environs (see Stern et al., 2000). The fact that ES1 is not detectable in the or bands is characteristic of high–redshift galaxies, where intervening neutral hydrogen (the Lyman forests) severely attenuates the continuum signal blueward of Ly (Madau, 1995; Steidel et al., 1996; Stern & Spinrad, 1999). The fact that ES1 is not detectable in the band is due only to the comparative shallowness of the band image. Based on the model spectrum described in section § 3.2 and assuming that ES1 has a flat spectrum in at wavelengths longer than the emission line, we expect a Vega–based continuum magnitude in the band of . This value is almost five times as faint as the limiting magnitude in that image (see Table 2).
3 Properties of the Ly Emission Line
3.1 The Emission Line Luminosity & Equivalent Width
In the fashionable cosmology , , the ES1 Ly flux of ergs cm-2 s-1 corresponds to a line luminosity of ergs s-1. For the prescription given in Dey et al. (1998) assuming no dust aborption and negligible extinction, this luminosity corresponds to a star formation rate (SFR) of M⊙ yr-1. As is evident in Figure 4, these values are typical of Ly–emitting galaxies at high redshift () discovered serendipitously (e.g. Dawson et al., 2001; Dey et al., 1998; Manning et al., 2000; Spinrad et al., 1999; Stern & Spinrad, 1999) or in narrow band surveys (e.g. Hu et al., 1999; Rhoads et al., 2000). Of course, such galaxies may represent rare systems at the high–luminosity tip of an unexplored underlying population, and the observed Ly luminosities may accordingly be governed by a selection effect. This point is borne out by the faint system discovered in the blind spectroscopic survey of well–constrained lensing clusters (Ellis et al., 2001), which is at a higher redshift () and is an order of magnitude less luminous in Ly than ES1.
We estimate a rest–frame equivalent width for the emission line of Å based on the emission line model described in the following section. This result should be treated with a degree of circumspection, however. The foremost caveat is that both the total line flux and the continuum level which enter the calculation were obtained from the model spectrum before attenuation by neutral hydrogen absorption. In this manner we attempted to circumvent the ambiguity in deriving an equivalent width from a strongly P–Cygni line profile coupled with a pronounced continuum break, essentially arriving at a theoretical equivalent width from the spectrum as it would appear if not truncated by foreground absorption. As a second caveat, the continuum redward of the emission line is not well–detected, with a significance of far less than . Together, we expect these two effects to cause an over-estimation of . However, this tendency toward over–estimation may be offset by the fact that this is a serendipitous detection, so ES1 was not well centered in the spectroscopic slit (see Figure 2). As such, we have been conservative in our estimate of the uncertainty in , which includes sky noise, the uncertainty in the continuum level redward of the emission line in the extracted spectrum, and the fit errors in the model spectrum. Even so, with Å, ES1 figures in the top 2% of Lyman–break galaxies with Ly in emission in the near–complete continuum–selected sample of Steidel et al. (2000).
3.2 Modeling the Emission Line
The asymmetric Ly emission lines commonly observed in high–redshift starburst galaxies are generally ascribed to the interaction of Lyman continuum photons generated by newborn OB associations with a galaxy–scale expanding shell of neutral hydrogen. For a sufficiently massive starburst, the hot ionized gas created in the vicinity of the stars vents into the halo of the galaxy, where it sweeps up neutral hydrogen into an optically thick shell. Recombination in the ionized gas converts Lyman continuum photons escaping from the surface of the hot stars into line photons. Then, from the vantage of an observer, the near side of the expanding shell absorbs photons on the blue side of the resonant Ly emission line, causing a flux decrement on what would otherwise be the blue wing of the Ly emission. The far side of the shell back–scatters Ly photons into the observer’s line–of–sight; as these photons are offset redward by hundreds of km s-1 from both the rest frame of the galaxy and the approaching side of the neutral shell, they escape the galaxy and impose a pronounced red wing on the emission line profile. The net effect is to create the P–Cygni profile ubiquitous in observations of expanding shells.
The comparatively high signal–to–noise of the ES1 Ly detection created the opportunity for probing this emission line structure with a simple model. In accordance with the scenario described above, we fit the Ly emission feature with three components: (1) a comparatively large amplitude, narrow Gaussian intended to model line radiation generated by recombination in the ionized hydrogen; (2) a small amplitude, broad Gaussian intended to model the red wing of line photons back–scattered off the far side of the expanding shell; and (3) a Voigt absorption profile intended to model the blue decrement caused by the absorption of line photons by the near side of the shell. We modeled the weak continuum with a constant () baseline.
To account for the continuum decrement caused by line blanketing in the Ly forest, we attenuated the model spectrum by a transmission profile adopted from Madau (1995), where the optical depth due to the combined effect of many Ly absorption lines is given as
| (1) |
with Å. At high redshifts (), absorption by metal systems makes a non–negligible contribution to cosmic opacity. Hence, we accounted for the combined effect of metal lines with the additional factor also given in Madau (1995),
| (2) |
Neither Lyman series line blanketing nor continuum absorption from neutral hydrogen were included, as both these effects fall shortward of the wavelength range of interest.
Figure 5 shows the minimum– model resulting when the centroids, amplitudes, and widths of each of the model components are left unconstrained. We weighted the –fit by the error spectrum shown in the figure; this had the effect of diminishing the contribution to the fit by pixels which fall on OH and O2 night sky emission lines (which are the dominant source of error in low signal–to–noise spectra over the wavelengths of interest). We note that the residuals are distributed evenly about zero, demonstrating an encouraging lack of systematic error in our model. Furthermore, when just the components intended to model the expanding shell were examined (the red, broad Gaussian and the blue Voigt–profile absorption), we found the resulting profile to be in excellent qualitative agreement with the P–Cygni line profiles expected for the transfer of line photons in expanding envelopes (e.g. see Surdej, 1979, and references therein).
Table 1 summarizes the minimum– model parameters. This best–fit model yields a redshift for the central component of the ES1 emission line of . Most strikingly, to fit the red wing of the emission line, the model demands that the broad emission component be displaced by 320 km s-1 from the central emission component. Owing to the strong signal of the Ly forest at such a high redshift, only a small blue absorption component is required. Still, though of minor amplitude, the absorption component is displaced by fully km s-1 from the central emission component. These displacement velocities are in broad agreement with those predicted by Tenorio–Tagle et al. (1999) for the late stages of the evolution of the Ly profile of a star–forming galaxy. Moreover, though these values somewhat exceed the km s-1 winds typically observed in nearby starbursting dwarf galaxies (e.g. Martin, 1998), they compare favorably with the – km s-1 outflows observed in more powerful local starbursts (Heckman et al., 1990).
We explored a variety of alternative kinematic scenarios for the ES1 emission, most notably by fixing the centroid for the central emission component and arbitrarily sliding the separation between the central component and the broad component over a range of values. These models suffered from worsened , with broader emission demanded as the displacement velocity was diminished. Figure 6 illustrates this trend, implying that even if the minimum– model in Figure 5 over–estimates the separation between the central component and the broad component of the Ly emission, the broad component itself can only get broader. That is, no matter what combination of fit–parameters one chooses, there is no escaping a very energetic component to the Ly emission of ES1. In a similar vein, it is also worthy of note that models which do not include a high–velocity compenent (e.g. models with a single Gaussian emission compenent) also suffer from a worsened compared to that of the model in Figure 5.
4 Discussion and Conclusion
The spectral profile of the Ly emission of ES1 presents evidence for a galaxy–scale outflow with a velocity of km s-1. Of course, as Heckman et al. (2000) caution, the outflow rate of a galactic wind cannot necessarily be interpreted as the rate at which mass or energy escapes into the IGM, since the observable manifestation of an outflow may be produced by material still deep inside the gravitational potential well of the galaxy halo. Nonetheless, the outflow velocity estimated for ES1 far exceeds the escape speed of a nominally low mass () pregalactic fragment, consistent with the general observation that hot gas can readily escape from dwarf galaxies, though perhaps not from more massive systems (Heckman et al., 2000; Heckman, 2000; Martin, 1999).
This conclusion bears on a host of cosmological issues surrounding the evolution of galaxies and the IGM at high redshift. Foremost, it suggests that processed material from ES1 will become available to the IGM, potentially providing the enrichment necessary to account for the amount of metals there observed. Indeed, recent observations of C IV absorption systems along the lines–of–sight to lensed QSOs call for enrichment at increasingly high redshift, beyond even (e.g. Aguirre et al. 2001; Rauch, Sargent, & Barlow 2001). Additionally, both detailed observations and careful theoretical studies demand a mechanism for pre–heating the material out of which galaxy clusters ultimately collapse and become bound (e.g. Kaiser, 1991; Mushotzky & Scharf, 1997, and references therein). Here again, galaxy–scale outflows at high redshift are the likely culprit (e.g. Renzini et al., 1993). Finally, galactic winds have proved important in reproducing the faint–end slope of the observed field galaxy luminosity function in semi–analytic models of galaxy formation. Outflows are invoked to suppress star–formation in low–mass dark matter halos, either via the direct escape of gas–phase baryons in the outflow itself (e.g. Somerville & Primack, 1999), or by ram pressure stripping of the gas–phase baryons by energetic winds from neighboring galaxies (Scannapieco & Broadhurst, 2001).
As a somewhat speculative conclusion, we now consider the expected correlation between strong galactic outflows and the escape of Lyman continuum radiation from star–forming galaxies. This correlation bears directly on the much–debated physical nature and relative contributions of the sources which comprise the UV background, as a significant contribution by sources other than QSOs is required at high redshift, owing to the rapid decline in the space density of optical and radio–loud quasars at (Bianchi, Cristiani, & Kim, 2001; Madau, Haardt, & Rees, 1999).
It is likely that star–forming galaxies fill this niche. From the theoretical standpoint, mechanical energy deposition in the form of supernovae and stellar winds is expected to result in an over–pressured cavity of hot gas inside star–forming galaxies. In galaxies for which the star–formation rate per unit area , the superbubble ultimately expands and bursts out into the galaxy halo, allowing for the escape of hot gas and facilitating the leak of Lyman continuum photons (Heckman et al., 2000; Tenorio–Tagle et al., 1999). Of course, as the superbubble will expand in the direction of the vertical pressure gradient, the burst is expected to take the form of a weakly collimated, bipolar wind. Hence, the leak of UV radiation may depend sensitively on not only the distribution of neutral gas and dust in the galaxy interstellar medium, but on the inclination of the system. Nonetheless, from the observational standpoint, Steidel, Pettini, & Adelberger (2001, hereafter SPA01) report the detection of significant Lyman continuum emission in a composite spectrum of 29 Lyman–break galaxies at , suggesting an escape fraction444Here, is the fraction of emitted 900 Å photons that escapes the galaxy without being absorbed by interstellar material, normalized by the fraction of emitted 1500 Å photons which similarly escapes. As SPA01 point out, this definition differs from definitions encountered elsewhere, which typically consider only the fraction of emitted 900 Å photons which escapes (e.g. Bianchi et al. 2001; Heckman et al. 2001; Hurwitz, Jelinsky, & Dixon 1997; Leitherer et al. 1995). of UV ionizing photons of .
Given the evidence for a strong outflow in ES1, it would be intriguing to measure the flux of photons below Å. However, ES1 is very faint even above Ly; we estimate that it fades to below the Lyman limit. We can do only slightly better at high redshifts with more accessible spectra: even in a composite of four of the highest signal–to–noise Keck spectra of galaxies at collected by Spinrad and collaborators (Figure 7), our measurement of the flux of 900 Å photons is consistent with zero at the level. This result translates to the coarsely constrained flux ratio ( uncertainty). To convert this value to the more useful ratio, we adopt an empirical correction factor based on the set of fluxes given in SPA01, yielding an effective . Finally, for the same intrinsic Lyman discontinuity of 3 adopted by SPA1, we find an escape fraction of . As we did not correct our initial ratio for the opacity of the IGM, this value represents a lower limit. Evidently, to satisfactorily constrain the correlation between outflow dynamics and the escape of UV ionizing photons in an individual high redshift galaxy, we will require spectroscopy of a lensed, blue candidate system viewed along the outflow direction.
References
- Aguirre et al. (2001) Aguirre, A., Hernquist, L., Schaye, J., Weinberg, D., & Katz, N. 2001, ApJ, in press [astro–ph/0006345]
- Barger et al. (1999) Barger, A. J., Cowie, L. L., Trentham, N., Fulton, E., Hu, E. M., Songaila, A., & Hall, D. 1999, AJ, 117, 102
- Bertin & Arnouts (1996) Bertin, E. & Arnouts, S. 1996, A&AS, 117, 393
- Bianchi et al. (2001) Bianchi, S., Cristiani, S., & Kim, T. S. 2001, A&A, 376, 1
- Bunker et al. (2000) Bunker, A. J., Moustakas, L. A., & Davis, M. 2000, ApJ, 531, 95
- Cowie & Hu (1998) Cowie, L. L. & Hu, E. M. 1998, AJ, 115, 1319
- Dawson et al. (2001) Dawson, S., Stern, D., Bunker, A. J., Spinrad, H., & Dey, A. 2001, AJ, 122, 598
- Dey et al. (1998) Dey, A., Spinrad, H., Stern, D., Graham, J. R., & Chaffee, F. H. 1998, ApJ, 498, L93
- Dey et al. (1997) Dey, A., van Breugel, W., Vacca, W. D., & Antonucci, R. 1997, ApJ, 490, 698
- Dickinson (1998) Dickinson, M. 1998, in STScI Symp. Ser. 11, The Hubble Deep Field, ed. M. Livio, S. M. Fall, P. Madau (Cambridge: Cambridge University Press), 219
- Ellis et al. (2001) Ellis, R., Santos, M. R., Kneib, J., & Kuijken, K., 2001, ApJ, 560, L119
- Frye, Broadhurst, & Benitez (2001) Frye, B., Broadhurst, T., & Benitez, N., 2001, ApJ, in press [astro–ph/0112095]
- Gnedin & Ostriker (1997) Gnedin, N. Y. & Ostriker, J. P. 1997, ApJ, 486, 581
- Heckman (2000) Heckman, T. M. 2000, in ASP Conf. Ser. 240, Gas & Galaxy Evolution, ed. J. Hibbard, M. Rupen, J. van Gorkom (San Francisco: ASP), available November 2001 [astro–ph/0009075]
- Haiman & Loeb (1997) Haiman, Z. & Loeb, A. 1997, ApJ, 483, 21
- Haiman & Loeb (1998) Haiman, Z. & Loeb, A. 1998, ApJ, 503, 505
- Heckman et al. (1990) Heckman, T. M., Armus, L., & Miley, G. K. 1990, ApJS, 74, 833
- Heckman et al. (2000) Heckman, T. M., Lehnert, M. D., Strickland, D. K., & Armus, L. 2000, ApJS, 129, 493
- Heckman et al. (2001) Heckman, T. M., Sembach, K. R., Meurer, G. R., Leitherer, C., Calzetti, D., & Martin, C. L. 2001, ApJ, 558, 56
- Hu et al. (1999) Hu, E. M., McMahon, R. G., & Cowie, L. L. 1999, ApJ, 522, L9
- Hurwitz et al. (1997) Hurwitz, M., Jelinsky, P., & Dixon, W. V. D. 1997, ApJ, 481, L31
- Kaiser (1991) Kaiser, N. 1991, ApJ, 383, 104
- Leitherer et al. (1995) Leitherer, C., Ferguson, H. C., Heckman, T. M., & Lowenthal, J. D. 1995, ApJ, 454, L19
- Lowenthal et al. (1997) Lowenthal, J. D., et al. 1997, ApJ, 481, 673
- Madau (1995) Madau, P. 1995, ApJ, 441, 18
- Madau et al. (1999) Madau, P., Haardt, F., & Rees, M. J. 1999, ApJ, 514, 648
- Manning et al. (2000) Manning, C., Stern, D., Spinrad, H., & Bunker, A. J. 2000, ApJ, 537, 65
- Martin (1998) Martin, C. L. 1998, ApJ, 506, 222
- Martin (1999) —. 1999, ApJ, 513, 156
- Massey & Gronwall (1990) Massey, P. & Gronwall, C. 1990, ApJ, 358, 344
- Massey et al. (1993) Massey, P., Valdes, R., & Barnes, J. 1993, A User’s Guide to Reducing Slit Spectra with IRAF, http://iraf.noao.edu/iraf/web/docs/spectra.html
- Mushotzky & Scharf (1997) Mushotzky, R. F. & Scharf, C. A. 1997, ApJ, 482, L13
- Ostriker & Gnedin (1996) Ostriker, J. P. & Gnedin, N. Y. 1996, ApJ, 472, L63
- Pettini et al. (2001) Pettini, M., Shapley, A. E., Steidel, C. C., Cuby, J., Dickinson, M., Moorwood, A. F. M., Adelberger, K. L., & Giavalisco, M. 2001, ApJ, 554, 981
- Rauch et al. (2001) Rauch, M., Sargent, W. L. W., & Barlow, T. A. 2001, ApJ, 554, 823
- Renzini et al. (1993) Renzini, A., Ciotti, L., D’Ercole, A., & Pellegrini, S. 1993, ApJ, 419, 52
- Rhoads et al. (2000) Rhoads, J. E., Malhotra, S., Dey, A., Stern, D., Spinrad, H., & Jannuzi, B. T. 2000, ApJ, 545, L85
- Riess et al. (2001) Riess, A. et al. 2001, ApJ, in press [astro–ph/0104455]
- Scannapieco & Broadhurst (2001) Scannapieco, E. & Broadhurst, T. 2001, ApJ, 549, 28
- Sheinis et al. (2000) Sheinis, A. I., Miller, J. S., Bolte, M., & Sutin, B. M. 2000, in Proc. SPIE Vol. 4008, 522–533, Optical and IR Telescope Instrumentation and Detectors, ed. M. Iye & A. F. Moorwood (Bellingham: SPIE), 522
- Somerville & Primack (1999) Somerville, R. S. & Primack, J. R. 1999, MNRAS, 310, 1087
- Spinrad et al. (1999) Spinrad, H., Dey, A., Stern, D., & Bunker, A. 1999, in Proc. KNAW Colloq., 257, The Most Distant Radio Galaxies, ed. H. Rottgering, N. Best, M. Lenhert (Utrecht: KNAW), 257
- Spinrad et al. (1998) Spinrad, H., Stern, D., Bunker, A., Dey, A., Lanzetta, K., Yahil, A., Pascarelle, S., & Fernández–Soto, A. 1998, AJ, 116, 2617
- Steidel et al. (2000) Steidel, C. C., Adelberger, K. L., Shapley, A. E., Pettini, M., Dickinson, M., & Giavalisco, M. 2000, ApJ, 532, 170
- Steidel et al. (1996) Steidel, C. C., Giavalisco, M., Pettini, M., Dickinson, M., & Adelberger, K. L. 1996, ApJ, 462, L17
- Steidel et al. (2001) Steidel, C. C., Pettini, M., & Adelberger, K. L. 2001, ApJ, 546, 665 (SPA01)
- Stern et al. (2000) Stern, D., Eisenhardt, P., Spinrad, H., Dawson, S., van Breugel, W., Dey, A., de Vries, W., & Stanford, S. A. 2000, Nature, 408, 560
- Stern & Spinrad (1999) Stern, D. & Spinrad, H. 1999, PASP, 111, 1475
- Surdej (1979) Surdej, J. 1979, A&A, 73, 1
- Tenorio–Tagle et al. (1999) Tenorio–Tagle, G., Silich, S. A., Kunth, D., Terlevich, E., & Terlevich, R. 1999, MNRAS, 309, 332
- Thompson et al. (2001) Thompson, R. I., Weymann, R. J., & Storrie–Lombardi, L. J. 2001, ApJ, 546, 694
- Tody (1993) Tody, D. 1993, in ASP Conf. Ser. 52, Astronomical Data Analysis Software and Systems II, ed. R. Hanisch, R. Brissenden, J. Barnes (San Francisco: ASP), 173
- Valageas & Silk (1999) Valageas, P. & Silk, J. 1999, A&A, 347, 1
- Weymann et al. (1998) Weymann, R. J., Stern, D., Bunker, A., Spinrad, H., Chaffee, F. H., Thompson, R. I., & Storrie–Lombardi, L. J. 1998, ApJ, 505, L95
- Williams et al. (1996) Williams, R. E., et al. 1996, AJ, 112, 1335


| Component | Peak Amplitude | FWHM | †† Displacement velocity relative to the central, narrow emission component. Positive velocity is a redshift; negative velocity is a blueshift. | |
|---|---|---|---|---|
| (Å) | ( ergs s-1 cm-2 Å-1) | (Å / km s-1) | (km s-1) | |
| Narrow Component | 7527 | 3.16 | 7 / 280 | |
| Broad Component | 7535 | 0.62 | 14 / 560 | 320 |
| Absorption Component | 7518 | 20 / 800 |
| Band | Magnitude |
|---|---|
| (Vega–based, 15 aperture) | |
| †† limiting magnitude. | |
| †† limiting magnitude. | |
| ‡‡Add magnitudes to this Vega–based magnitude for comparison to the AB isophotal magnitude cited in § 2. | |
| †† limiting magnitude. |