On the association of G343.1-2.3 and PSR 1706-44
Abstract
The association of G343.1-2.3 and PSR 1706-44 has been controversial from its first proposal. In this paper we address the difficulties, and argue that the association is still likely. New evidence comes from images of G343.1-2.3 obtained using the Australia Telescope Compact Array (ATCA), and the pulsar obtained using the CHANDRA X-ray observatory. Mosaicing was required to cover the full extent of G343.1-2.3, and we present the polarisation images from this experiment. Also an X-ray pulsar wind nebula has been found in the archived CHANDRA observations, with the correct morphology to support the association. The ATCA observations confirm the much larger extent of the SNR, which now encompasses the pulsar. The X-ray morphology points back toward the centre of the SNR, indicating the direction of the proper motion, and that the PSR and SNR are associated.
keywords:
pulsars: individual B1706-44 supernova remnants: individual G323.1-2.3 radio continuum: general X-rays: individual:1 Introduction
The pulsar PSR B1706-44 is one of only seven that are known to emit gamma-rays in the GeV energy range (Thompson et al., 1992) and one of only three that have been detected in the TeV range (Kifune et al., 1995; Chadwick et al., 1998). Becker et al. (1995) reported that the power law spectrum from the compact source at the site of the pulsar was best explained by synchrotron origin, presumably a nebula around the pulsar. Finley et al. (1998) found that PSR B1706-44 is surrounded by a compact X-ray nebula of radius pc using ASCA data. This is also true of the other two TeV emitters, the Crab and Vela pulsars. The TeV gamma-rays, which appear to be unpulsed, can be explained as resulting from the Inverse Compton interaction of the high energy electrons, which produce the X-ray synchrotron emission, with ambient photons (Aharonian et al., 1997).
The original discovery that the COS-B gamma-ray source was a pulsar was made by Johnston et al. (1992). The spin down luminosity is high, ergs, as would be expected. McAdam et al. (1993) published a map made by the MOST telescope at 843 MHz of the area around the gamma-ray source. It showed a semicircular arc of emission, which has subsequently been denoted as the supernova remnant (SNR) G343.1-2.3, with the pulsar seemingly embedded in a small feature at its south eastern extremity. It was argued that the approximate distance of 3 kpc for the remnant, derived from the surface brightness-diameter relationship (-D) was compatible with the pulsar’s dispersion measure, although the distance indicated by the widely used interstellar electron density model of Taylor & Cordes (1993) would be only 1.8 kpc. The -D relationship was based on the flux density values from single dish observations, as both the VLA and the MOST integrated flux fell short of what would be expected, implying that the broad structure was being resolved (McAdam et al., 1993).
If the association of the pulsar and the supernova remnant is real, a transverse velocity of kms-1 is required for the pulsar to have moved from the approximate geometric centre of the SNR arc in the characteristic spin down time of 17 kyr. This is high, but not the highest measured value for a pulsar, nor as high as that implied for some seemingly well-established pulsar-SNR associations (Manchester et al., 1991; Frail & Kulkarni, 1991).
Frail et al. (1994) imaged the area around the pulsar at 20 cm and 90 cm with the VLA and cast doubt on its association with G343.1-2.3. These arguments were based on the morphology, and the fact that the dispersion measure (DM) and -D distance were discrepant. The latter was subsequently countered by a 21 cm hydrogen line absorption measurement of the pulsar by Koribalski et al. (1995) which gives a distance range of 2.4 to 3.2 kpc. Most recently the region has been imaged in more detail by Giacani et al. (2001) at 20, 6 and 3.6 cm and they concurred with Frail et al. (1994) description of a nebula size of .
Nicastro et al. (1996) also argue against the association. They report a maximum value of only 27 kms-1 for the magnitude of the transverse velocity of the pulsar calculated from the interstellar scintillation. However in their later paper (Johnston et al., 1998), this estimate was revised up to 100 kms-1. The possibility of a direct determination of the proper motion of PSR B1706-44 has been investigated, but no phase reference sufficiently strong for the current Australian VLBI network (the LBA) could be found.
We have made a number of high sensitivity, low surface brightness images of the remnant to determine its full extent. Furthermore we have used CHANDRA archived data to search for a pulsar wind nebula (PWN) to provide evidence for the pulsar interaction with the interstellar medium (ISM).
2 Results from the Compact Array
The Australia Telescope Compact Array has been used to re-observe G343.1-2.3, with a nineteen pointing mosaic. Mosaicing was required both to cover the extent of the source and also to assist in the recovery of the flux on the shortest uv spacings, which were missed in the MOST and the VLA observations. Primary calibration was against PKS1934-638 which has an integrated flux of 16.4 Jy at 1.384 GHz. The mean observing epoch was September 1998. Deconvolution used the mosaic version of the standard MIRIAD maximum entropy methods for polarised images; PMOSMEM. The RMS noise in the final total intensity image is 0.6 mJy.
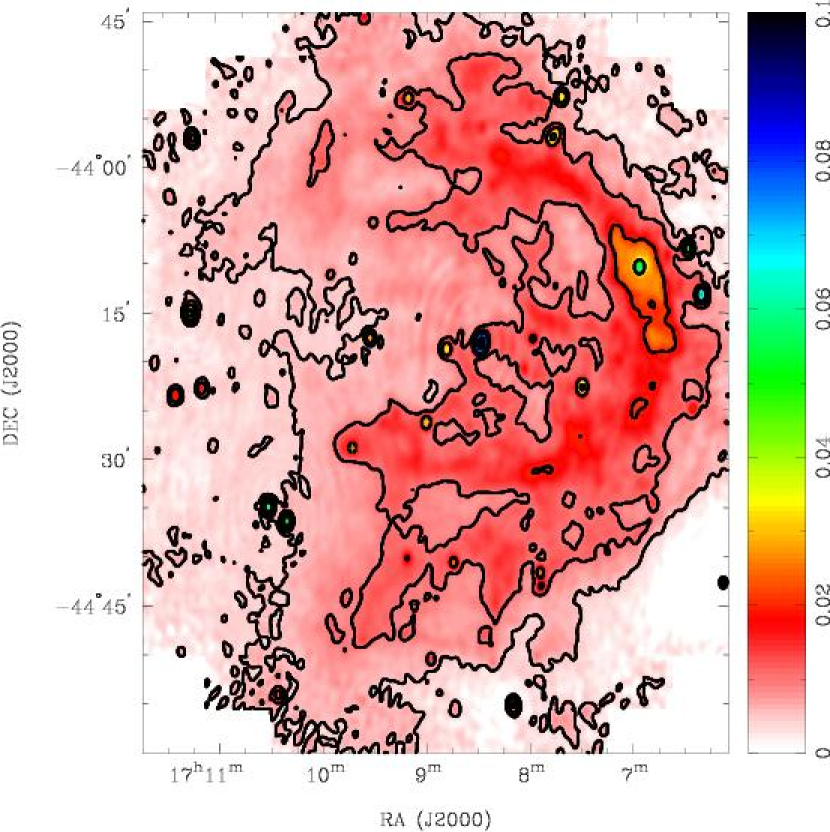
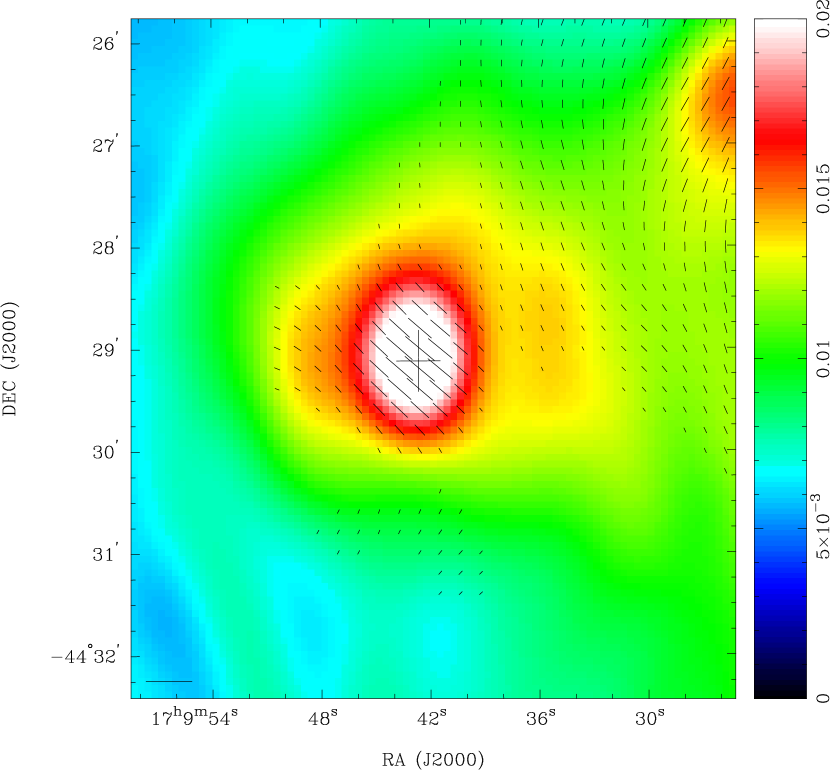
Figure 1 shows the total intensity images of the whole remnant (Figure 1 a) and of the region around the PSR (Figure 1 b). The pulsar region is overlaid with the polarisation vectors. The full image is very similar to those from MOST (McAdam et al., 1993), and indeed has very similar resolution () (the longer baselines, to the 6km antenna, were not used due to the uv poor coverage). We have included as a constraint in the deconvolution the observed total flux for the SNR, 30 Jy, observed with the University of Tasmania’s 26m antenna.
When the total flux from single dish measurements is included, the images obtained are in agreement with the other observations, i.e. the extent agrees with the very low frequency images from the VLA (Frail et al., 1994) and MRT (Dodson, 1997; Golap, 1998), and the spectral index has a simple monotonic spectrum of -0.5 (Dodson et al., 1999).
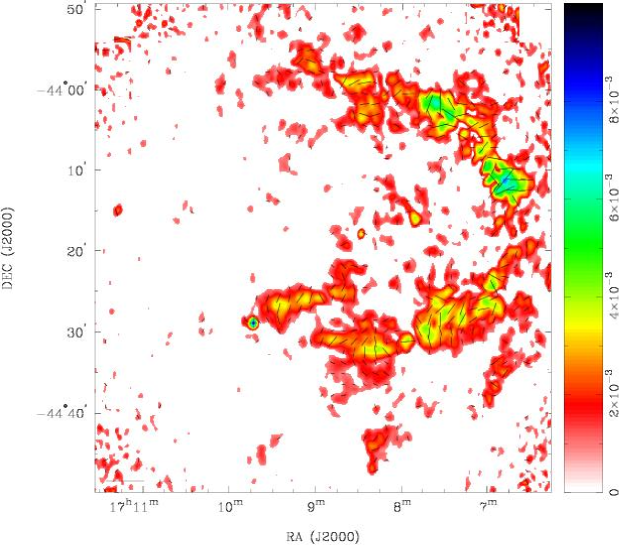
Figure 2 shows the polarisation angle overlaid on the polarised intensity. The polarised fraction is typically about 20 percent with a randomly orientated polarisation angle which changes rapidly around the bright ring. Wisps of polarised emission can be seen to extend beyond the originally defined ring, and throughout the region with broadscale emission. This confirms that the broadscale emission is associated with the synchrotron emission from the SNR.
The pulsar is a point source with a flux density of 10 mJy, in line with that found in the scintillation fluctuation observations of Johnston et al. (1998), and is 70 per cent linearly polarised, and 25 per cent circularly polarised. The mean pulsar position is 17:09:42.71 -44:29:08.1 with an RMS of 0.5 arc seconds between epochs, within the errors estimates of Wang et al. (2000), but is slightly south of the VLA observations; that is -44:29:06.6.
It is instructive to compare the VLA images of Frail et al. (1994, figure 4) with the image in Figure 1 b). The pulsar lies on a spur of emission which is clearly a continuous feature covering more than . Thus it is extremely unlikely to be a cometary tail from the pulsar. Furthermore the width of the spur, , is too broad to be due to ram pressure of a moving pulsar. It is intriguing that this is approximately the size that would be expected from a static pulsar wind, derived from the Sedov equations with a continuous input of energy, and with the of PSR1706-44 (Rees & Gunn, 1974). Taking the expressions from Frail & Scharringhausen (1997), the equation of the static shock radius () is;
| (1) |
Where is the spin down energy in unit of ergs s-1, is the number density, is the age in years and is the distance in kpc. Using the standard values gives using the lower limit on the distance.
The formula for a ram pressure shock driven PWN () is;
| (2) |
or . is the velocity in units of 150 kms-1.
It is clear that the radius of the feature seen in the radio band cannot be due to the ram pressure shock unless the density is extremely low (). It is consistent with the size expected for a static PWN, with a number density of the order suggested by the analysis of the ROSAT data, i.e. 0.09 cm-3 (Dodson, 1997; Dodson et al., 1999; Becker et al., 1995). These observations are contaminated by the nearby low mass X-ray binary, LMXB 1705-44, but a best fit of a thermal spectrum to the X-ray emission from the SNR gives a distance of 3.1 kpc, and an age of 8.9 kyrs. These values are derived using the X-ray luminosity to distance model of Kassim et al. (1994). The local density based on the pulsar age is 0.09 cm-3, whilst that from the Sedov model age is 0.02 cm-3.
3 Observations with the CHANDRA X-ray telescope
We took 48 ksecs of HRC data and 17 ksecs of ACIS data from the CHANDRA X-ray observatory archive and imaged the region around the pulsar. These observations were made in August and February 2000, with roll angles 180o apart. A similar low surface brightness extended feature is clearly visible in both the HRC and the ACIS data, as first reported by Finley et al. (1998). Their ASCA observations, complicated by contamination from the bright LMXB 1705-44, saw evidence for a 14–33′′ compact nebula in the radial surface brightness. The feature as seen by CHANDRA as it is visible in both data sets, can not be due to the space craft dither, nor due to a soft proton flare or any other random and unrelated event.
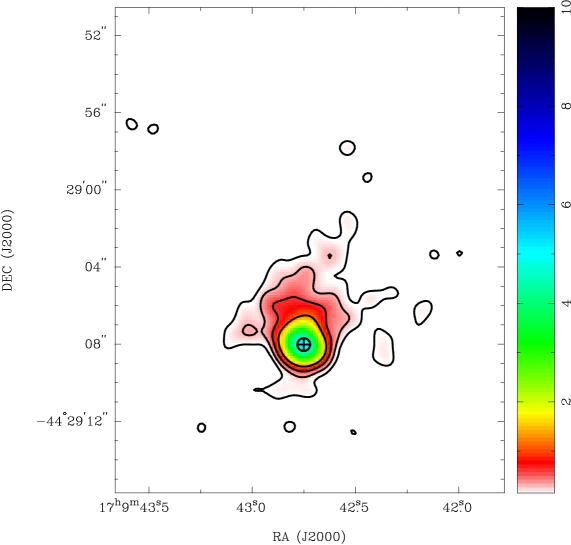
We have found the peak energy of the pulsar emission to be around 1 keV from the ACIS data, and have ‘CLEANed’ the HRC data (smoothed to 0.3′′) with the PSF for that energy. CLEAN is a standard deconvolution technique where a small fraction of the PSF is subtracted interatively from the image, until a conversion condition is met (Högbom, 1974). Our convergence criterion was satisfied when the peak emission was more than half the PSF width from the pulsar position. Significant emission (10 percent of peak) remained at this point. It was perfectly feasible to clean this feature iteratively as well, but equally good results were obtained by fitting a Gaussian model around the pulsar position. Figure 3 shows the emission after the cleaning the point source with the PSF; its position is marked with a cross. This confirms the object seen by Finley et al. (1998), but finds a two dimensional structure and a smaller extent which can be explained by the degree of contamination in the ASCA image. The object has a very compact nebula (but much greater than the PSF) around the pulsar which is best fitted by a Gaussian of about 1.1, and a more tenuous trail pointing nor-north west, and extending about 5′′ back from the pulsar. The angle of symmetry of this tail is , toward the SNR centre. The brightness of the tenuous nebula is about 10 times greater than that of the point spread function of the CHANDRA mirrors; i.e. 1 percent of the pulsar peak, whereas the PSF would be 0.1 percent. The most likely, and most natural, physical model of such a structure is a bow shock, with the more tenuous tail left behind in the wake.
The pulsar to bow shock distance at the closest approach (), at 2.4 kpc, is just 0.05 pc. If the scintillation velocity limit found by Johnston et al. (1998) is correct then the density is required to be greater than 25 cm-3, or, if the densities are those found from the ROSAT observations (Dodson, 1997; Dodson et al., 1999; Becker et al., 1995), the velocities are in the range 1000–2000 kms-1, greater than that required to move from the centre of the SNR to the current position. More typical densities imply reasonable velocities (500 kms-1 implies a density of unity). These are obviously much higher that those seen by the scintillation velocity, but we stress that this is an indirect measurement with a large intrinsic scatter, and only a VLBI observation will settle the question, for which the LBA will need to be upgraded.
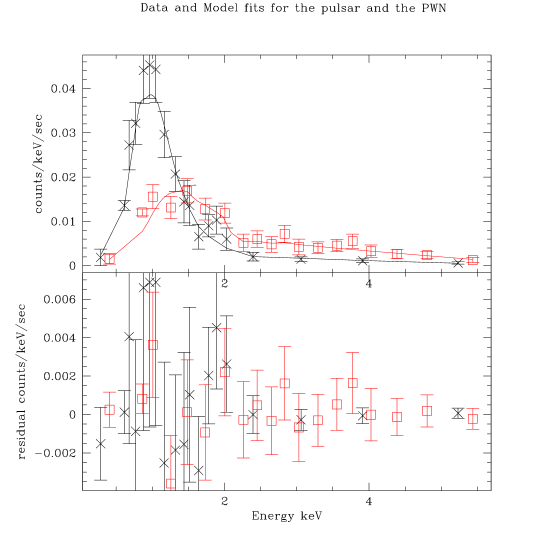
From the HRC image we cleaned out 294 counts for the pulsar before the convergence criterion was reached. The integrated X-ray flux from the compact nebula is 390 counts and the tenuous tail is 120 counts. We fitted a number of models to the ACIS data in SHERPA 2.2. The best fit to the source spectrum was found with joint fitting of the two sources; the region around the pulsar as a black body plus a power law portion and the PWN as an independent power law. These were attenuated with the usual column density absorption. The fact that the same spectrum could not be fitted to both features confirms that it is not the result of incorrectly removed spacecraft dither. The model fits for the black body can be used to calculate the diameter of the emission region from the normalisation constant (). Using the Hi distance limits gives the radius of the emitting region as – km. The unabsorbed X-ray flux gives the range of intrinsic luminosities to be 5.4–7.1 ergs s-1 from the black body (presumably the pulsar) and 7.6–9.9 ergs s-1 from the power law regions (the PWN). The fits are shown in figure 4. The reduced Chi-squared is 0.6 and a Q-statistic of 99%, implying that the errors have been underestimated. The column densities agree with those from the ROSAT observations (Becker et al., 1995).
The fitted model parameters are;
| TBB/keV | reduced | |||
|---|---|---|---|---|
| 31/53 |
The integrated X-ray flux between 0.5 and 10 keV for each component in ergs cm-2s-1 is;
| Black Body | Power Lawpsr | Power Lawpwn | |
|---|---|---|---|
| Received | |||
| Unabsorbed |
4 Conclusion
Initially the arguments against the association were based on Kaspi’s criteria (Kaspi, 1996). These can be summarised in order of ease of observability as; same position, same distance, same age, velocity reasonable and proper motion correct. It was felt that the pulsar DM distance and the SNR -D distance did not match, and the pulsar was at the edge of the SNR and had too low a velocity to have travelled from the geometric centre of the SNR. Also there was no morphological evidence to imply a velocity direction, and the scintillation velocity was too low. Since then work (Koribalski et al., 1995) has shown that the DM distance was incorrect, and our ATCA observations have found that the extent of the SNR has been underestimated. The Chandra data shows a morphological signature best interpreted as the path of the pulsar. The proper motion of the pulsar is the remaining question, and work is under way to attempt to answer that.
It is clear from both the low total flux values found by the MOST and VLA maps that there is a smooth broad component to this SNR. The ATCA observations confirm the extent of the broad emission, and that this is non-thermal in character. Taking this smooth component as the true limits of the SNR enlarges the extent and moves it southwards. This places the pulsar PSR1706-44 within the SNR shell, rather than on the rim, thus satisfying Kaspi’s first criteria.
The X-ray PWN observed by CHANDRA is consistent with the pulsar travelling from the general direction of the SNR centre, with either a very slow velocity (which would agree with the scintillation results) or a low local density (in agreement with the ROSAT results).
We expect a SNR to be associated with PSR1706-44 because of its youth. The association with G343.1-2.3 was rejected in the past, but we have shown that the grounds for the rejection are not compelling. The question of the pulsar velocity could be resolved by finding a phase reference for VLBI observation, with either the SKA or an upgrade to the current LBA. We will be able to rule out the upper velocity limits with the ATCA within the next few years but will not be able to measure the lower limits for a few decades.
Finally the result stresses the importance of improving the ROSAT observations of this SNR with a mosaic over the whole area of the radio emission using either CHANDRA or XMM.
5 acknowledgments
During the writing of this paper K.R. Anantharamaiah of the RRI passed away. Both of us trained as astronomers there, and wish to acknowledge his friendly encouragement and interest that persuaded us that radio astronomy is a rewarding and exciting field.
Also we wish to thank B. Gaensler for discussion of the spectral fits.
The X-ray data for the Chandra observations were downloaded from the public access site, the Chandra Data Archive (CDA). This is part of the Chandra X-Ray Observatory Science Center (CXC) which is operated for NASA by the Smithsonian Astrophysical Observatory. The Australia Telescope Compact Array, funded by the Commonwealth of Australia for operation as a National Facility, is managed by CSIRO. This research made use of NASA’s Astrophysical Data System Abstract Service.
References
- Aharonian et al. (1997) Aharonian F. A., Atoyan A. M., Kifune T., 1997, Mon. Not. R. astr. Soc., 291, 162
- Becker et al. (1995) Becker W., Brazier K. T. S., Truemper J., 1995, Astron. Astrophys., 298, 528
- Chadwick et al. (1998) Chadwick P., Dickinson M., Dipper N., Holder J., Kendall T., McComb T., Orford K., Osborne J., Rayner S., Roberts I., Shaw S., Turver K., 1998, Astroparticle Physics, 9, 131
- Dodson (1997) Dodson R., 1997, PhD thesis, Durham University
- Dodson et al. (1999) Dodson R., Golap K., Udaya Shankar N., Osborne J. L., 1999, in The Universe at low frequencies. IAU Colloquium 199 The extent of the supernova remnant G343.1-2.3
- Finley et al. (1998) Finley J. P., Srinivasan R., Saito Y., Hiriyama M., Kamae T., Yoshida K., 1998, Astrophys. J., 493, 884
- Frail et al. (1994) Frail D., Goss W., Whiteoak J., 1994, Astrophys. J., 437, 781
- Frail & Kulkarni (1991) Frail D., Kulkarni S., 1991, Nature, 352, 785
- Frail & Scharringhausen (1997) Frail D., Scharringhausen B., 1997, Astrophys. J., 480, 364
- Giacani et al. (2001) Giacani E., D.A. F., Goss W., Vieytes M., 2001, aj
- Golap (1998) Golap K., 1998, PhD thesis, University of Mauritius
- Högbom (1974) Högbom J. A., 1974, aas, 15, 417+
- Johnston et al. (1992) Johnston S., Lyne A. G., Manchester R. N., Kniffen D. A., D’Amico N., Lim J., Ashworth M., 1992, Mon. Not. R. astr. Soc., 255, 401
- Johnston et al. (1998) Johnston S., Nicastro L., Koribalski B., 1998, Mon. Not. R. astr. Soc., 297, 108
- Kaspi (1996) Kaspi V., 1996, in Johnston S., Bailes M., Walker M., eds, Pulsars: Problems and Progress,IAU Colloquium 160 Pulsar/SNR associations. Astronomical Society of the Pacific, p. 375
- Kassim et al. (1994) Kassim N., Hertz P., Schuyler D., Weiler K., 1994, Astrophys. J. Letters, 427, L95
- Kifune et al. (1995) Kifune T., Tanimori T., Ogio S., Tamura T., Fujii H., Fujimoto M., Hara T., et al 1995, Astrophys. J. Letters, 438, L91
- Koribalski et al. (1995) Koribalski B., Johnston S., Weisberg J., Wilson W., 1995, Astrophys. J., 441, 756
- McAdam et al. (1993) McAdam W., Osborne J., Parkinson M., 1993, Nature, 361, 516
- Manchester et al. (1991) Manchester R., Kaspi V., Johnston S., Lyne A., D’Amico N., 1991, Mon. Not. R. astr. Soc., 253, 7P
- Nicastro et al. (1996) Nicastro L., Johnston S., Koribalski B., 1996, Astron. Astrophys. Letters, 306, L49
- Rees & Gunn (1974) Rees M., Gunn J., 1974, Mon. Not. R. astr. Soc., 167, 1
- Taylor & Cordes (1993) Taylor J., Cordes J., 1993, Astrophys. J., 411, 674
- Thompson et al. (1992) Thompson D. J., Arzoumanian Z., Bertsch D. L., Brazier K. T. S., D’Amico N., Fichtel C. E., Fierro J. M., Hartman R. C., Hunter S. D., Johnston S., 1992, Nature, 359, 615
- Wang et al. (2000) Wang N., Manchester R. N., Pace R. T., Bailes M., Kaspi V. M., Stappers B. W., Lyne A. G., 2000, Mon. Not. R. astr. Soc., 317, 843