Gigahertz-Peaked Spectrum Radio Sources in Nearby Galaxies
Abstract
There is now strong evidence that many LLAGNs contain accreting massive black holes and that the nuclear radio emission is dominated by parsec-scale jets launched by these black holes. Here, we present preliminary results on the 1.4 GHz to 667 GHz spectral shape of a well-defined sample of 16 LLAGNs. The LLAGNs have a falling spectrum at high GHz frequencies. Several also show a low-frequency turnover with a peak in the 1-20 GHz range. The results provide further support for jet dominance of the core radio emission. The LLAGNs show intriguing similarities with gigahertz-peaked spectrum (GPS) sources.
Arcetri Observatory, Largo E. Fermi 5, 50125 Firenze, Italy
University of Maryland, College Park, MD 20742, USA
Max-Planck-Institut für Radioastronomie, Auf dem Hügel 69, 53121 Bonn, Germany
National Radio Astronomy Observatory, P.O. Box 0, Socorro, NM 87801, USA
Liverpool John Moores University, Twelve Quays House, Egerton Wharf, Birkenhead, Merseyside CH41 1LD, UK
1. Introduction
Low luminosity active galactic nuclei (LLAGNs), operationally defined as AGNs with nuclear H luminosity 1040 erg s-1, make up almost 50% of all nearby bright galaxies (e.g., Ho, Filippenko, & Sargent 1997a). They are spectroscopically sub-classified into Low Ionization Nuclear Emission Region nuclei (LINERs), low luminosity Seyferts, and “transition nuclei”, whose spectra are intermediate between Seyfert/LINER and HII region spectra.
Evidence has been accumulating that some fraction of LLAGNs share characteristics in common with more powerful AGNs. These similarities include the presence of nuclear compact radio cores (Heckman 1980), water vapor megamasers (Braatz et al. 1997), nuclear point-like UV sources (Maoz et al. 1995; Barth et al. 1998), broad H lines (Ho et al. 1997b), and broader H lines in polarized emission than in total emission (Barth et al. 1999). If LLAGNs are truly scaled down AGNs then the challenge is to explain their much lower accretion luminosities. This requires either very low accretion rates (10LEdd; e.g. Falcke & Biermann 1999) or radiative efficiencies (the ratio of radiated energy to accreted mass) much lower than the typical value of 10% (e.g. Chapter 7.8 of Frank, King, & Raine 1995) assumed for powerful AGNs.
Our radio surveys of the 96 nearest LLAGNs from the Palomar spectroscopic survey (Ho et al. 1997a) have found compact (150 mas) flat-spectrum radio cores in almost half of all LINERs and low-luminosity Seyferts (Nagar et al. 2000; 2002). Follow-up observations detected parsec-scale radio cores in all (16) LLAGNs with S 2.7 mJy, implying brightness temperatures 108 K (Falcke et al. 2000; Nagar et al. 2002). The five nuclei with the highest core fluxes - NGC 3031 (Bietenholz, Bartel, & Rupen 2000), NGC 4278 (Jones, Wrobel, & Shaffer 1984; Falcke et al. 2000), NGC 4486 (M 87; Junor & Biretta 1995), NGC 4374 (M 84; Wrobel, Walker, & Bridle 1996; Nagar et al. 2002), and NGC 4552 (M 89; Nagar et al. 2002) - all have pc-scale radio extensions, morphologically reminiscent of jets (e.g. Fig. 1). The high brightness-temperatures rule out an origin for the radio emission in star-formation processes. Thermal emission can also be ruled out as it would imply two to four orders of magnitude higher soft X-ray fluxes than seen in LLAGNs (see Falcke et al. 2000).
We are currently working on a high-resolution multifrequency radio study of all 16 LLAGNs at D 19 Mpc with confirmed pc-scale radio cores. Results on the 5 GHz to 15 GHz radio spectra are published in Nagar, Wilson, & Falcke (2001). Here, for the first time, we present preliminary results on the 1.4 GHz to 667 GHz spectral shape.


2. Observations
All sixteen nuclei have been observed simultaneously at 5 GHz, 8.4 GHz, and 15 GHz with the VLA in September 1999, while the VLA was in A-array (results in Nagar et al. 2001). All nuclei were again observed at 8.4 GHz and 43 GHz in December 2000 with the VLA A-array, and the brightest eight nuclei were also observed at 22 GHz at this time. The repeat 8.4 GHz observations were used to scale the flux measurements at 22 GHz and 43 GHz to the previous 5–15 GHz data; this, of course, assumes that the 5–43 GHz spectral shape did not change between the two epochs. We also observed eleven of the sixteen nuclei with MERLIN at 1.6 GHz (01 resolution) in December 1999. Thirteen of the 16 nuclei have been previously observed at 1.4 GHz (at 5′′ resolution) as part of the FIRST VLA radio survey (White et al. 1997) during various observing runs between 1997 and 1999. Finally, we observed four of the sixteen nuclei at 353 GHz (850 m) and 667 GHz (450 m) with JCMT/SCUBA in January 2001. Observations of 6 more nuclei with SCUBA are pending.
For the 5 GHz, 8.4 GHz, and 15 GHz data, we were able to make matched 05 resolution maps. At 22 GHz and 43 GHz the much higher resolution (008 and 005, respectively) and lower signal to noise, did not allow good maps to be made at 05 resolution, and so we use the full resolution data in these cases. The radio cores are essentially point sources at 22 GHz and 43 GHz, so it is unlikely that tapered maps will pick up a significant amount of more extended emission. At this stage our reduction of the MERLIN data are preliminary so we rely mainly on the 5′′ resolution, 1.4 GHz fluxes from the FIRST survey. The SCUBA data have a resolution of 7′′ at 667 GHz and 13′′ at 353 GHz. At these lower resolutions contamination from dust is likely.
3. Results
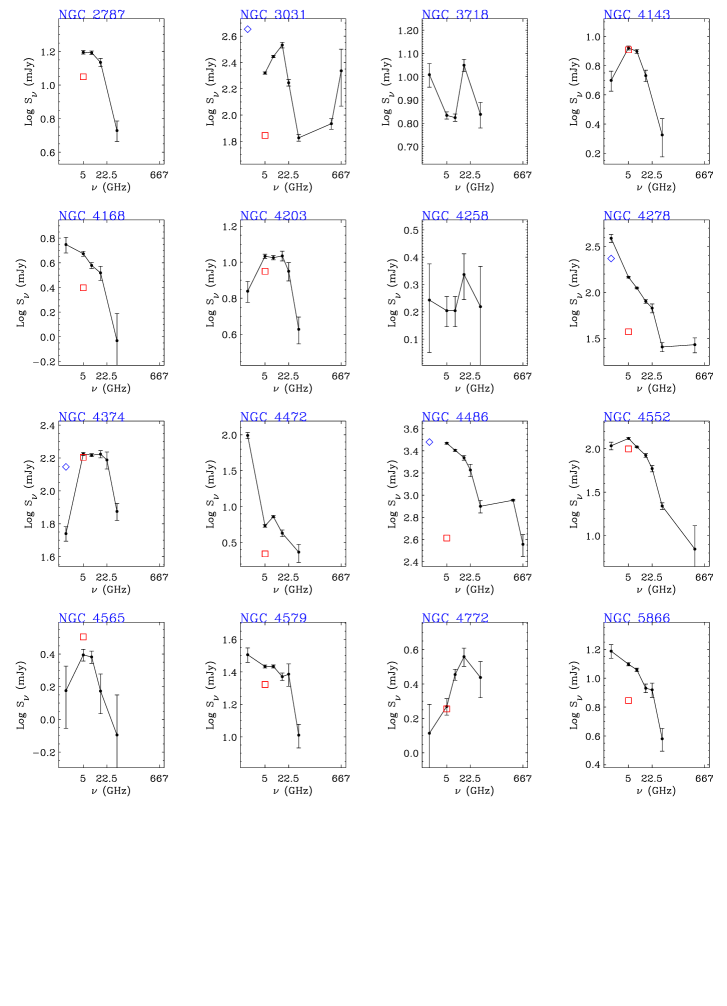
Radio spectra of the sixteen nuclei are shown in Fig. 2. The 1.4 GHz data is from the 5′′ resolution FIRST data, and if a 01 resolution MERLIN (preliminary) flux exists, it is shown by the diamond at 1.6 GHz. Given the higher resolution of MERLIN we would expect its flux measurement to be lower than that of FIRST, unless there is significant variability. The presence of some higher than expected MERLIN fluxes is a matter of concern and we are looking more closely into the mapping and flux calibration of these data. The arcsec-scale spectra in Fig. 2 probably closely track that of the mas-scale radio emission given that the peak flux-density in the 05 resolution, 6 cm VLA maps is 40%–100% of the total flux seen in the (non-simultaneous) 2.5 mas resolution, 6 cm VLBA maps (the rectangular symbol at 5 GHz). Also, the radio cores show similar fluxes in 8.4 GHz and 15 GHz maps made at the highest resolution (03 and 015, respectively) as in maps tapered to 05 resolution (Nagar et al. 2001). Finally, the high-resolution 22 GHz and 43 GHz maps show only an unresolved core with no evidence of extended structure.
Overall the spectra show a steep fall at the high GHz frequencies. The single exception, NGC 3031, is a nearby bright spiral with significant nuclear dust; dust emission can explain the upturn in its sub-mm spectrum. Several nuclei show signs of a spectral peak in the range 1.4–20 GHz, similar to that found for a few ellipticals by Di Matteo et al. (2001). This low frequency turnover is more believable since the 1.4 GHz data have lower resolution than the 5 GHz–43 GHz data. The spectral index above the “peak” is 0.4 to 1.4 (median 0.8), and the spectral index below the “peak” is 0.8 to 0.4 (median 0).
4. Discussion
First, we list the main caveats: (a) as explained above the 5–15 GHz and the 22–43 GHz data have been normalized by the repeat 8.4 GHz observations. This assumes that the 5–43 GHz spectral shape did not change between the two epochs; (b) the 1.4 GHz, 1.6 GHz, and the 353-667 GHz data are non-simultaneous with the other data; (c) the resolution varies between 005 for the 43 GHz data and 13′′ for the JCMT/SCUBA data. However, as discussed above, the radio cores are highly compact until mas-scales, so resolution effects should not cause significant bias at 50 mas resolutions.
Despite these caveats, several deductions can be made from the results. First, let us restrict ourselves to scenarios in which the radio core is highly compact, e.g. advection dominated (ADAF) or convection (CDAF) dominated accretion flows (Narayan, Igumenshchev, & Abramowicz 2000). In these models, the radio emission is posited to come from the inner 102-103 Schwarzschild radii, i.e. highly sub-parsec for the black hole masses considered here. Thus, the radio fluxes we measure at all of our frequencies represent upper limits to the radio emission from such models. In fact in cases like this, it is not relevant to determine spectral indices from matched resolution radio maps; all that accomplishes is a deterioration of the few high resolution datapoints. We see no evidence of a moderately to highly inverted radio spectrum, as predicted by most ADAF and CDAF models (e.g. Quataert & Narayan 1999; Di Matteo et al. 2001; summarized in Nagar et al. 2001). This tells us that even if such accretion flows exist, the sub-arcsecond radio emission upto 43 GHz (possibly all the way to 667 GHz) is dominated by other components.
On the other hand there is significant evidence for jets dominating the sub-arcsec radio emission in LLAGNs. The 5 nuclei with the highest core mas-scale fluxes all show extended emission, reminiscent of parsec-scale jets (see Section 1). In the three best studied nuclei - M 87, NGC 3031, and NGC 4258 - the ‘jet’ dominates the ‘core’ radio emission (see Nagar et al. 2001 for a discussion of this). The radio spectral shape is also consistent with jet models: the high frequency spectral shape is consistent with optically-thin synchrotron emission, and the low frequency turnover could be caused by synchrotron self-absorption or by free-free absorption.
It is suggestive that the LLAGNs in Fig. 2 show several properties
in common with gigahertz-peaked spectrum sources (GPSs; see O’Dea 1998
for a review):
(a) there is some evidence for a peak in the 1–20 GHz range;
(b) milli-arcsec imaging often shows a ’core-jet’ or symmetric parsec-scale
jets;
(c) LLAGNs in Fig. 2 have sub-pc scale radio jet extents and spectral peaks
in the 5-10 GHz range. They thus extend to higher frequencies the
relationship between linear
size and turnover frequency in GPSs and Compact Steep Spectrum Sources
(CSSs; see O’Dea et al. 1998).
(d) LLAGNs have a low X-ray luminosity (e.g. Ho et al. 2001), similar to
the case of GPS galaxies.
In GPS sources, the radio emission is posited to come from the expanding
lobes of the pc-scale radio jets. The low frequency turnover is deduced to
be the result of synchrotron self-absorption or free-free absorption.
References
Barth, A. J., Filippenko, A. V., & Moran, E. C. 1999, ApJ, 525, 673
Barth, A. J., Ho, L. C., Filippenko, A. V., & Sargent, W. L. W. 1998, ApJ, 496, 133
Bietenholz, M. F., Bartel, N., & Rupen, M. P. 2000, ApJ, 532, 895
Braatz, J., Wilson, A. S., & Henkel, C. 1997, ApJS, 110, 321
Di Matteo, T., Carilli, C. L., & Fabian, A. C. 2001, ApJ, 547, 731
Falcke, H. & Biermann, P. L. 1999, A&A, 342, 49
Falcke, H., Nagar, N. M., Wilson, A. S., & Ulvestad, J. S. 2000, ApJ, 542, 197
Frank, J., King, A., & Raine, D. 1995, in Accretion Power in Astrophysics, 2nd edition, (Cambridge: Cambridge Univ. Press)
Heckman, T. M. 1980, A&A, 87, 152
Ho, L. C., Filippenko, A. V., & Sargent, W. L. W. 1997a, ApJS, 112, 315 (H97a)
Ho, L. C., Filippenko, A. V., Sargent, W. L. W., & Peng, C. Y. 1997b, ApJS, 112, 391
Jones, D. L., Wrobel, J. M., & Shaffer, D. B. 1984, ApJ, 276, 480
Junor, W., & Biretta, J. A. 1995, AJ, 109, 500
Maoz, D., Filippenko, A. V., Ho, L. C., Rix, H.-W., Bahcall, J. N., Schneider, D. P., & Macchetto, F. D. 1995, ApJ, 440, 91
Nagar, N. M., Wilson, A. S., & Falcke, H. 2001, ApJ, 559, 87
Nagar, N. M., et al. 2002, in preparation; will appear in A&A
Narayan, R., Igumenshchev, I. V., & Abramowicz, M. A. 2000, ApJ, 539, 798
O’Dea, C. P. 1998, PASP, 110, 493
Quataert, E., & Narayan, R. 1999, ApJ, 520, 298
White, R. L., Becker, R. H., Helfand, D. J., & Gregg, M. D. 1997, ApJ, 475, 479
Wrobel, J. M., Walker, R. C., & Bridle, A. H. 1996, in Extragalactic radio sources: proc. of the 175th Symposium of the IAU, ed. R. D. Ekers, C. Fanti, & L. Padrielli (Kluwer Academic Publishers), 131