Secular Evolution in Barred Galaxies: Observations
Abstract
This paper describes a framework for studying galaxy morphology, particularly bar strength, in a quantitative manner, and presents applications of this approach that reveal observational evidence for secular evolution in bar morphology. The distribution of bar strength in galaxies is quite strongly bimodal, suggesting that barred and unbarred systems are distinct entities, and that any evolution between these two states must occur on a relatively rapid timescale. Bars’ strengths appear to be correlated with their pattern speeds, implying that these structures weaken as they start to slow, and disappear entirely before the bars have slowed significantly. There is also tantalizing evidence that bars are rare beyond a redshift of , indicating that galaxies have only recently evolved to a point where bars can readily form.
School of Physics & Astronomy, University of Nottingham, Nottingham NG7 2RD, UK
1. Introduction
I had originally intended to give an overview of the observational evidence relating to the mechanisms by which bars evolve over time. However, this overview has been expertly provided by a number of other authors in these proceedings. Bureau (2002), for example, gives a thorough treatment of the buckling of bars to form boxy bulges, and how this may lead to their dissolution. Similarly, Das et al. (2002) discuss the role that central mass concentrations, such as massive black holes, may play in weakening and ultimately destroying bars. Debattista (2002) describes the way that bars might be expected to slow down through dynamical friction, while Gerssen (2002) presents the observational evidence that not much slowing has occurred. This apparent contradiction suggests that the mass distribution in barred galaxies cannot be very centrally concentrated, or that some other mechanism destroys the bars before they have had the opportunity to slow down. Finally, Athanassoula (2002), through her sophisticated N-body simulations, discusses much of the theory behind these observations. This wide sweep of articles leaves me very little to say by way of background review.
I will therefore limit this paper to discussing how these observations, and the accompanying theory, might be brought together in a common quantitative framework, and to presenting a couple of preliminary applications of this procedure. Section 2. discusses the quantification of bar strength, and how it can be combined with other quantitative measures of morphology to define a parameter space directly analogous to that used in the previous qualitative classification of Hubble’s tuning fork. Section 3. describes an application of this parameterization in studying the evolution of bar pattern speeds, and Section 4. looks at direct evidence for bar evolution in the Hubble Deep Fields. Finally, Section 5. speculates on the next steps in this field.
2. Quantifying Bar Strength and Morphology
Historically, morphological features such as the presence or absence of a bar in a galaxy have been assessed qualitatively by inspection of photographic plates [e.g. Sandage & Tammann 1981 (RSA), de Vaucouleurs et al. 1991 (RC3)]. Although this approach has a strong romantic appeal, it has a number of shortcomings in modern studies of galaxy morphology. First, such human inspection unavoidably has a subjective element, which makes comparison between different analyses rather difficult. Second, projects such as the Sloan Digital Sky Survey are now becoming so large that it is not practical to inspect each galaxy image individually. Third, such classifications do not make full use of the quantitative data that is now available from CCD images. Although this under-utilization may not matter when classifying high-quality images of nearby galaxies, it becomes vital when analyzing small noisy images of very distant galaxies, where every photon counts. Finally, an objective quantitative measure of a property such as bar strength is vital if one wishes to correlate galaxies’ “barriness” with their other properties to seek insight into the way that bars form and evolve.
A number of methods have been advocated for measuring bar strength in a quantitative manner. The simplest involves just fitting isophotes to a galaxy at different radii (e.g. Martin 1995). The intrinsic shape of the galaxy’s isophotes can then be measured by deprojecting it to face on. This deprojection requires that one assume that the galaxy can be treated as a thin disk, and that its inclination can be estimated from the apparent shape of its outer isophotes, which are taken to be intrinsically round. A more robust variant on this technique (Abraham et al. 1999) involves measuring the apparent ellipticity as a function of radius by calculating the second moments of the light distribution as a function of surface brightness threshold. Whichever approach is used, some measure of the bar flattening, such as its intrinsic ellipticity or axis ratio, then provides the measure of bar strength. A more physically-motivated approach has been advocated by Block et al. (2002), who seek to measure the gravitational influence of a galaxy’s non-axisymmetric component relative to the axisymmetric forces. Each of these measures is optimized for different purposes: for example, the moment-based technique is designed to deal with faint distant galaxies where the signal-to-noise ratio is low, whereas the gravitational force method is intended to tie the observations as closely as possible to the underlying physics where higher quality data exist. All the methods have to make some assumption about the shapes of the galaxies surveyed in order to derive their three-dimensional properties from two-dimensional images. In many cases, these assumptions will be violated – treating a galaxy as a thin disk when it contains a significant bulge component is clearly incorrect. However, even where the assumptions are invalid, the technique will still provide a measure of barriness. As long as the measure is compared to the same quantity derived from other samples that have been treated in the same way, one can still draw meaningful conclusions from any differences between the statistics from the various samples.
It seems very likely that bars cannot be fully described by any such single parameter – for example, is a small highly-distorted central isophote a stronger or weaker bar than a much larger slightly-distorted central feature? Ultimately, one probably needs at least two parameters to capture the essence of a bar, one describing the degree to which it distorts the galaxy’s isophotes, while the other specifies the fraction of the galaxy’s light that lies in the bar. However, even a single parameter does provide an objective and repeatable measure of barriness which for the first time allows a quantitative discussion of bar properties.
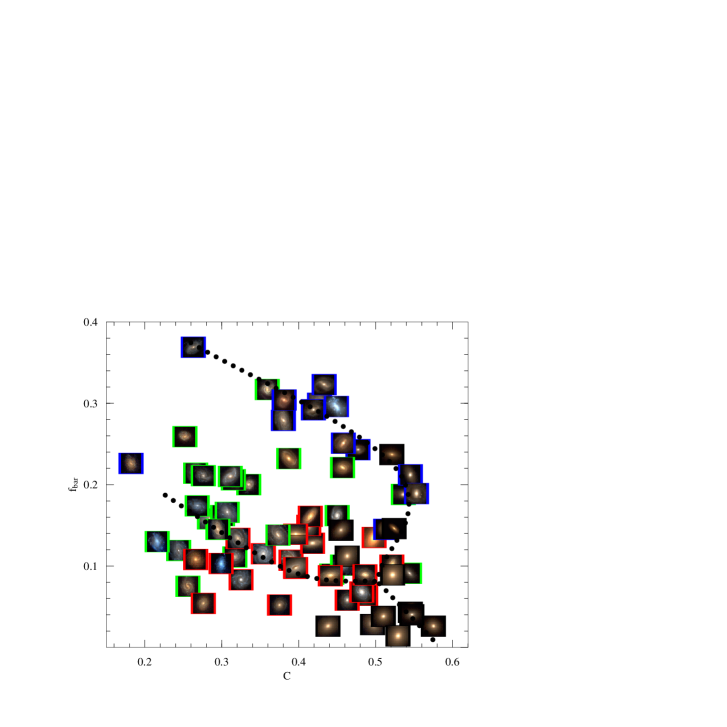
One simple use of such a measure of bar strength has been in an investigation of whether Hubble’s (1936) tuning fork classification of galaxies represents a physical phenomenon, or whether it is just an aesthetic idealization. Hubble’s scheme arranges the galaxies from early type (big bulge, weak tightly-wound spiral structure) to late type (small bulge, strong open spiral structure) along a horizontal axis, bifurcating vertically into barred and unbarred galaxies. Thus, it can be thought of as a two-dimensional parameter space, with a measure of lateness along the axis and a measure of barriness on the axis. Figure 1 shows a quantitative realization of this “Hubble Space,” where Abraham et al.’s (1994) central concentration index, , is used to measure the position of a galaxy along the Hubble sequence, and Abraham & Merrifield’s (2001) measure of bar strength, , delineates the axis. The picture is a little complicated here, partly because the high values of correspond to galaxies with large central concentrations of light, which translate into the big bulges of early-type galaxies, so the axis runs the opposite way to Hubble’s traditional early-to-late sequence. Further, the parameters are somewhat correlated: the appearance of a bar will be weakened in a galaxy with a strong central bulge, whereas even a rather small bar shows up plainly in a late-type galaxy with a weak bulge, so there is a general trend from top left to bottom right in Fig. 1. However, despite these complications, there does appear to be at least some sign of Hubble’s tuning fork in this picture, as the dotted line in the figure indicates. The barred galaxies, in particular, seem to form a remarkably tight sequence, well separated from the main group of unbarred systems. A simple statistical test suggests that the deficit of galaxies around values of , is significant at the 95% level, although such a posteriori calculations should not be over-interpreted.
If the gap between barred and unbarred galaxies is real, it has important consequences for the secular evolution of bars. It could mean that barred and unbarred galaxies are fundamentally distinct entities, with no evolution between the two types of system. However, these systems are remarkably similar in all their other properties. For example, one might have thought that the presence or absence of a bar could be related to how strongly the galaxy is dominated by dark matter, which will alter the effectiveness of the classical bar instability (Ostriker & Peebles 1973). The Tully-Fisher relation essentially plots the correlation between luminous mass as quantified by the absolute magnitude against total mass as quantified by the rotation speed, so one might expect the relation to be different for barred and unbarred galaxies. However, the mean Tully Fisher relation is identical for barred and unbarred systems (Debattista & Sellwood 2000). There is a somewhat larger scatter in the relation for barred galaxies, but this can be attributed to the difficulty in measuring the circular rotation speed of a barred galaxy where the stars and gas do not follow circular orbits (Franx & de Zeuuw 1992). Given that barred and unbarred galaxies seem otherwise identical, and that there are the various credible mechanisms mentioned in the Introduction by which bars might be destroyed, it seems unlikely that barred and unbarred galaxies are fundamentally distinct. More plausibly, the absence of “semi-barred” galaxies can be taken to show that galaxies evolve rapidly between the two extreme states – the absence of intermediate galaxies is analogous to the Hertzsprung gap in the color-magnitude diagram for stars, which represents a region through which stars evolve rapidly.
This result conflicts with the RC3 classifications, which give a large number of galaxies the “SAB” designation, indicating that they have intermediate bar strength. This conflict can be resolved by looking at where the SAB galaxies are located in Fig. 1. They are found to lie scattered around , ; thus, they are the late-type galaxies on the unbarred branch of Hubble’s tuning fork. Their values of are, indeed, intermediate between those of the unbarred and strongly barred galaxies, but this is simple because of the tilt in the tuning fork. In essence, the SAB systems are unbarred galaxies that reveal minor bar-like features at their centers; these fairly insignificant features would have been hidden in galaxies with bigger bulges.
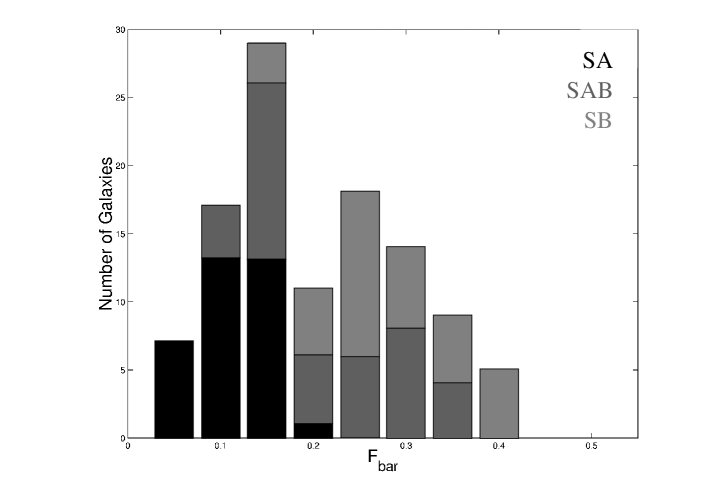
One concern with the result presented in Fig. 1 is that the morphologies have been derived from optical imaging, where dust and localized star formation might disguise the underlying galaxy morphologies (Block et al. 1999). Further, it is not clear how the galaxies in the Frei Catalog were selected. It is therefore possible that the bifurcation in Fig. 1 represents the natural tendency to pick the extremes of a continuous distribution to represent the archetypes of barred and unbarred systems. To address these concerns, Whyte et al. (2002) have analyzed H-band images from the Ohio State University Bright Spiral Galaxy Survey. These galaxies form a relatively complete sub-sample from the RC3, so should not have any bias toward artificial bimodality. Nonetheless, as Figure 2 shows, there is still a significant dip in the distribution of bar strengths at . Since this plot does not have the smearing effect of the tilt in the tuning fork taken out, the true bimodality of the distribution is likely to be even stronger. Thus, the picture remains that any evolution from barred to unbarred or vice-versa must happen on a rapid timescale compared to the ages of the galaxies.
3. Evolution in Morphology and Pattern Speed
A second application of this quantitative approach to morphology is provided by studies of bar pattern speeds. A variety of techniques have now been employed for measuring bar pattern speeds (e.g. Gerssen 2002). The results all indicate that the bar patterns are rotating at such a rate that their ends lie close to the point at which the pattern rotates as rapidly as the galaxy, the co-rotation radius . A bar can be conveniently parameterized by the co-rotation radius divided by the length of its major axis, , so the observations imply that for all galaxies, which is the smallest value possible for any self-consistent bar pattern. This result is somewhat surprising because, as described in Debattista (2002), a mechanism exists by which bars evolve to ever lower pattern speeds until they essentially grind to a halt, so one might expect to find bars with a wide range of pattern speeds and values of much greater than unity.
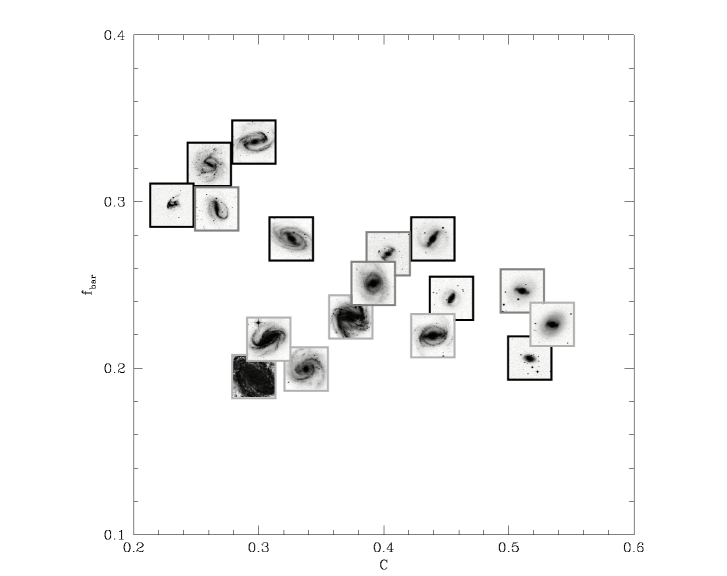
Some clue as to what is going on can be gleaned by looking at the distribution in Hubble Space of galaxies with measured bar pattern speed. As Figure 3 shows, these galaxies describe the expected fairly tight sequence which matches that already derived for barred galaxies. However, there are indications that the pattern speeds vary systematically across the width of the sequence, with somewhat slower pattern speeds being associated with weaker bars. This result would suggest that barred galaxies follow evolutionary tracks that lead them downward in this figure as their bars start to slow. The absence of any slower bars suggest that any such galaxies have entered the gap region where systems evolve rapidly via some other mechanism that destroys the bar.
Clearly, however, larger samples of bars with measured pattern speeds are required if this result is to be confirmed. It will also be highly instructive to calculate the Hubble Space parameters for the bars that form and slow down in N-body simulations (Debattista 2002) in order to follow their evolutionary tracks in this space, to see how well they match up to the observations.
4. Direct Observations of Bar Evolution
With the more robust measures of bar strength, such as the moment-based techniques, it is possible to characterize this property even in small faint galaxies, such as those imaged in the Hubble Deep Fields (HDFs). This possibility is particularly intriguing as it allows one to investigate the secular evolution of barred galaxies over a cosmological timescale by examining the properties of bars in the population as a function of redshift.
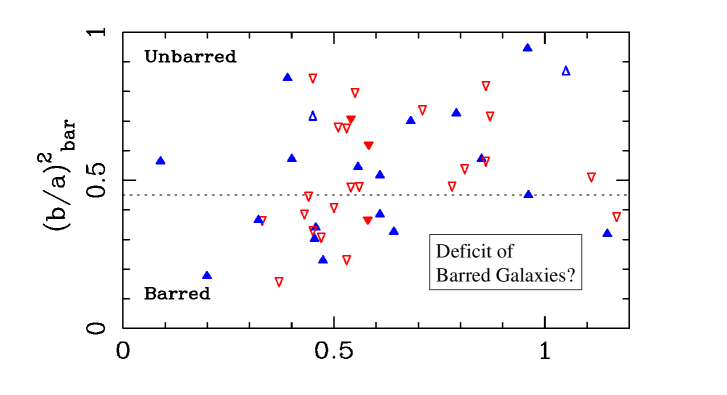
An analysis of the HDFs, summarized in Fig. 4, led Abraham et al. (1999) to conclude that there has been strong evolution in the barred galaxy population to the extent that there are almost no barred systems beyond a redshift of . This result quantified the qualitative impression that van den Bergh et al. (1996) had obtained from visual inspection of the first HDF data. This observation lends itself to the simple physical interpretation that at these early epochs disks were either too dynamically hot or too low in mass to undergo the conventional bar instability.
There are, however, several possible snags with this analysis. The first issue is bandshifting: all the data analyzed came from I-band images, but at significant redshifts the observed I-band light will have been emitted further to the blue, so one is not comparing like with like when looking at galaxies at different redshifts. However, the effects here are fairly modest: at the redshifts where there is an absence of bars, the I-band images correspond to rest-frame B-band emission. Since B-band images of nearby galaxies reveal plenty of barred systems, the absence of bars beyond cannot simply be attributed to the observations being made in waveband where bars are not detectable.
The second problem is that the more distant galaxies tend to have lower signal-to-noise ratios, which could prevent their bars being detected. One subtler effect is that cosmological dimming may reduce the surface brightness of a galaxy’s disk to an undetectable level, so a face-on barred galaxy at high redshift may be misidentified as an edge-on system. Since edge-on systems cannot have their bar strengths measured, they are excluded from the analysis, which might explain where the barred systems have gone. However, Abraham et al.’s (1999) experiments involving artificially redshifting and degrading the images of the closer galaxies showed that their bars would have remained detectable even at the highest redshifts observed, and that the disks remain bright enough for there to be no confusion over inclination.
It is still possible that barred galaxies exist at high redshifts: if, for example, these systems have much weaker disks than those in the nearby Universe, then they could have been misidentified as edge-on systems. One is, however, forced to the conclusion that if there are barred galaxies beyond , then they are sufficiently different in structure from those in the nearby Universe that they cannot be detected in the HDF data.
5. Conclusions and Future Work
With the advent of largescale CCD surveys of galaxies, both nearby and in the more distant Universe, the study of galaxy morphology has matured from the qualitative to the quantitative. Robust techniques have been developed for automatically measuring properties of galaxies such as their bulge-to-disk ratios and bar strengths. Perhaps unsurprisingly, these quantitative measures correspond quite closely to their qualitative predecessors, to the extent that one can reproduce Hubble’s tuning fork classification. The bifurcation between barred and unbarred galaxies has significant implications for investigations of secular evolution in bars, since it implies that any evolution between these two end states must occur on a timescale that is short compared to the galaxies’ cosmological lifetimes. Further evidence for evolution in bar strength on timescales that are less than the cosmological have come from studies of faint galaxies in the HDFs, which indicate that bar formation is a relatively recent phenomenon.
An important next step will be to use this framework to compare the observations with the predictions of N-body simulations. It is now possible to calculate morphological parameters to follow the properties of N-body simulations, such as those described by Athanassoula (2002), as the systems undergo secular evolution. Further, cosmological simulations like those presented by Navarro (2002) are rapidly advancing to the point where they can reliably follow the formation and evolution of individual disk galaxies, so we can also follow the variations in morphological parameters in a cosmological framework. Through such analysis, galaxy observations such as those presented here can be directly tied to N-body simulations to test our understanding of the formation and evolution of these systems, just as the observed sequences of stars in the color-magnitude diagram can be combined with stellar evolutionary tracks in order to understand how stars form and evolve.
One other area where there is still much room for analysis lies in the morphological description of bars. As described in Section 2., it seems unlikely that the essence of a bar can be captured in a single parameter, but it is by no means clear what combination of parameters does provide the optimal description, nor what the physical differences are that give rise to the range of parameters observed. A fuller description of morphological features such as bars will enable us to bring more sophistication to our exploration of the mechanisms by which these features evolve, and hopefully answer many of the outstanding questions.
References
Abraham, R.G. & Merrifield, M.R. 2000, AJ, 120, 2835
Abraham, R.G., Merrifield, M.R., Ellis, R.S., Tanvir, N.R. & Brinchmann, J. 1999, MNRAS, 308, 569
Abraham, R.G., Valdes, F., Yee, H.K.C. & van den Bergh, S. 1994, ApJ, 432, 75
Athanassoula, L. 2002, this volume
Block, D.L., Puerari, I., Frogel, J.A., Eskridge, P.B., Stockton, A. & Fuchs, B. 1999, Ap&SS, 269, 423
Block, D.L., Puerari, I., Knapen, J.H., Elmegreen, B.G., Buta, R., Stedman, S., Elmegreen, D.M. 2002, this volume
Bureau, M. 2002, this volume
Das, M., Teuben, P.J., Vogel, S.N., Regan, M.W., Sheth, K. & Harris, A. 2002, this volume
Debattista, V. 2002, this volume
Debattista, V. & Sellwood, J. 2000, ApJ, 543, 704
de Vaucouleurs, G., de Vaucouleurs, A., Corwin, H.G., Buta, R.J., Paturel, G. & Fouque, P. 1991, Third Reference Catalog of Bright Galaxies (New York: Springer-Verlag)
Elmegreen, B. 1996, in ASP Conf. Ser. Vol. 91, Barred Galaxies, ed. R. Buta, D.A. Crocker & B.G. Elmegreen (San Francisco: ASP), 197
Franx, M. & de Zeuuw, T. 1992, ApJ, 392, L47
Frei, Z., Guhathakurta, P., Gunn, J.E. & Tyson, J.A. 1996, AJ, 111, 174
Gerssen, J. 2002, this volume
Hubble, E.P. 1936, The Realm of the Nebulae (New Haven: Yale University Press)
Martin, P. 1995, AJ, 109, 2428
Navarro, J. 2002, this volume
Ostriker, J.P. & Peebles, P.J.E. 1973, ApJ, 186, 467
Sandage, A. & Tammann, G.A. 1981, Revised Shapley-Ames Catalog of Bright Galaxies (Washington: Carnegie Institute)
van den Bergh S., Abraham R.G., Ellis R.S., Tanvir N.R. & Santiago B.X. 1996, AJ, 112, 359
Whyte, L.F., Abraham, R.G., Merrifield, M.R., Eskridge, P.B. & Frogel, J.A. 2002, in preparation