Detection of a Thick Disk in the edge-on Low Surface Brightness Galaxy ESO 342–G017⋆
We report the detection of a thick disk in the edge-on, low surface brightness (LSB), late-type spiral ESO 342–G017, based on ultra-deep images in the and bands obtained with the VLT Test Camera during Science Verification on UT1. All steps in the reduction procedure are fully described, which, together with an extensive analysis of systematic and statistic uncertainties, has resulted in surface brightness photometry that is reliable for the detection of faint extended structure to a level of and mag/sq arcsec. The faint light apparent in these deep images is well-modeled by a thick exponential disk with an intrinsic scale height about 2.5 times that of the thin disk, and a comparable or somewhat larger scale length. Deprojection including the effects of inclination and convolution with the PSF allow us to estimate that the thick disk contributes 20-40% of the total (old) stellar disk luminosity of ESO 342–G017. To our knowledge, this is the first detection of a thick disk in an LSB galaxy, which are generally thought to be rather unevolved compared to higher surface brightness galaxies.
Key Words.:
galaxies: spiral, stellar content, structure⋆Based on observations collected at the European Southern Observatory, Paranal, Chile (VLT-UT1 Science Verification Program)
1 Introduction
Outside our own Galaxy, most of what we know about the structure, evolution and dynamics of stellar populations, and their connection to dark matter, is deduced from high surface brightness features: bars, bulges, and thin disks. Fainter surface brightness components such as stellar halos, thick disks, and globular clusters probe galactic potentials differently, in both time and space owing to their larger age and extent. The formation mechanisms of these faint tracers are still a matter of some controversy; suggestions range from early protogalactic collapse, secular processes such as heating from molecular clouds, black holes and spiral structure, through to later stochastic processes such as accretion (see recent reviews by Buser (2000); Bland-Hawthorn & Freeman (2000); and references therein). These scenarios predict different kinematical, morphological and chemical characteristics, but too few systems have been sufficiently well studied to constrain the models. Due to the difficulty in detecting low surface brightness features reliably in external galaxies, the important complementary information they contain has only begun to be tapped.
In the Milky Way, faint disk and halo components can be separated on the basis of their kinematics and morphology, and – to a certain extent – metallicity, because individual stars can be resolved. The Galactic stellar halo of field stars and the globular cluster systems have volume densities that decrease with galactocentric radius roughly as or (Harris & Racine (1979); Saha (1985); Zinn (1985)), similar to results for halo populations in large spirals like M31 (Racine (1991); Reitzel et al. (1998)) and NGC 4565 (Fleming et al. (1995)). Giant ellipticals and superluminous CD galaxies, on the other hand, which are thought to be the product of many mergers, have halo luminosities and globular cluster systems that fall less steeply, roughly as (Harris (1986); Bridges et al. (1991); Harris et al. (1995); Graham et al. (1996)). The total mass, the bulk of which is believed to be contained in dark matter halos, is inferred from kinematical studies to have volume densities that decline as beyond a few disk scale lengths (see Sackett (1996) for a review).
Our Galaxy also has a faint thick disk whose density falls exponentially with increasing height () above the plane as . Its scale height kpc (Reid & Majewski (1993); Ojha et al. (1996); Buser et al. (1999)) is about three times larger than that of the much brighter thin disk.
The scale length of the thick disk is kpc (Buser et al. (1999)), similar to that of the Galactic thin disk. Despite this, the thick disk contibutes only 2-9% of the total local stellar disk light (Reid & Majewski (1993); Ojha et al. (1996); Buser et al. (1999)), and perhaps 13% of the total disk luminosity of the Milky Way (Morrison et al. (1994)).
For external galaxies, morphology determined through integrated surface brightness photometry is the only current method to detect and characterize faint galactic components. Detections of extended light that are perhaps indicative of a thick disk component with kpc have been reported in a few external edge-on galaxies. Early detections of extra-planar light in excess of that associated with a thin exponential disk were limited to SO (Burstein (1979)) and early-type spirals with significant bulges (van der Kruit & Searle 1981a ; van der Kruit & Searle 1981b ; Wakamatsu & Hamabe (1984); Bahcall & Kylafis (1985); Shaw & Gilmore (1989); de Grijs & van der Kruit (1996)), Morrison et al. (1997)). leading to the supposition that thick disks were found in older stellar systems with significant central concentrations (van der Kruit & Searle 1981a ; Hamabe & Wakamatsu (1989), de Grijs & Peletier (1997)). This hypothesis is consistent with the lack of a thick luminous component around the small, Scd spiral NGC 4244 in deep -band observations reaching to mag/sq arcsec (Fry et al. (1999)), and in the bulgeless Sd edge-on NGC 7321 (Matthews et al. (1999)). On the other hand, observations indicate that there are individual exceptions. Multiband photometry of the later-type Sc spiral NGC 6504 (van Dokkum et al. (1994)) revealed extended light interpreted as a weak thick disk with kpc.
Faint light high above the plane of the well-studied, late-type, edge-on spiral NGC 5907 has further complicated the picture of extra-planar light in small- or no-bulge spirals. First detected at heights of 3 to 6 kpc above the plane in deep -band observations (Morrison et al. (1994)), this extended emission is intriguing because it is unlike any known thick disk or stellar component, having instead a morphology similar to that inferred for the dark matter halo distribution of NGC 5907 (Sackett et al. (1994)). Other workers have confirmed the presence of the faint light in other bands (BVRIJK), and showed that the extended light is redder than the thin stellar disk. If the faint light is due to a thick disk, it is unlike any other, with a scale length that is at least twice that of its thin disk (Morrison (1999)). The stellar population responsible for this faint light remains highly controversial, ranging from normal or metal-rich populations with steep IMFs (Lequeux et al. (1996); Rudy et al. (1997); James & Casali (1998)), old, metal-rich accreted populations with normal IMF (Lequeux et al. (1998)), or exceedingly metal-poor or giant-poor populations with few resolvable stars at the tip of the RGB (Zepf et al. (2000)). The controversy remains because the full spectral energy distribution is apparently inconsistent with any single explanation (e.g. Zepf et al. (2000); Yost et al. (2000)). 111The discovery of a faint, long, very narrow arc of light apparently associated with NGC 5907 (Shang et al. (1998)) led Zheng et al. (1999) to suggest that the extended light in the galaxy might be an artifact due to confusion from the arc and foreground objects. The arc clearly contributes some light to some positions near the galaxy, but is too narrow and asymmetric to be the cause of the symmetric extended light detected by Morrison et al. (1994). Zheng et al. (1999) report that their photometry suffers from systematics at light levels fainter than mag/sq arcsec. (Due to a large pixel size, the PSF was often undersampled, despite the seeing of 3.4 to 5.4″ that was typical of their observations). Since all detections of faint extended light in NGC 5907 have been reported for mag/sq arcsec, and all optical photometry (including that of Zheng et al. (1999)) agrees above this level, the mystery of this faint halo light remains.
The puzzling nature of the extended light in NGC 5907 has motivated new studies to test a possible connection between faint optical and IR light and dark matter in this and other spirals (Gilmore & Unavane (1998); Rauscher et al. (1998); Uemizu et al. (1998); Abe et al. (1999); Beichman et al. (1999); Yost et al. (2000); Zepf et al. (2000)). The optical results are mixed, but infrared surface brightness photometry indicates that whatever produces the faint optical light detected to date does not appear to emit strongly at IR wavelengths far from the plane of the galactic disks. Thus, if associated with known stellar populations, the sources of the faint light are unlikely to account for the dark mass of spiral galaxies.
| Parameter | Value | Reference |
|---|---|---|
| , (J2000.0) | 21 12 10.8, 37 37 38 | Karachentsev et al. (1999) |
| type | Sc+6 | Mathewson & Ford (1996) |
| redshift | 7680 10km s-1 | Mathewson & Ford (1996) |
| inclination | 88° | this paper |
| PA | 1204 05 | this paper |
| major-axis D∗ | 86″ | this paper |
| mB | 16.670.09 | Lauberts & Valentijn (1989) |
| mV | 16.400.03 | this paper |
| mR | 15.920.04 | this paper |
| mI | 15.470.06 | Mathewson & Ford (1996) |
| MR | 19.10.3 | this paper |
| MV | 18.70.3 | this paper |
∗major-axis diameter measured from the
R=27.0 mag/sq arcsec contour.
Magnitudes are not corrected for extinction.
In this paper, we report on the collection, reduction and analysis of ultra-deep surface photometry of the isolated, edge-on, low surface brightness, Sd galaxy ESO 342–G017, using some of the first science observations taken with the VLT. The simple optics, good seeing, and extremely well-sampled PSF of our observations ensured a low and well-understood level of scattered light and accurate identification of contaminating sources. Concurrent deep observations of unrelated blank fields with the VLT were used to create dark sky flat fields at the appropriate wavelengths. Considering all sources of uncertainty, including those from light scattered through the wings of the PSF, we conclude that the resulting surface photometry is reliable to a level of mag/sq arcsec and mag/sq arcsec. Analysis of these data reveals a faint component that we interpret as a thick disk, to our knowledge the first thick disk discovered in an LSB galaxy.
In Sect. 2 we describe the VLT observations and observing strategy. In Sect. 3 the data reduction process, including the production of dark sky flats and the procedures for masking, mosaicing, calibrating, and determining the sky flux are outlined. The procedure to extract profiles from the deep images is given in Sect. 4, along with a brief description of the error analysis, which is discussed in depth in the appendix. The resulting and surface photometry of ESO 342–G017 are presented in Sect. 5, along with a description of the fitting procedure for the thin and thick disk parameters. A thorough analysis of scattered light due to the tightly-constrained PSF is discussed in Sect. 5, and ruled out as the cause of the faint extended light we detect in ESO 342–G017. The thin and thick disks, including their inferred intrinsic properties are described in Sect. 6. We summarize and conclude in Sect. 7. Throughout this paper we assume a distance of 102 Mpc to ESO 342–G017 (based on a Hubble constant of H∘=75 km/s/Mpc), which yields an image scale of 0.495 kpc per arcsecond.
2 Observations
2.1 The Target Galaxy
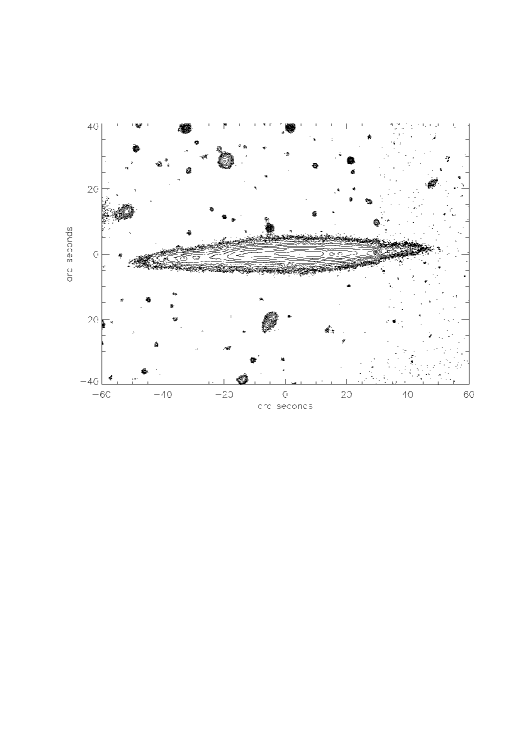
The target, ESO 342–G017, is a nearby, edge-on galaxy, selected on the basis of its right ascension and declination, very high disk inclination, absence of a prominent bulge, low extinction correction, and optimal angular size. The latter is important in order to adequately resolve the disk scale height while maintaining sensitivity to faint surface brightness in the halo. Our deep -band image obtained with the VLT–UT1 test camera is shown in Fig. 1 and the basic properties of the source are given in Table 1.
2.2 Observing Strategy and Resulting Data
| Field | Filter | Dates | Total Integration | Median Seeing |
|---|---|---|---|---|
| August 1998 | (seconds) | (arcsec) | ||
| ESO 342–G017 | Bessel- | 22 | 3300 | 11 |
| Bessel- | 18, 22, 25 | 10320 | 09 | |
| Flat-field frames: | ||||
| HDF–Sa | Bessel- | 18, 22, 23, 26, 27 | 16200 | 09 |
| Bessel- | 18, 22, 23, 25, 26 | 15300 | 10 | |
| EIS0046-2930 | Bessel- | 17 | 2700 | 08 |
| Bessel- | 17 | 2700 | 08 | |
| EIS0046-2951 | Bessel- | 22 | 2700 | 09 |
Bessel and observations of ESO 342–G017 were made on the nights of 18, 22 and 25 August 1998 as part of the ESO VLT–UT1 Science Verification (SV) program. A complete description of the VLT SV program telescope and instrument set-up can be found in Leibundgut et al. (1998) and Giacconi et al. (1999). We give only a summary of the issues important for our observations of ESO 342–G017.
The VLT Test Camera, an engineering grade Tektronix 20482 CCD, was rebinned 22 to improve its surface brightness sensitivity, resulting in a binned scale of 0.091 arcsec pixel-1 and a field of view of 93 arcsec on a side. The camera was rotated approximately 60 degrees in order to position the galaxy major axis along the x-axis of the detector. For economy of prose throughout the paper, we will refer to the northeast and southwest sides of ESO 342–G017 as the “northern” and “southern” sides, respectively.
A challenge to our data reduction was the fact that the Test Camera CCD is not a science-grade device. As such, it displays more than the customary number of cosmetic flaws, most noticeably, a large region (120130 pixels) near the center of the chip with a lower sensitivity than its surroundings. Although this “stain” has a strong colour dependence (it is more prominent in the blue), we found it to be temporally stable and therefore easily corrected with our science frame flat-fields (see Sect. 3.2). Furthermore, ESO 342–G017 was always positioned well away from this feature.
Fortuitously, long total integrations were made of the HDF-south and two EIS cluster candidate fields on the nights of 17, 18, 22, 23, 25, and 26 August, in the same filters as our observations. Using these images to create our deep sky flat-fields obviated the time-intensive strategy of observing off-source fields for ESO 342–G017. Each of the images used to make our superflats, as well as the observations of ESO 342–G017 itself, were dithered on average by more than 10″ in both and . This allowed for the removal of cosmic rays from our galaxy field, and the removal of stars in the super sky flat (see Sect. 3.2).
3 Data Reduction
3.1 Bias and Dark Current
The basic image reduction was done using MIDAS.
The bias frames showed a fixed structure with an overall level that varied up to 20 counts during the course of each night. We corrected for this by using the overscan region of the detector, which mirrored the same variation. For each night, a median-filtered master bias was made from at least 20 individual bias images. An average bias level was determined for each image from its overscan region. The associated master bias was then scaled to each overscan mean and subtracted from each image, with the 0.5 count difference between the overscan and the bias average taken into account. No significant dark current was measured in the VLT test camera.
3.2 Creating the Super Sky Flats
The greatest potential source of error in our final images is uncertainty in the flat-field. As many sky counts per pixel as possible are required to reduce the statistical error in the flat-field which, to avoid large systematic uncertainties, should be obtained using light with the same spectral energy distribution as the primary observation. This was done by creating a super flat-field made from careful combinations of the deep EIS and the HDF-S fields that were interleaved temporally with our observations of ESO 342–G017. The advantage of this method lies in the large total exposure of these deep fields, which are devoid of bright stars and were well-dithered between individual exposures. The HDF-S and EIS fields are located 263 and 538 away from ESO 342–G017, respectively.
Each candidate sky flat image was inspected visually; only those free of defects and temporally close to our observations of ESO 342–G017 were chosen. Observations of the HDF-S made on 28, 29, and 31 August 1998 were not used in our flat-field due to increasing sky levels from a waxing moon. The remaining 26 -band and 31 -band flat frames contained a total of 73560 and 39550 sky electrons per pixel, respectively. Considering only Poisson statistics of sky electrons, the flat-field formed from these frames should contribute a pixel-to-pixel error of 0.37% (-band) and 0.50% (-band). Of course, variations in the sky brightness across the image and remnant halos from inadequately removed bright stars, create large-scale errors above that expected from simple Poisson variations. We empirically determine the size of this dominant flat-field error below.
| Flat Correcting Flat | Filter | Rebinned Size (″) | Relevant Scale | Measured | |
|---|---|---|---|---|---|
| 0091 | 1 pixel | 0.57% | – | ||
| 0091 | 1 pixel | 0.78% | – | ||
| 0806 | 400 pc (hdisk) | 0.11% | 0.064% | ||
| 0806 | 400 pc (hdisk) | 0.14% | 0.088% | ||
| 09 | 450 pc (PSF FWHM in ) | 0.16% | 0.058% | ||
| 11 | 550 pc (PSF FWHM in ) | 0.12% | 0.065% | ||
| 604 | 3 kpc (hhalo) | 0.08% | 0.0086% | ||
| 604 | 3 kpc (hhalo) | 0.11% | 0.012% |
The super flat-field was created for each filter separately as follows. Each individual flat-field sky frame was normalised to its modal value as determined in the central 3/5 of the image. The average value of pixel () was then determined from the stack of sky frames for the filter, accepting a pixel () from the th frame in the computation of the average only if it passed two tests. First, its deviation from the mean pixel value in the stack at () must not exceed a given threshold measured in units of the noise at that pixel position (a - clip). This criterion effectively removed cosmic-ray events and, since each image was dithered by at least 10″ (110 pixels) in both and between successive exposures, the bright cores of stars and galaxies as well. Second, a median-filtered frame was created over a 33 pixel window from the average frame resulting from the first step. A - clip was again applied to each pixel () based on the value of its local median. The second test was applied to remove any remnant faint extended wings of stars and galaxies, which would otherwise contaminate the resulting flat-field frame. Only pixels satisfying both these “filters” entered the average for the flat-field frames. A normalization level was calculated from the median value in the central 3/5 of each flat-field frame, and each image was then flattened and renormalized.
In order to test the quality of the flat-fields, and to compute an empirical large scale flat-field error, we repeated the above procedure using only one-half of the available HDF-S and EIS images. In this way, was made from HDF-S and EIS images from nights 17, 18, 22, and 23 August, while was made from HDF-S and EIS images from nights 23 and 26 August. The two subflats and have approximately the same flux levels. Two -band subflats were created in the same way. The flat-field frames and were then flattened using and , respectively. Each was then examined visually for any remnant features, and then rebinned to a number of relevant scales and the variation across the frames measured. The cosmetic flaws inherent in the Test Camera CCD, particularly the “stain” mentioned in Sect. 2.2, were removed effectively by our flat-field procedure. The results are summarized in Table LABEL:tab:RMSflats, in which the measured is compared to that expected from photon statistics alone. The empirical values are used in our computation of flat-fielding errors.
3.3 Mosaicing and Masking the Galaxy Frames

A region of sky 2822 () and 2220 () around ESO 342–G017 was tiled with VLT test camera exposures and then combined into a final mosaic. Centroids of a number of stars and galaxies (usually 6 to 10) were measured in each individual image to compute their positional offsets within the mosaic. In order to remove cosmic ray events, images were divided into groups of four closely overlapping frames. Using the computed offsets, each group was combined into a temporary median-filtered image. Each input images was compared to its group median and all pixels deviating by more than 3.5 were replaced by the median value. Since cosmic ray events are often surrounded by lower brightness halos or tails, a second iteration was done at each position at which a cosmic ray was detected. In this second pass, a lower pixel correction criteria of 2.0 was applied.
The 14 (-band) and 11 (-band) frames with the best seeing were then combined, using integer pixel shifts, into - and -band mosaic frames. Given the small pixel size and large over-sampling, this did not limit the resolution of our resulting image. Since different regions of the mosaic are constructed from different numbers of images, it is necessary to renormalize. To do this an identical set of frames was created having the same sizes and offsets, but containing only the modal value of the source-free sky background. These were also combined into a mosaic and used to renormalize the - and -band mosaic frames. A subsection of the -band image resulting from this procedure is shown in Fig. 1.
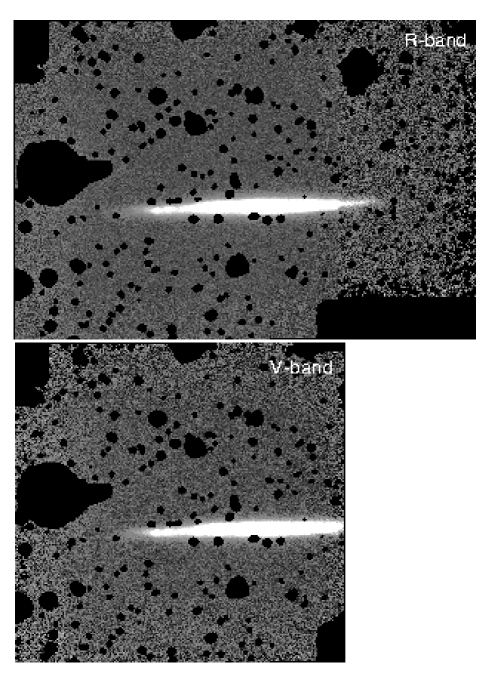
In order to be able detect faint light associated with ESO 342–G017 in our deep mosaic, foreground stars and background galaxies must be masked out. Since ESO 342–G017 was explicitly chosen for its paucity of foreground stars, most of the objects contaminating its background are galaxies (see Fig. 2), and simple profile fitting cannot be used to model and subtract contaminants.
Instead, we used the SeXtractor detection algorithm (Bertin & Arnouts (1996)) to find sources not associated with ESO 342–G017. A source was defined to consist of at least five connected pixels at a level of 1.5 above the local background, which was computed over a 3232 pixel mesh. The so-called OBJECTS output of SeXtractor, essentially a frame of all detected objects separated by null pixels, proved valuable in creating a mask for objects beyond the outermost contours of ESO 342–G017. The initial output masks still retained a faint halo of emission around brighter sources. For this reason, the masks were grown in size iteratively until a histogram of the unmasked background pixels no longer changed shape, indicating that the local background level had been reached.
A crucial step in the data reduction process is the determination of an accurate value for the background sky level. A large central section of both masked mosaics was extracted so that its area contained the largest possible number of overlapping individual images (11 for the -band and 8 for the -band). In order to prevent any emission from ESO 342–G017 contributing to the sky signal, the galaxy was liberally masked out to 201 (10 kpc) above and below the central plane of its disk, and along its major axis to the outermost edges of the images. The mask sizes of the brightest field stars were also liberally increased for this procedure.
3.4 Determination of Sky Level


The distribution of sky values are shown in the histograms of Fig. 4, which were used to compute the true background value of the unmasked pixels in each image, and the associated error in its mean. These sky values are and in the and bands, respectively. Using the calibration described in the next section, these values correspond to msky(R) = 20.98 mag/sq arcsec and msky(V) = 21.60 mag/sq arcsec, with a systematic uncertainty dominated by calibration errors of 5%. The systematic deviation from gaussian behaviour seen at extreme pixel values in Fig. 4 is slight and very much smaller, in its integrated effect on the average sky value, than the uncertainties based on gaussian statistics reported above.
3.5 Calibration to Standard System
Our photometric calibration was based on results supplied by the SV team together with the distribution of our data. A photometric solution was available only for the observations of ESO 342–G017 on 22 and 15 August, as these were the two photometric nights. Typically, four standard fields were observed several times during each of these nights, with an average of about 10 Landolt standard stars being used to compute the photometric solutions. The standards chosen spanned a significant range of colours in order to adequately measure the colour term.
4 Extracting Vertical Profiles
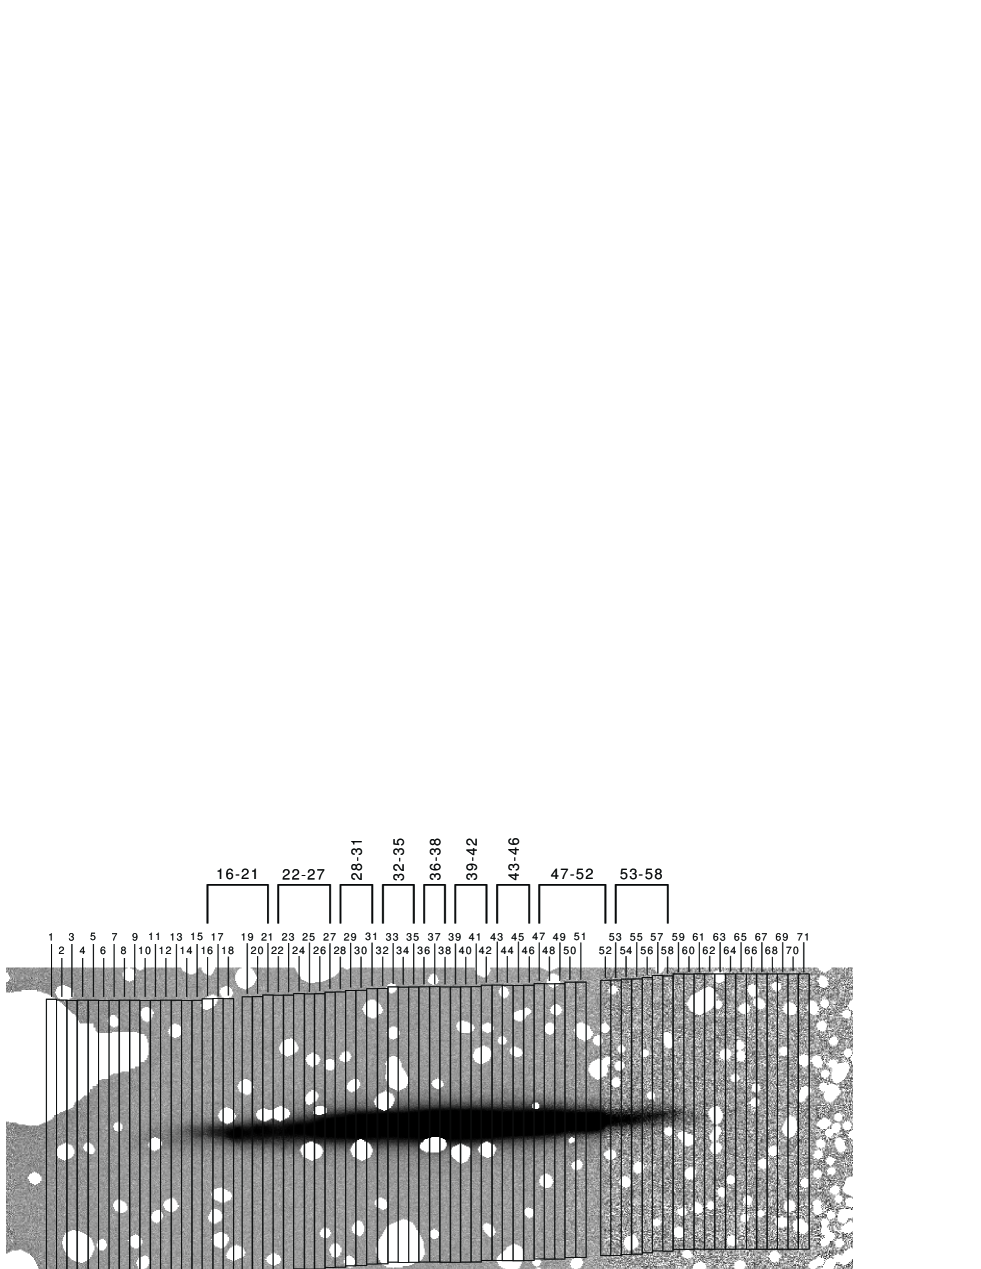
Achieving acceptable signal-to-noise at surface brightness levels 6 to 8 mag/sq arcsec below sky requires averaging over a large number of pixels. We begin by extracting a number of vertical rectangular regions, each of dimension 21 530 pixels (0.9 24 kpc), perpendicular to the disk of ESO 342–G017. These extracted areas are centered on the major axis of the galaxy, avoid the most prominent HII regions, and extend well beyond the visible disk. The positions of the extractions were identical for both the and -band images; 71 regions were extracted from the -band image and 52 from the smaller -band image. Fig. 5 shows these areas atop on our masked mosaic -band image.
| Uncertainty | R-band | V-band | ||
|---|---|---|---|---|
| [electrons] | Galaxy Center (%) | 4 kpc (%) | Galaxy Center (%) | 4 kpc (%) |
| Averaged flux per pixel | 30640 | 16703 | 5498 | 2958 |
| Sky flux per pixel | 16651.5 | 16651.5 | 2950.2 | 2950.2 |
| Net flux per pixel | 13988.5 | 51.5 | 2547.8 | 7.8 |
| Read Noise () | 0.04 (0.0003) | 0.04 (0.08) | 0.05 (0.002) | 0.05 (0.6) |
| Flat-Fielding () | 7.4 (0.05) | 4.0 (7.8) | 1.8 (0.07) | 1.0 (12.5) |
| Photon Noise () | 1.0 (0.007) | 0.8 (1.5) | 0.5 (0.02) | 0.4 (5.4) |
| Mosaicing Error () | 1.7 (0.01) | 0.9 (1.8) | 2.6 (0.1) | 1.4 (17.9) |
| Surface Brightness Fluctuations () | 0.2 (0.001) | 0.01 (0.02) | 0.06 (0.002) | 0.003 (0.04) |
| Total Statistical Error () | 7.6 (0.05) | 4.2 (8.1) | 3.2 (0.1) | 1.7 (22.3) |
| Sky Subtraction ()∗ | 0.4 (0.003) | 0.4 (0.8) | 0.2 (0.008) | 0.2 (2.6) |
| Total [ mag/sq arcsec] | 21.17 0.04 | 27.3 | 21.76 0.03 | 28.0 |
The numbers in parentheses are the errors as a percentage of the sky-subtracted flux.
∗ Note: the sky subtraction error is a systematic error
and, therefore, does not enter into .
From these initial extractions four levels of averaging were performed in order to increase the signal-to-noise:
-
1.
The sum of the flux across the 21 pixel wide -direction was determined for each extraction, and normalized by the number of non-masked pixels contained in each row.
-
2.
Due to the extremely symmetrical cross-section of ESO 342–G017 (see Fig. 6) we were able to average the profiles above and below the disk.
-
3.
In the vertical direction (-axis), each profile was averaged over the size of the seeing FWHM (10 pixels) for all points above the plane of the galaxy.
-
4.
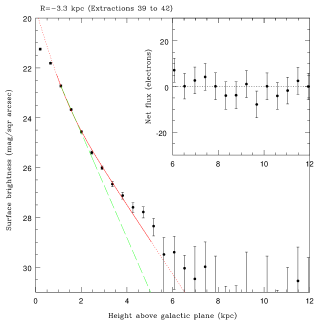
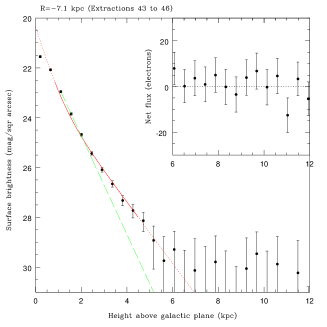
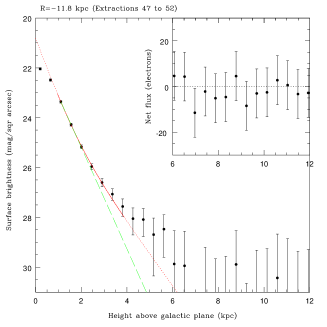
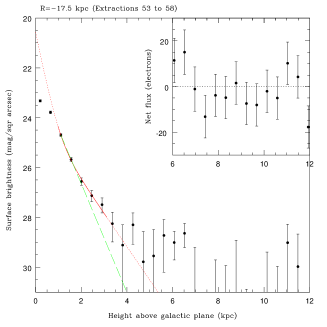
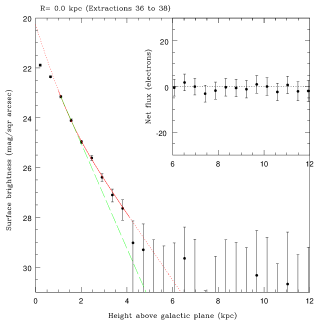
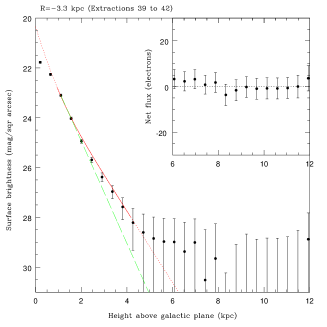
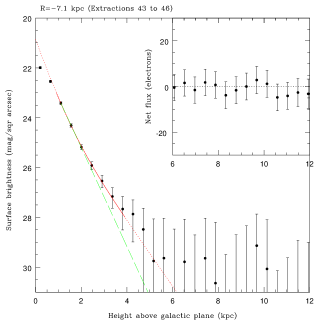
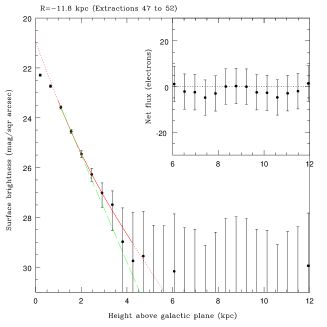
Finally, a number of profiles were averaged together. An average of the three innermost profiles (extractions 36 to 38) was made to create one central profile, groups of four profiles (28–31 and 32–35 to the east and 39–42 and 43–46 to the west) were averaged on each side of the center, groups of six (16–21 and 22–27 to the east and 47–52 and 53–58 to the west) were averaged on the outermost ends of the galaxy. The extractions averaged together are shown at the top of Fig. 5. In the case of the -band image, the averaging process ends with extraction number 52.
The resulting masks made from the and images separately, were then multiplied together to create a master mask frame that was applied to each mosaic. This procedure masked 10.3% and 11.0% of the total image areas in the final and mosaics respectively. The masked images are shown in Fig. 3.

For each of the vertical extractions covering the visible disk of ESO 342–G017 (profiles 16 to 58 in and 16 to 52 in ), a least-squares fit to the thin disk component was made. A simultaneous two-component (thin and thick disk) fit was made to each extraction, using an exponential parametrization given by
| (1) |
for both components, where is the surface flux at the position the extraction crosses the major axis of the galaxy, is the projected distance from the major axis, and is the exponential scale height. The fitted parameters are , , , and . Regions strongly affected by dust or clumpy HII regions were excluded from the fit. For comparison, a single-component (thin disk) fit was also performed for those data that lie between 1 and 3 mag/sq arcsec below the central galaxy surface brightness. Results are presented in Sect. 5.
4.1 Error Analysis
We present here a brief summary of the sources of photometric uncertainty and their magnitudes; the reader is referred to the Appendix for a more detailed discussion.
For illustration, Table 4 shows the average flux levels and uncertainties at two positions along the central vertical profile (the average of extractions 36 to 38) of ESO 342–G017, one at the galaxy center and another at the much fainter light levels 4 kpc above the galaxy disk. For each of the two flux extremes in each of and -bands, we give the uncertainties associated with the average flux per pixel (averaged over the unmasked area of 32110 pixels) in units of electrons and as a percentage of the sky-subtracted flux (given in parentheses).
The systematic uncertainties in the sky level of and correspond to errors of only 0.0024% and 0.0068% per pixel in the and bands, respectively. These systematic uncertainties are present in the sky-subtracted profiles we present in the next section, but because they correspond to light levels and magnitudes below the sky (msky(R) = 20.98 mag/sq arcsec and msky(V) = 21.60 mag/sq arcsec), they are of no importance (10%) over the range of surface brightness we consider. The systematic uncertainty in overall calibration to a standard system of about 5% is relevant, but simply corresponds to a possible overall shift in the surface brightness scale by that amount. Note that at bright flux levels, the error in the magnitudes is dominated by the error in the photometric conversion term, not by . At faint flux levels, the situation is reversed.
5 Results
5.1 Analysis of the Surface Brightness Profiles
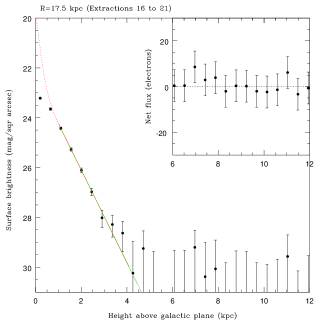
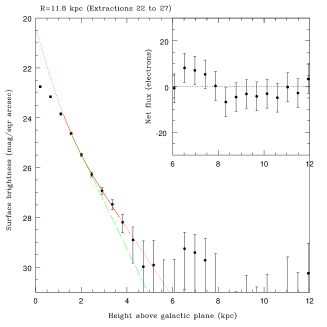
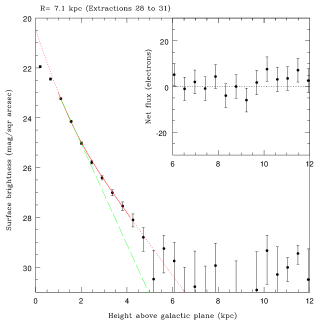
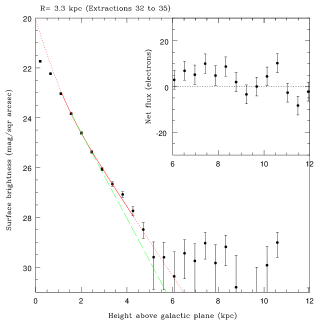
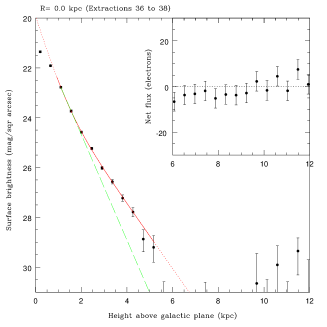
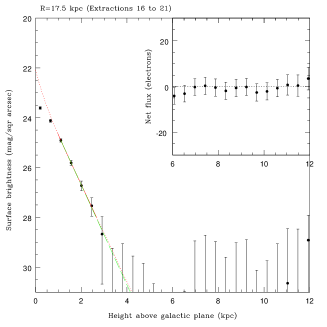
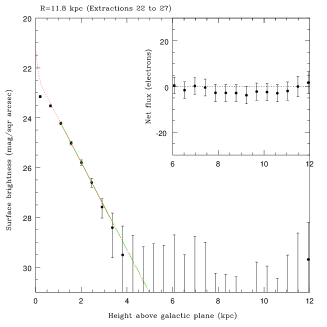
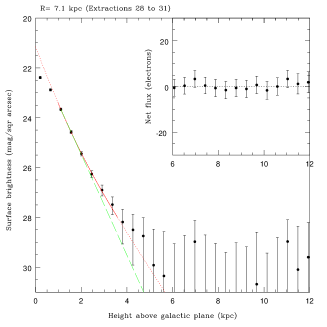
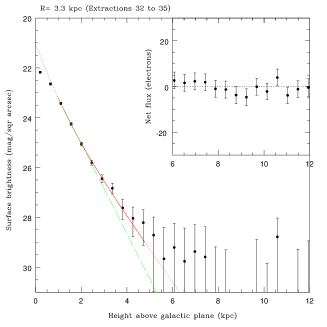
In Figs. 7 and 8, we show the vertical extractions, averaged above and below the plane of ESO 342–G017, derived from our deep VLT imaging and discussed in Sect. 4. Individual extractions consist of the horizontal average of 21 pixel wide rectangles, with foreground stars and background galaxies masked. Extractions above and below the galaxy disk were averaged about their axis of symmetry and averaged in groups to produce the profiles shown in the figures. In order to display meaningfully our data at the faintest levels, insets in Figs. 7 and 8 show fluxes on a linear scale for distances greater than 6 kpc from the major axis of ESO 342–G017. The scatter in each inset about zero indicates clearly that the sky flux has been well-subtracted in our final mosaic within our calculated uncertainties.
The deviation from pure exponential behaviour in nearly all of the profiles indicates that presence of extended light beyond that expected for a purely exponential stellar disk. This motivated our choice of one- (thin disk only) and two-component (thin+thick disks) least-squares fits to the profiles, which are overplotted in Figs. 7 and 8 on the data. Both components were modeled as exponential disks (see equation 1) with the scale height and central surface brightness as free parameters. The scale heights and central surface brightnesses (expressed in mag/sq arcsec) derived from the simultaneous thin plus thick disk fits are summarized in Table LABEL:tab:diskparams.
| Thin Disk | Thick Disk | ||||||||
|---|---|---|---|---|---|---|---|---|---|
| ( mag/sq arcsec) | (pc) | ( mag/sq arcsec) | (pc) | ||||||
| R (kpc) | |||||||||
| 17.5 | 24.2 | 22.7 | 340240 | 350210 | 22.49 | 22.9 | 600 120 | 600230 | |
| 11.8 | 22.3 | 22.1 | 520190 | 320210 | 23.0 | 22.08 | 720 180 | 600160 | |
| 7.1 | 20.83 | 21.36 | 42118 | 410140 | 23.05 | 23.0 | 870 55 | 760270 | |
| 3.3 | 21.25 | 21.37 | 49435 | 42891 | 22.43 | 22.73 | 807 59 | 820140 | |
| 0 | 20.01 | 20.49 | 3469 | 36046 | 22.11 | 22.53 | 808 16 | 80684 | |
| 3.3 | 20.19 | 20.68 | 39613 | 38475 | 22.33 | 22.29 | 806 33 | 740120 | |
| 7.1 | 20.61 | 21.03 | 41622 | 42287 | 22.58 | 23.21 | 856 52 | 880260 | |
| 11.8 | 20.90 | 21.05 | 43133 | 390110 | 23.62 | 23.0 | 950 160 | 760320 | |
| 17.5 | 21.44 | 32451 | 24.85 | 1100 220 | |||||
Note: these structure parameters are the results of the model fits to the observed profiles and have not been corrected for projection effects.
5.2 Could the Faint Extended Emission be Scattered Light?
The first-order effect of turbulence in the atmosphere causes the radial point spread functions (PSFs) of point-like objects measured by an astronomical detector to have a roughly gaussian shape, but many effects, including scattering in the telescope optics, can lead to broader wings. Although the simple optics of the VLT test camera (Giacconi et al. (1999)) should minimize such a scattering, faint wings in the PSF are still present. To quantify the effect of these wings on our faint surface brightness photometry, we measured the PSFs of isolated fainter stars in the field of ESO 342–G017 and bright standard stars observed on the same nights as our science frames.
In order to be meaningful, such PSFs must be constructed with high signal-to-noise data. A conservative estimate of the precision required can be made by assuming that all of the light of ESO 342–G017 is confined to a point at a distance equal to the angular separation between the center of the galaxy and the most distant point above the plane we consider. Such an estimate shows that ,at 6 kpc above the plane, the amount of -band light brighter than 30 mag/sq arcsec scattered from ESO 342–G017 can be quantified easily if the PSF is known to a precision of at that distance.
Only three relatively isolated stars near the center of the ESO 342–G017 mosaic are available; the - and -band images of these were masked, added, and azimuthally averaged. The result is shown in Fig. 9. Note that although the extended emission around ESO 342–G017 is seen more clearly in the -band, median seeing in is better than in . At faint light levels, both the and faint-star PSFs have broader wings than a pure gaussian. Unfortunately, the statistical noise in these faint-star PSFs, and the relative size of the systematic photometric uncertainties over the relevant radii, precludes measurement in the wings to the accuracy we require. In principle, saturated stars on the mosaic could be used to study the wings of the PSF, but our small field contained only two; one has a near bright neighbor and the other does not fall on the -band mosaic.
We therefore study the PSF wings using much brighter standard stars imaged during the same observing run. We build a model PSF directly from the data, using the isolated three stars on the mosaic of ESO 342–G017 to derive the PSF out to 2.5″, and a bright reference star observed with similar seeing to derive the PSF from 2.5 to 16″ (i.e., out to 8 kpc above the galaxy plane). Since the seeing was slightly better during the imaging of the reference star, the standard star profile was horizontally displaced to create a smooth match to the inner PSF derived from the mosaic. The result is shown as the thin solid line in Fig. 9. The -band PSF of the standard star is consistent with zero at the level of from 7 to 12 arcsec ( to 6 kpc), satisfying the conservative requirement that we derived above. We conclude, therefore, that the PSF is well enough understood to determine its effect on the observed shape of the vertical surface brightness profiles of ESO 342–G017.
In order to examine whether the extended light apparent in Figs. 7 and 8 might be due to thin disk light scattered through the broad wings of the PSF to other positions on the detector, we convolved a model exponential disk with intrinsic structural characteristics similar to those of ESO 342–G017 with our model -band PSF. The intrinsic thin disk model parameters reported in Sect. 6 were determined by requiring that, after inclination and convolution with the observed PSF, the projected thin-disk fitted parameters were retrieved. The degree to which the thin disk fits are reproduced is illustrated in Fig. 10.
Due to its high inclination, ESO 342–G017 has an observed surface brightness along its length that is much larger than the intrinsic (input) face-on value. Except for the central regions, which suffer a net loss of light from scattering, the primary effect of inclination — and to a lesser extent scattering — is to increase the amount of light observed at a given angular distance from the plane of ESO 342–G017. The result (output) is an observed profile that is approximately exponential, but with a projected scale height larger than the intrinsic value. More importantly, however, Fig. 10 clearly illustrates that for surface brightnesses brighter than mag/sq arcsec, no substantial light in excess of the projected thin disk profile is generated by inclination and scattered light effects. The extended light mag/sq arcsec in many of the profiles of Fig. 7, therefore, must have another cause; we conclude that it is intrinsic to the galaxy itself. This conclusion is supported by the constant color (or possible slight reddening) of the extended light with increasing distance from the galaxy plane, despite the fact that the scattering in the -band images is larger than that in as measured from the stellar PSF on the science mosaic.
6 The Thin and Thick Disks of ESO 342–G017
The extended light in ESO 342–G017 is reasonably well fit by a thick exponential disk with nearly constant projected scale height () as a function of galactocentric radius (R) along the major axis of the galaxy. This is illustrated in Figs. 7 and 8, and in Fig. 11, where the fitted values of for each averaged extraction are shown in both the and bands for the thick and thin exponential disk components. The error-weighted mean of the projected scale heights are: pc and pc in the -band and pc and pc in the -band. The projected scale length, , of the thin disk is more difficult to assess, but is estimated from the fitted values of as a function of position along the major axis to be about kpc in both bands. The projected scale length of the fitted thin disk is indeterminate from the V-band frames, but is consistent, within the uncertainties, with the projected scale length of the thin disk in the R-band.

When deprojected and deconvolved (that is, taking into account line-of-sight effects due to the inclination of the galaxy and seeing), the true face-on surface brightness of the thin disk in the -band is mag/sq arcsec, with a true scale height and scale length of pc and kpc, respectively. These estimates were made by convolving model thin exponential disks inclined at 88o with the measured PSF, and requiring that the resulting vertical and radial profiles matched those fitted to the observed profiles (see fig 10). The intrinsic thin disk scale heights and lengths in the -band are the same as those in the -band, within uncertainties. The projected scale height, , is larger than the intrinsic value primarily due to convolution with the comparably sized PSF. On the other hand, the projected scale length, , is larger than because of line-of-sight effects due to the extreme inclination of the galaxy. The thin disk has an inferred face-on surface brightness in of mag/sq arcsec, implying an intrinsic color of for the thin disk. Since the color is found by extrapolating the fitted parameters into the plane of the disk, it is relatively, though not completely, insensitive to dust and clumpy luminosity from HII regions. We estimate that the uncertainty in our inferred intrinsic parameters is about %, primarily coming from uncertainties in inclination and the fit parameters.
The structural parameters of the extended light are more uncertain, but also much less affected by inclination and seeing effects. We have not attempted, therefore, to deproject the thick disk scale parameters, but expect that in the band the intrinsic scale height is close to the projected value of pc, while the true scale length of the thick disk is between 6 and 9 kpc, (the intrinsic thin disk and projected thick disk values, respectively). The value of the central surface brightness of the thick disk is uncertain, but can be constrained. For a pure exponential disk, the edge-on central surface brightness (in linear units) can be shown to be given by , where is the face-on central surface brightness. If we assume that the fitted value mag/sq arcsec of the thick disk in the -band is a good approximation to the actual edge-on value for the thick disk, then, based on our estimates of these quantities and their uncertainties, we can deduce that mag/sq arcsec. The PSF may have a small effect that would cause the fitted value to be higher than the actual value, in which case these constraints would be pushed to slightly fainter magnitudes. The detection of the thick disk in the -band is less secure, both because the of our relative surface brightness photometry is lower in and because the PSF (and thus scattered light problems) is larger in . Furthermore, beyond galactocentric radii of 5 kpc, there is only a small statistical difference in the inferred scale heights of the fitted thin and thick disks (Fig. 11), and the extrapolated in-plane surface brightness of the thick component in the -band shows no clear trend with major axis radius.
The intrinsic -band scale heights of the thin and thick disk components of ESO 342–G017 are similar to those of the Milky Way, but because the intrinsic scale length of its thin disk is larger than the commonly accepted Galactic value of kpc (see references in Sackett (1997)), the ratio is 50% larger for ESO 342–G017 than for the Galaxy. Since the total luminosity of any pure exponential disk is given by , if the intrinsic scale lengths of the thick and thin components are equal, the ratio of total light in each is given by the ratio of their intrinsic central surface brightness. Together with the constraints on for the two components derived above, this assumption implies that the thick disk contributes 20-40% of the total -band light of ESO 342–G017, excluding the light in individual masked HII regions.
Finally, we note that these constraints on the luminosity contribution of the thick disk imply a combined (thin+thick disk) face-on central surface brightness for ESO 342–G017 of . Since the color of the galaxy is certainly greater than zero, and probably , this places ESO 342–G017 firmly in the class of low surface brightness (LSB) galaxies, which are generally defined as those disks with -band face-on central surface brightnesses mag/sq arcsec (c.f., de Blok et al. (1995)).
7 Summary and Conclusions
We have used the VLT test camera on UT1 to obtain deep surface brightness photometry of the edge-on LSB galaxy ESO 342–G017 in the and -bands. Careful masking of foreground and background objects to obtain an accurate value of the sky flux on our science mosaics, and an analysis of flat-fielding uncertainties – both statistical and systematic – on a variety of spatial scales, allow us to estimate confidently the total uncertainty in our deep surface photometry. We conclude that on the size scales important for probing faint, extended structure, we reach and mag/sq arcsec. A detailed analysis of the PSF of the images, derived from faint isolated stars on the mosaic and standard stars, indicates that scattered light affects the extended vertical luminosity profiles of ESO 342–G017 only for mag/sq arcsec.
Extended light in excess of that expected for a single-component thin disk is detected at about mag/sq arcsec in nearly all vertical profiles perpendicular to and up to 17 kpc along the major axis of ESO 342–G017. The same component may have also been detected in the band frames, but the lower of these frames and the larger PSF in make this detection less robust. Given the geometric form of the extended light in this apparently bulgeless galaxy, we interpret the faint -band light as a thick disk.
Two-component exponential disk fits were made to the observed surface brightness profiles and used to determine projected and – after deprojection and deconvolution – intrinsic structure parameters for the thin disk of ESO 342–G017 in the - and -bands and for the thick component in . In particular, we find:
-
•
The thin disk has projected scale heights perpendicular to the major axis of pc in the -band and pc in . The projected scale length of the thin disk is kpc in both bands.
-
•
After deprojection and deconvolution with the PSF derived from our observations, we estimate that, within the errors, the intrinsic thin disk scale heights are 80% of the measured values. The intrinsic scale length of the thin disk is of the fitted value.
-
•
The face-on central surface brightness of the thin disk is estimated to be mag/sq arcsec in and mag/sq arcsec in .
-
•
The thick disk, which is detected robustly in our surface photometry, has a projected scale height of pc in the -band and pc in . The projected scale length of the thick disk cannot be determined precisely from our observations, but within uncertainties is consistent with that of the thin disk.
-
•
The intrinsic scale parameters of the thick disk are somewhat smaller than these measured projected ones, though not as dramatically different as the projected and intrinsic parameters of the thin disk.
-
•
Simple considerations lead to an estimate for the face-on central surface brightness of the thick disk of mag/sq arcsec.
-
•
The thick disk is likely to contribute 20-40% of the total (old) disk -band luminosity of the galaxy.
-
•
The total central surface brightness of the (thin + thick) disk is mag/sq arcsec, which places ESO 342–G017 securely in the category of low surface brightness (LSB) galaxies.
This detection of a thick disk adds to only a few others known in external galaxies (see Sect. 1), and to our knowledge is the first known thick disk in an LSB galaxy. The thick and thin disks of ESO 342–G017 have similar scale heights as their corresponding components in the Milky Way, but larger scale lengths. Importantly, the thick disk of ESO 342–G017 appears to contribute a larger fraction of the overall old disk light than does the Galactic thick disk. (Young HII regions have been masked and so do not enter into the extrapolated estimates we have made.) A prominent thick disk in ESO 342–G017 is particularly interesting since, compared to their high surface brightness cousins, LSB galaxies are thought to be more dark-matter dominated and to have less evolved disks. The VLT observations reported here suggest that, at least in the case of ESO 342–G017, such an unevolved thin disk can coexist with a substantial thick luminous component, perhaps providing a clue to the formation mechanism of thick disks in all spirals.
Acknowledgements.
We are grateful to the ESO VLT Science Verification team for their assistance in obtaining the data analyzed here and to Edwin Valentijn for useful discussions. MJN acknowledges support by the European Commission, TMR Programme, Research Network Contract ERBFMRXCT96-0034 “CERES.” PDS thanks the Anglo-Australian Observatory, Epping and the Institute for Advanced Study, Princeton for hospitality during the completion of some of the work presented here. This research has made use of the NASA/IPAC Extragalactic Database (NED) which is operated by the Jet Propulsion Laboratory, California Institute of Technology, under contract with the National Aeronautics and Space Administration.Appendix A Photometric Uncertainties
Accurate detection and characterization of faint surface brightness features in galaxies requires a thorough understanding of the uncertainties in CCD photometry at very low light levels. Both systematic and statistical uncertainties are present, and can affect the photometry over different spatial scales. We consider here seven different sources of photometric uncertainty, and combine them to create an error budget for an area of arbitrary size in the combined mosaic of the ESO 342–G017 field. The error bars presented in Figs.7 and 8 are calculated according to this error budget.
Our analysis of photometric uncertainties must reflect the process by which the deep, masked mosaics from which we derive surface brightness profiles were generated. In what follows, all fluxes and uncertainties will be expressed as numbers of electrons , and will be used as an index to label one of the individual frames that were co-added to form the mosaic at that position.
The flux at any sky position in the mosaic is defined by:
where is the sky value (in ) on frame , that is, the median of all background (non-object, non-masked) pixels in frame . The quantity is a normalization constant defined by
where runs over all sky pixels on frame , and runs over all frames used anywhere in the matrix. On the other hand, note that if frame did not contribute to the flux at position , due to it being masked, then and . Thus is a property of submosaics – portions of the mosaic composed from the same individual frames – and is of the order , where is the number of frames contributing to submosaic SM. The electron flux at position is thus the total flux of all frames contributing to the mosaic at that position, weighted by the total sky value on each part of the submosaic in order to account for frame-to-frame differences in transparency and total exposure time.
We now consider separately individual sources of photometric uncertainty within detector regions composed of pixels spread over a total area , of which are unmasked pixels that combine to form an unmasked area . Throughout, we will assume that all portions of the subarea on the mosaic were constructed from the same individual CCD frames. All expressions for uncertainties are expressed in terms of numbers of electrons.
A.1 Read Noise:
The noise associated with reading the charge collected in the CCD array is associated with every pixel of the array. For the UT1 test camera, this noise has a random distribution with an rms (root-mean-square) value of 7.2. Over an unmasked area on the detector, the uncertainty in the flux contributed by read noise is thus
assuming that each of the frames contributing to the mosiac area had unmasked pixels.
A.2 Flat-Fielding:
Flat-fielding was performed by constructing supersky flats from moonless UT1 Hubble Deep Field South and EIS images in the same bands taken during a 10-day period coinciding with our ESO 342–G017 observations. Dithering helped to ensure that sky objects did not fall on the same portion of the physical detector and could thus be removed in the median process (see Sect. 3.1). Nevertheless, Table LABEL:tab:RMSflats demonstrates that the fractional rms scatter in the flat field averaged over different size scales does not scale with , a clear sign that the flat-fielding errors are not purely statistical. For scales larger than the gaussian FWHM of the seeing disk (1), subtle extended light from sky objects may not be entirely removed by the supersky flat median process, creating an increase in the flat-fielding residuals on these scales. On the largest scales, systematic errors are nearly an order of magnitude larger than those due to counting statistics in the flat-fields.
The fractional flat-fielding uncertainties from Table LABEL:tab:RMSflats must be multiplied by the total unmasked flux in area on frame , and then combined to yield the flat-fielding uncertainty within an area on the mosaic. Since the science frames were dithered by more than 10″ in each direction, larger than any area considered here, any position on the mosaic is constructed with images that were flat-fielded at different positions on the physical detector. Thus the flat-fielding uncertainties of individual frames can be treated as being independent and added in quadrature. For the mosaic we thus have
where runs over all unmasked pixels in the area on frame and can be pulled outside the sum because the masking is performed on the mosaic and thus is identical for all individual frames .
A.3 Photon Noise:
The photon noise is essentially uncorrelated over areas larger than the FWHM of the PSF, so that it is given by the square root of the number of electrons within that area. For a given frame, we thus compute the uncertainty due to photon noise within areas comparable to the PSF, and then add these in quadrature. The uncertainties for individual frames are independent, and can be added in quadrature to yield the total uncertainty due to photon noise within an unmasked area on the mosaic. Since the uncertainties are proportional to the square root of the number of electrons but are then added in quadrature, for any area , the resulting photon noise is
where is the number of PSF-sized areas within . Note that this is nothing more that the square root of the total number of electrons recorded by all unmasked pixels from all frames contributing to the area of the mosaic. In all of our work, we will only quote surface photometry for so that all points in our surface brightness profiles are independent, and so that the formulation above can be used to calculate photon noise.
A.4 Sky Subtraction:
Sky subtraction introduces the same systematic uncertainty to every position in the mosaic. The determination of the sky values and their uncertainties (, ) were discussed in Sect. 3.4 and Sect. 4.1. Since the sky values are determined from the mosaic itself, the normalization factor is already contained in these values. We have then simply
A.5 Absolute Calibration:
The absolute calibration, or transformation of our surface brightness photometry to a standard system, is not of primary importance to many of our scientific results since relative measurements from one portion of the mosaic to other portions are more relevant. Nevertheless, as explained in Sect. 3.5, all absolute measurements have a fractional uncertainty of due to errors in the absolute calibration. Thus, for absolute quantities we must also consider
Again, because the calibration is performed on the mosaic itself, the normalization factor is already contained in these values.
A.6 Mosaicing:
If the image of ESO 342–G017 had been formed without mosaicing, then the total normalization constant in the first equation of the appendix would not be present and thus would introduce no uncertainty in the final photometry. (The uncertainty in is dominated by the uncertainty in ; we ignore here the very much smaller uncertainty in .) With mosaicing, relative errors related to the uncertainty in the quantity may be introduced between different parts of the mosiac. We consider, therefore, the mosaicing uncertainty of photometry in submosaic relative to the fiducial submosaic (taken to be central submosaic containing flux from all ESO 342–G017 frames), to be
where the are the uncertainties in the median sky values of individual frames summed over those frames contributing to the indicated submosaic.
A.7 Surface Brightness Fluctuations:
In outlining a method for determining extragalactic distances, Tonry & Schneider (1988) derive an expression for the intrinsic variations in an elliptical galaxy or spiral galaxy bulge. This fluctuation in surface brightness is due to the counting statistics of a finite number of unresolved stars contributing flux to each pixel of a CCD image.
The fluctuations in a single pixel is (Tonry & Schneider (1988)):
where is the mean number of counts due to the galaxy alone (), is the single exposure integration time (seconds), is the distance to the source in parsecs, and is the magnitude corresponding to 1 count per pixel per second in the final image. This equation, however, does not take into account the effects of seeing, which strongly reduce the apparent brightness fluctuations. This reduction is significantly greater than 1/, where is the total number of pixels, for spatial bins larger than the seeing PSF (Morrison et al. (1994)). Because of the large distance to ESO 342–G017, surface brightness fluctuations make a very small contribution to our total error budget. Therefore, rather than simulating the effects of seeing at various binning scales (as done by Morrison et al. (1994)), we compute this error as an upper limit, and simply scale it to our bin sizes using only a 1/ factor.
For our data, we take =600 seconds, =102 Mpc, =21.6 mag/sq arcsec and =21.3 mag/sq arcsec, and =-0.7 and =-0.3 (Tonry et al. (1990)).
A.8 The Total Error Budget
We are now in a position to combine these different sources of uncertainty to arrive at an error budget for our surface brightness photometry of ESO 342–G017. The read noise, flat-fielding, photon noise, mosaicing and intrinsic surface brightness fluctuation uncertainties are all independent and statistical, and so can be added in quadrature, so that
This is the statistical error that will cause random scatter in our surface brightness profiles. The sky subtraction and absolute calibration uncertainties are systematic in that all measurments in the mosaic will be affected in the same way by errors in these derived quantities. Sky subtraction errors will systematically change the slope of the surface brightness profiles; calibration errors will shift the profiles by a constant amplitude. All profiles that we display in Sect. 5 have statistical error bars computed as described in this appendix. The effect of sky subtraction and calibration uncertainties must be considered separately.
References
- Abe et al. (1999) Abe, F., Bond, I.A., Carter, B.S. et al., 1999, AJ, 118, 261
- Bahcall & Kylafis (1985) Bahcall, J.N., Kylafis, N.D., 1985, ApJ, 288, 252
- Beichman et al. (1999) Beichman, C., Helou, G., Van Buren, D., Ganga, K., Desert, F.X., 1999, ApJ, 523, 559
- Bertin & Arnouts (1996) Bertin E., Arnouts S., 1996, A&A, 117, 393
- Bland-Hawthorn & Freeman (2000) Bland-Hawthorn, J. & Freeman, K., 2000, Science, 287, 79
- Bridges et al. (1991) Bridges, T.J., Hanes, D.A., Harris, W.E., 1991, AJ, 101, 469
- Burstein (1979) Burstein, D., 1979, ApJ, 234, 829
- Buser (2000) Buser, R. 2000, Science, 287, 69
- Buser et al. (1999) Buser, R., Rong, J., Karaali, S., 1999, A&A, 348, 98
- de Blok et al. (1995) de Blok, W.J.G., van der Hulst, J.M., & Bothun, G.D., 1995, MNRAS, 274, 235
- de Grijs & Peletier (1997) de Grijs, R., Peletier, R.F., 1997, A&A, 320, L21
- de Grijs & van der Kruit (1996) de Grijs, R., van der Kruit, P.C., 1996, A&AS, 117, 19
- Fleming et al. (1995) Fleming, D.E.B., Harris, W.E., Pritchet, C.J., Hanes, D.A., 1995, AJ, 109, 1044
- Fry et al. (1999) Fry, A.M., Morrison, H.L., Harding, P., Boroson, T.A., 1999, AJ, 118, 1209
- Giacconi et al. (1999) Giacconi, R., Gilmozzi, R., Leibundgut, B. et al., 1999, A&A, 343, L1
- Gilmore & Unavane (1998) Gilmore, G. & Unavane, M., 1998, MNRAS, 301, 813
- Graham et al. (1996) Graham, A., Lauer, T.R., Colless, M., Postman, M., 1996, ApJ, 465, 534
- Hamabe & Wakamatsu (1989) Hamabe, M., Wakamatsu, K.-I., 1989, ApJ, 339, 783
- Harris (1986) Harris, W.E., 1986, AJ, 91, 822
- Harris et al. (1995) Harris, W.E., Pritchet, C.J., McClure, R.D., 1995, ApJ, 441, 120
- Harris & Racine (1979) Harris, W.E., Racine, R., 1979, ARAA, 17, 241
- James & Casali (1998) James, P., & Casali, M. M. 1998, MNRAS, 301, 280
- Karachentsev et al. (1999) Karachentsev, I. D., Karachentseva, V. E., Kudrya, Y. N., Sharina, M. E., Parnovsky, S. L. 1999, Bull. Special Astrophys. Obs., 47, 5, (The Revised Flat Galaxy Catalog)
- Lauberts & Valentijn (1989) Lauberts A., Valentijn E. A. 1989, The Surface Photometric Catalogue of the ESO-Upsala Galaxies Catalogue. ESO, Garching
- Lequeux et al. (1996) Lequeux, J., Fort, B., Dantel-Fort, M., Cuillandre, J.-C., & Mellier, Y. 1996, AA, 312, L1
- Lequeux et al. (1998) Lequeux, J., Combes, F., Dantel-Fort, M., Cuillandre, J. -C., Fort, B., & Mellier, Y. 1998, AA, 334, L9
- Leibundgut et al. (1998) Leibundgut, B., De Marchi, G., & Renzini, A. 1998, The Messenger, 92, 5
- Mathewson & Ford (1996) Mathewson, D. S. & Ford, V. L. 1996 ApJS, 107, 97
- Matthews et al. (1999) Matthews, L.D., Gallagher, J.S., van Driel, W., 1999, AJ, 118, 2751
- Morrison (1999) Morrison, H.L., 1999, in ”The Galactic Halo”, eds. B.K. Gibson, T.S. Axelrod & M.E. Putnam, ASP Conf. Series 165, 174
- Morrison et al. (1994) Morrison, H.L., Boroson, T.A., Harding, P., 1994, AJ, 108, 1191
- Morrison et al. (1997) Morrison, H.L., Miller, E.D., Harding, P., Stinebring, D.R., Boroson, T.A., 1997, AJ, 113, 2061
- Ojha et al. (1996) Ojha, D. K., Bienayme, O., Robin, A. C., Creze, M., Mohan, V., 1996, A&A, 311, 456
- Rauscher et al. (1998) Rauscher, B.J., Lloyd, J.P., Barnaby, D. et al., 1998, ApJ, 506, 116
- Racine (1991) Racine R., 1991, AJ, 101, 865
- Reid & Majewski (1993) Reid, N., Majewski, S.R., 1993, ApJ, 409, 635
- Reitzel et al. (1998) Reitzel, D.B., Guhathakurta, P., Gould, A., 1998, AJ, 116, 707
- Rudy et al. (1997) Rudy, R. J., Woodward, C. E., Hodge, T., Fairfield, S. W., & Harker, D. E. 1997, Nature, 387, 159
- Sackett et al. (1994) Sackett, P.D., Morrison, H.L., Harding, P., Boroson, T.A., 1994, Nature, 270, 441
- Sackett (1997) Sackett, P.D., 1997, ApJ, 483, 103
- Sackett (1996) Sackett, P.D., 1996, IAU 173, Astrophysical Applications of Gravitational Lensing, eds. C. Kochanek and J. Hewitt, (Dordrecht: Kluwer), 165
- Saha (1985) Saha, A., 1985, ApJ, 289, 310
- Shaw & Gilmore (1989) Shaw, M., Gilmore, G., 1989, MNRAS, 237, 903
- Shang et al. (1998) Shang, Z. et al. 1998, ApJ, 504, L23
- Tonry & Schneider (1988) Tonry, J., Schneider, D. P., 1988, AJ, 96, 807
- Tonry et al. (1990) Tonry, J.L., Ajhar, E.A., & Luppino, G.A. 1990, AJ, 100, 1416
- Uemizu et al. (1998) Uemizu, K., Bock, J.J., Kawada, M. et al., 1998, ApJ, 506, L15
- (48) van der Kruit, P.C. & Searle, L., 1981a, A&A, 95, 105
- (49) van der Kruit, P.C. & Searle, L., 1981b, A&A, 95, 116
- van Dokkum et al. (1994) van Dokkum, P.G., Peletier, R.F., de Grijs, R., van der Kruit, P.C., 1994, A&A, 286, 415
- Wakamatsu & Hamabe (1984) Wakamatsu, K.-I., Hamabe, M., 1984, ApJS, 56, 283
- Yost et al. (2000) Yost, S.A., Bock, J.J., Kawada, M. et al., 2000, ApJ, 535, 644
- Zinn (1985) Zinn, R., 1985, ApJ, 293, 424
- Zheng et al. (1999) Zheng, Z. et al, 1999, AJ, 117, 2757
- Zepf et al. (2000) Zepf, S.E., Liu, M.C., Marleau, F.R., Sackett, P.D., & Graham, J.R., 2000, AJ, 119, 1701