The X-ray Spectra of VY Scl Stars Are Not Blackbodies
Abstract
Using ASCA data, we find, contrary to other researchers using ROSAT data, that the X-ray spectra of the VY Scl stars TT Ari and KR Aur are poorly fit by an absorbed blackbody model but are well fit by an absorbed thermal plasma model. The different conclusions about the nature of the X-ray spectrum of KR Aur may be due to differences in the accretion rate, since this star was in a high optical state during the ROSAT observation, but in an intermediate optical state during the ASCA observation. TT Ari, on the other hand, was in a high optical state during both observations, so directly contradicts the hypothesis that the X-ray spectra of VY Scl stars in their high optical states are blackbodies. Instead, based on theoretical expectations and the ASCA, Chandra, and XMM spectra of other nonmagnetic cataclysmic variables, we believe that the X-ray spectra of VY Scl stars in their low and high optical states are due to hot thermal plasma in the boundary layer between the accretion disk and the surface of the white dwarf, and appeal to the acquisition of Chandra and XMM grating spectra to test this prediction.
1 Introduction
Cataclysmic variables (CVs) are a diverse class of semidetached binaries including novae, dwarf novae, and novalike variables, composed typically of a low-mass main-sequence secondary and a white dwarf. With the exception of novae in outburst, the engine for all CVs is the release of gravitational potential energy as material accretes onto the white dwarf. In nonmagnetic systems accretion is mediated by a disk, and simple theory predicts that half of the gravitational potential energy of the accreting material is liberated in the disk and half is liberated in the boundary layer between the disk and the surface of the white dwarf, with luminosities , where is the mass-accretion rate and and are respectively the mass and radius of the white dwarf. When is low (e.g., dwarf novae in quiescence), the boundary layer is optically thin and quite hot (of order the virial temperature keV); when is high (e.g., novalike variables and dwarf novae in outburst), the boundary layer is optically thick and quite cool (of order the blackbody temperature eV). In the context of this theory, high- CVs are X-ray sources only because the upper “atmosphere” of the boundary layer remains optically thin.
The observational picture of the X-ray emission of CVs was first sketched in the 1970s and has become clearer through the years as instruments with higher effective area, broader bandpass, and better spectral resolution have flown on X-ray satellites. Summaries of HEAO 1, Einstein, EXOSAT, and ROSAT investigations are provided by Córdova, Jensen, & Nugent (1981); Córdova & Mason (1984); Eracleous, Halpern, & Patterson (1991); Mukai & Shiokawa (1993); Richman (1996); van Teeseling, Beuermann, & Verbunt (1996); and Verbunt et al. (1997). That the X-ray emission region of nonmagnetic CVs is compact and centered on the white dwarf is established directly by the X-ray light curves of eclipsing systems. That the X-ray spectra of CVs are due to hot thermal plasma was established by ASCA, which had the combination of large effective area, broad bandpass, and high spectral resolution needed to resolve the emission lines of K-shell Mg, Si, S, Ar, and Fe at high energies, and to establish the presence of emission lines of K-shell O and Ne and L-shell Fe at low energies (Nousek et al., 1994; Mukai, 2000; Baskill, Wheatley, & Osborne, 2001). As evidenced by EUVE light curves and spectra of the dwarf novae SS Cyg, U Gem, VY Hyi, and OY Car in outburst, the blackbody component of high- nonmagnetic CVs is typically not observed in the canonical X-ray bandpass (SS Cyg in outburst is the only clear exception, see Beuermann & Thomas 1993; Ponman et al. 1995; Mauche, Raymond, & Mattei 1995) because its temperature is too low and its luminosity is sometimes anomalously weak (Mauche, 2002, and references therein). While it is not yet possible to be entirely certain, the working hypothesis is that the X-ray spectra of all nonmagnetic CVs are due to hot thermal plasma in the boundary layer between the accretion disk and the surface of the white dwarf.
2 VY Scl Stars
Given this understanding, it is unsettling that the X-ray spectra of VY Scl stars have been repeatedly described as absorbed blackbodies. VY Scl stars are a class of novalike variables that occasionally dim by 3–5 mag in the optical; they are sometimes referred to as “anti-dwarf novae.” It is thought that the downward transitions of VY Scl stars are the result of temporary reductions in the mass-transfer rate from the secondary, possibly due to the passage of star spots over the point. VY Scl stars are more than oddities in the CV zoo. Livio & Pringle (1994) have proposed that the same mechanism that causes the intensity dips in VY Scl stars (with –4 hr) ultimately results in the –3 hr gap in the orbital period distribution of CVs. Leach et al. (1999) have proposed that the lack of dwarf nova outbursts in VY Scl stars in quiescence is the result of irradiation of the inner disk by the hot ( kK) white dwarfs known to exist in these systems. The white dwarfs in novalike variables should be similarly hot because of their relatively high average mass-accretion rates. Otherwise, novalike variables, VY Scl stars in their high states, and dwarf novae in outburst should all be quite similar. In particular, we expect that their X-ray spectra are produced by hot thermal plasma in the boundary layer between the accretion disk and the surface of the white dwarf.
The first indication that the X-ray spectra of VY Scl stars might differ from other high- CVs was provided by Schlegel & Singh (1995), who found that the ROSAT PSPC spectra of the VY Scl stars MV Lyr and KR Aur are best described by absorbed blackbodies. Next, van Teeseling, Beuermann, & Verbunt (1996) published a figure showing that the ROSAT PSPC colors of the VY Scl stars TT Ari, KR Aur, BZ Cam, and MV Lyr lay in a region of parameter space inhabited by blackbodies (and highly absorbed thermal plasmas). Finally, Greiner (1998) concluded from a comprehensive study of ROSAT pointed and all-sky survey PSPC observations that the X-ray spectra of VY Scl stars in their high optical states are best described by absorbed blackbodies. Greiner fit the ROSAT PSPC spectrum of the brightest VY Scl star, TT Ari, with absorbed power law, thermal bremsstrahlung, Raymond-Smith thermal plasma, and blackbody models and obtained , 1.99, 1.87, and 1.67, respectively. Although noting that even the absorbed blackbody model fit was poor, Greiner advocated the blackbody interpretation of the ROSAT PSPC spectra of VY Scl stars as a class because it resulted in similar parameters for the brightest members of the class: blackbody temperatures –0.5 keV and emitting sizes of 50–120 m (hence fractional emitting areas ).
There are a number of problems with the conclusion that the X-ray spectra of VY Scl stars are blackbodies. First, it runs counter to our theoretical expectation that the X-ray emission of nonmagnetic CVs is due to hot thermal plasma. Second, the implied emitting areas are far smaller than any structure known in CVs. The area of the boundary layer , where is the vertical height of the boundary layer. As argued by Patterson & Raymond (1985), a lower limit to is the density scale height of the inner disk cm (Pringle & Savonije, 1979). Hence, the boundary layer fractional emitting area . It is theoretically possible to produce even smaller accretion spots by magnetically channeling the flow of material down to the white dwarf surface, but even in CVs with the highest magnetic field strengths (AM Her stars or polars, with –100 MG), the fractional emitting area (Mauche, 1999). If the spot sizes were this small in VY Scl stars, it would be hard to avoid flux modulations at the white dwarf spin period. Third, the blackbody temperatures are too high for a white dwarf accretor. With –0.5 keV, the implied local energy flux –, orders of magnitude greater than the Eddington rate: .
3 ASCA Observations
Given the apparent discrepancy between ROSAT observations and theory, we searched the ASCA archive for data to test the hypothesis that the X-ray spectra of VY Scl stars in their high optical states are blackbodies. We found two VY Scl stars in the archive: TT Ari and KR Aur, observed by ASCA on 1994 January 20/21 and 1996 March 6, respectively. By examining the AAVSO records, we determined that on the dates of the ASCA observations TT Ari was in a high optical state with , while KR Aur was in an intermediate brightness state with (whereas in its high and low states and , respectively). Therefore, the only high-state VY Scl star with data in the ASCA archive is TT Ari, but this is the brightest VY Scl star, so provides the most stringent test of the nature of the X-ray spectra of these high- nonmagnetic CVs. For completeness, we also analyzed the ASCA spectrum of KR Aur.
ASCA carries four co-aligned X-ray telescopes, two with gas scintillation imaging proportional counter (Gas Imaging Spectrometer; GIS) detectors and two with CCD (Solid-state Imaging Spectrometer; SIS) detectors (Tanaka, Inoue, & Holt, 1994). During both observations, all four instruments were operating normally, with the GIS detectors in standard PH mode. We screened the GIS data by excluding intervals during Earth occultations (up to above the horizon), passages through the South Atlantic Anomaly (SAA), and times of high background as indicated by the in-situ monitors. After screening, we obtained 18.5 ks and 21.6 ks of good GIS data for TT Ari and KR Aur, respectively. During the TT Ari observation, the SIS detectors were operated in 2-CCD clocking mode, switching between Faint and Bright data mode depending on the available telemetry rate. We applied a similar set of screening criteria (only differing in the details of the monitor counts used) to the SIS data, and further excluded data taken within of the bright Earth limb and 64 s of day/night and SAA transitions. After the screening, we obtained 17.5 ks of good SIS data for TT Ari. During the KR Aur observation, the SIS detectors were used in 1-CCD Faint mode throughout, and after a similar screening (but with limit for the bright Earth limb and 32 s for day/night and SAA transitions), we obtained 21.1 ks of good SIS data.
Next, we extracted source and background spectra for each detector for each observation. For TT Ari, source counts were extracted from circular regions centered on the source ( radius for the GIS, – radius for the SIS to stay within a single CCD chip), while background counts were extracted from adjoining source-free regions. Similar extraction regions could not be used for KR Aur because of the presence of faint sources near the VY Scl star. We therefore reduced the GIS source extraction region to radius, and used a local background region that avoids both KR Aur and the contaminating sources. For the SIS, we used a similar source extraction region as for TT Ari, but extracted background spectra from blank-sky observations, since a source-free local background region of sufficient size could not be defined. For the spectral responses of the instruments, we have taken GIS redistribution matrix v4.0, and generated SIS redistribution matrix and auxiliary response files using the standard (HEAsoft v5.1) software. For each observation, we co-added spectra and responses for the two GIS instruments into one set, and the two SIS instruments into another set. Finally, the SIS and GIS data sets were fit simultaneously after ignoring bad channels, grouping the channels to produce a minimum of 20 counts per channel, and restricting the energy range to 0.5–10 keV. Each data set was fit with three spectral models: a single-temperature blackbody, a single-temperature solar-abundance MEKAL thermal plasma, and a two-temperature solar-abundance MEKAL thermal plasma, all absorbed by a column density of neutral material. To account for known residual discrepancies between the SIS and GIS response functions, we allowed the absorbing column density to differ between the SIS and GIS.
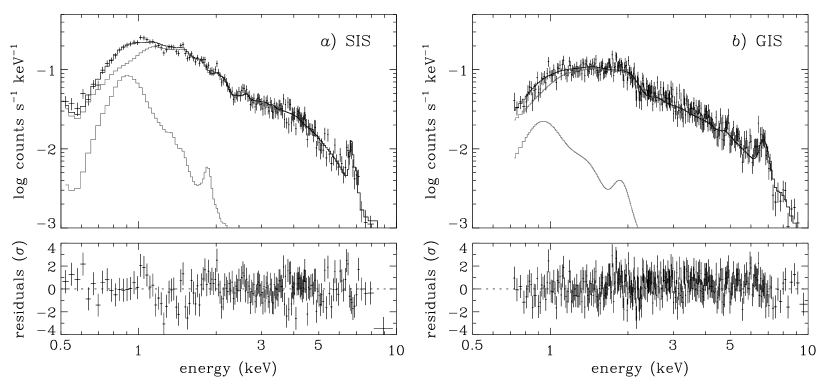
The best-fit parameters (and 90% confidence intervals for the thermal plasma models) resulting from these fits are shown in Table 1. The single-temperature blackbody model produces very poor fits ( and 2.24) to the 0.5–10 keV ASCA spectra of TT Ari and KR Aur because a blackbody produces too few counts both at high and low energies. Even worse fits are realized with the blackbody parameters –0.5 keV and – favored by fits to the ROSAT PSPC spectra of these stars. Far better fits ( and 0.75) are obtained with the same number of degrees of freedom with the single-temperature thermal plasma model. In particular, the Fe K line is clearly detected near 6.7 keV in the GIS data of both sources, which is decisive evidence for the presence of a hot (–10 keV) plasma. With two additional degrees of freedom, the two-temperature thermal plasma model further improves the fits—by a significant amount in TT Ari (, ), and by a modest amount in KR Aur (, )—by better accounting for systematic residuals at low energies. The best-fit two-temperature thermal plasma model is shown in Figure 1 superposed on the SIS and GIS spectra of TT Ari.
4 Summary
Based on an analysis of ASCA SIS and GIS spectra, we find that the 0.5–10 keV X-ray spectra of TT Ari and KR Aur are poorly fit by an absorbed blackbody model but are well fit by an absorbed thermal plasma model. The TT Ari spectra are adequately described by a two-temperature solar-abundance thermal plasma, with one component at keV and another at keV, with a relative emission measure of approximately 20:1 in favor of the high-temperature component. The lower-quality KR Aur spectra are adequately described by a single-temperature solar-abundance thermal plasma with keV, and allow a second temperature component only if the column density is significantly increased and the emission measures of the two components are comparable. These results should be understood to be simply parameterizations of the X-ray spectra of these two stars, not a definitive determination of the nature of their X-ray spectra. Higher-quality data (e.g., Chandra High-Energy Transmission Grating and XMM Reflection Grating Spectrometer and European Photon Imaging Camera spectra) are required to determine—by resolving the L-shell emission lines of Fe and the K-shell emission lines of H- and He-like ions of abundant elements from C to Fe—the true emission measure distribution, abundances, density, and Doppler broadening of the plasma in these stars. It is clear, however, that the X-ray spectra of neither of these stars is that of a blackbody, contrary to the conclusions of Schlegel & Singh (1995) and Greiner (1998). The different conclusions about the nature of the X-ray spectrum of KR Aur may be due to differences in the accretion rate, since this star was in a high optical state during the ROSAT observation, but in an intermediate optical state during the ASCA observation. TT Ari, on the other hand, was in a high optical state during both observations, so directly contradicts the claim that the X-ray spectra of VY Scl stars in their high optical states are blackbodies. It remains possible that TT Ari, the brightest VY Scl star, is anomalous, and that the X-ray spectra of other high-state VY Scl stars are blackbodies, but based on theoretical expectations and the ASCA, Chandra, and XMM X-ray spectra of other high- nonmagnetic CVs, we believe that they are not. Instead, we believe that the X-ray spectra of VY Scl stars in their low and high optical states are due to hot thermal plasma in the boundary layer between the accretion disk and the surface of the white dwarf, and appeal to the acquisition of Chandra and XMM grating spectra to test this prediction.
References
- Baskill, Wheatley, & Osborne (2001) Baskill, D. S., Wheatley, P., & Osborne, J. 2001, MNRAS, 328, 71
- Beuermann & Thomas (1993) Beuermann, K., & Thomas, H.-C. 1993, Adv. Space Sci., 13, 115
- Córdova, Jensen, & Nugent (1981) Córdova, F. A., Jensen, K. A., & Nugent, J. J. 1981, MNRAS, 196, 1
- Córdova & Mason (1984) Córdova, F. A., & Mason, K. O. 1984, MNRAS, 206, 879
- Eracleous, Halpern, & Patterson (1991) Eracleous, M., Halpern, J., & Patterson, J. 1991, ApJ, 382, 290
- Greiner (1998) Greiner, J. 1998, A&A, 336, 626
- Leach et al. (1999) Leach, R., Hessman, F. V., King, A. R., Stehle, R., & Mattei, J. 1999, MNRAS, 305, 225.
- Livio & Pringle (1994) Livio, M., & Pringle, J. E. 1994, ApJ, 427, 956
- Mauche (1999) Mauche, C. W. 1999, in Annapolis Workshop on Magnetic Cataclysmic Variables, ed. C. Hellier & K. Mukai (San Francisco: ASP), 157
- Mauche (2002) Mauche, C. W. 2002, in Continuing the Challenge of EUV Astronomy: Current Analysis and Prospects for the Future, ed. S. Howell, et al. (San Francisco: ASP), in press (astro-ph/0109133)
- Mauche, Raymond, & Mattei (1995) Mauche, C. W., Raymond, J. C., & Mattei, J. A. 1995, ApJ, 446, 842
- Mukai (2000) Mukai, K. 2000, New Astr. Rev., 44, 9
- Mukai & Shiokawa (1993) Mukai, K., & Shiokawa, K. 1993, ApJ, 418, 863
- Nousek et al. (1994) Nousek, J. A., et al. 1994, ApJ, 436, 19
- Patterson & Raymond (1985) Patterson, J. & Raymond, J. C. 1985, ApJ, 292, 550
- Ponman et al. (1995) Ponman, T. J., et al. 1995, MNRAS, 276, 495
- Pringle & Savonije (1979) Pringle, J. E., & Savonije, G. J. 1979, MNRAS, 187, 777
- Richman (1996) Richman, H. R. 1996, ApJ, 462, 404
- Schlegel & Singh (1995) Schlegel, E. M., & Singh, J. 1995, MNRAS, 276, 1365
- Tanaka, Inoue, & Holt (1994) Tanaka, Y., Inoue, H., & Holt, S. S. 1994, PASJ, 46, L37
- van Teeseling, Beuermann, & Verbunt (1996) van Teeseling, A., Beuermann, K., & Verbunt, F. 1996, A&A, 315, 467
- Verbunt et al. (1997) Verbunt, F., Bunk, W. H., Ritter, H., & Pfeffermann, E. 1997, A&A, 327, 614
| SIS | GIS | ||||||
|---|---|---|---|---|---|---|---|
| Model | (keV) | aaNormalization expressed as luminosity for the blackbody model and emission measure for the MEKAL model, both for a fiducial distance of 100 pc. | (keV) | aaNormalization expressed as luminosity for the blackbody model and emission measure for the MEKAL model, both for a fiducial distance of 100 pc. | |||
| TT Ari | |||||||
| Blackbody | 0 | 0 | 0.70 | E31 | |||
| 1T MEKAL | E20 | E19 | E53 | ||||
| 2T MEKAL | E21 | E20 | E53 | E52 | |||
| KR Aur | |||||||
| Blackbody | 0 | 0 | 0.61 | E30 | |||
| 1T MEKAL | E20 | E20 | E53 | ||||
| 2T MEKAL | E21 | E21 | E53 | E53 | |||