Chandra Discovery of a Tree in the X-ray Forest towards PKS 2155-304: the Local Filament?
Abstract
We present the first X-ray detection of resonant absorption from warm/hot local gas either in our Galaxy, or in the Intergalactic space surrounding our Galaxy, along the line of sight toward the blazar PKS 2155-304. The Chandra HRCS-LETG spectrum of this z=0.116 source clearly shows, at level, unresolved (FWHM km at a 2 confidence level) OVIIKα and NeIXKα resonant absorption lines at Å and Å (i.e. km s-1 in the rest frame, from the OVIIKα line). OVIIIKα and OVIIKβ from the same system are also detected at a lower significance level (i.e. ), while upper limits are set on OVIIIKβ, NeXKα and NeIXKβ. The FUSE spectrum of this source shows complex OVI2s→2p absorption at the same redshift as the X-ray system, made by at least two components: one relatively narrow (FWHM km s-1) and slightly redshifted ( km s-1), and one broader (FWHM km s-1) and blueshifted ( km s-1). We demonstrate that the physical states of the UV and X-ray absorbers are hard to reconcile with a single, purely collisionally ionized, equilibrium plasma. We propose, instead, that the X-ray and, at least the broader and blueshifted UV absorber are produced in a low density intergalactic plasma, collapsing towards our Galaxy, consistent with the predictions of a Warm-Hot Intergalactic Medium (WHIM) from numerical simulations. We find that any reasonable solution requires overabundance of Ne compared to O by a factor of , with respect to the solar value. We propose several scenarios to account for this observation.
1 Introduction
The majority of the total baryonic matter in the local () Universe is predicted to be concentrated in highly ionized gas. Structures that are already virialized contain warm ( K) or hot (107 K) gas [the dense interstellar medium (ISM) of galaxies, and the intracluster medium (ICM) of clusters of galaxies]. The greater amount of baryonic matter is predicted to lie in, as yet unvirialized, matter in the form of a tenuous warm-hot intergalactic medium (WHIM, Hellsten et al., 1998). The detection and study of these components is needed for the proper understanding of large and small scale structures in the Universe. However, while X-ray emission from the virialized density peaks of the ICM and ISM has been detected and intensively studied in X-rays, the predicted highly ionized gas in the WHIM has been poorly studied so far, due to instrumental limitations. The low density of the WHIM leads to low emissivity, so that studies of the WHIM in emission are a formidable challenge. However, absorption depends only on the total column density of the medium, not on density, and background light sources in the form of quasars (Aldcroft et al., 1994) and gamma-ray bursts (Fiore et al. 2000) are readily available. A few high ionization transitions, notably OVI 1031.93, lie in the UV, but the most prominent ions (CVI, OVII, OVIII, NeIX) have their strongest transitions in the soft X-ray band (10-40 Å) for a wide range of temperatures ( K, Nicastro et al., 1999), which should give rise to an “X-ray Forest” of absorption lines (e.g. Perna & Loeb, 1998, Fang & Canizares, 2000). The advent of high resolution (1000) soft X-ray spectroscopy with Chandra and XMM-Newton allows sensitive studies of the WHIM possible.
Interstellar OVI was first detected in the UV with the Copernicus satellite (Jenkins, 1978a, 1978b, and York, 1977), but only recently has data from the Far Ultraviolet Spectroscopic Explorer (FUSE) satellite shown the presence of extragalactic OVI intervening absorpion (e.g. Tripp et al., 2001, Sembach et al., 2000).
In this paper we present the first X-ray detection of highly ionized absorption along the line of sight towards the blazar PKS 2155-304, with the Chandra HRCS-LETG (High Resolution Camera Spectrometer-Low Energy Transmission Grating: Brinkman et al., 2000). We argue that the physical and dynamical conditions implied by these lines require an extragalactic, low density, origin. Hence these lines are the first detection of the X-ray Forest.
2 Spectral Fitting
The bright z=0.116 blazar PKS 2155-304 (Falomo, Pesce, & Treves, 1993) is a calibration source for both the high energy and low energy resolution gratings of Chandra, and has been observed several times with all the possible grating-detector configurations. The longest of these observation lasted ks, for a total net good-time exposure of 62.7 ks, and was performed with the HRCS-LETG configuration on 1999 December 25. In the public Chandra data archive 111http://asc.harvard.edu/cda/ we found two more HRCS-LETG observations of this source, performed on 2000 May 31, and 2001 April 6, with net exposures of 25.8 ks and 26.6 ks respectively.
We retrieved the primary and secondary data products (Fabbiano et al., 2001, in prep.) of these three Chandra HRCS-LETG observations of PKS 2155-304, and reprocessed their event files with the CIAO (Elvis et al., 2001, in prep.) software (v. 2.1.3) using the most up-to-date calibration files as of 2001 August (CALDB v. 6.2) to extract source and background spectra and corresponding 1st-order Anciliary Response Files (ARFs) and Redistribution Matrices (RMFs) according to the on-line data analysis “threads” provided by the Chandra X-ray Center (CXC) 222http://asc.harvard.edu/ciao/documents_threads.html .
During the long 1999 December observation the source was at the particularly high flux level of 21 mCrab, with a 0.3-6 keV flux of erg s-1 cm-2. In both the subsequent HRCS-LETG observations, instead, the flux level of PKS 2155-304 was more normal at about 6 mCrab in the 0.3-6 keV band. However, despite the large change in flux, the spectral shape of the underlying 0.3-6 keV continuum did not change significantly between or during the three observations (using simple power law continuum models, we measured variations in the spectral slope to be less than at 90 % confidence level). To increase the signal to noise ratio of our data, we then coadded the three HRCS-LETG spectra and averaged the corresponding ARFs, weighting them by the respective exposure times. The result (Figure 1a) is one of the highest quality Chandra grating spectra so far for an extragalactic source, with some 600 counts, or a signal to noise ratio of about 25, per resolution element (R, FWHM 660 km s-1 at 20 Å) in the continuum, over the entire 10-25 Å wavelength ( keV) range.
To ensure a self-consistent analysis, and because of the times higher spectral resolution provided, we also retrieved the FUSE (Moos et al., 2000) data of PKS 2155-304 from the FUSE public archive, extracted the fluxed spectrum, and analyzed the wavelength range around OVI (1027-1035 Å) and OI (1037-1040 Å) to obtain independent estimates of the positions, widths and equivalent widths of the local OVI and OI3s→3p() components, recently discovered and published by Savage et al. (2000) and Sembach et al. (2000). The FUSE observation was taken with the LWRS aperture () with a total exposure time of 38.6 ks, and covers the entire 980-1180 Å range. We used data from the LiF mirror and the A1 detector segment, which have optimal efficiency in the waveband around the OVI line. The data were calibrated and cleaned following the procedures presented in the FUSE Data Analysis Cookbook (v. 1.0, Sankrit et al., 2001). The resolution of the final data is km s-1.
We performed simultaneous spectral fitting of both the fluxed FUSE data and the responses-folded Chandra HRCS-LETG data, using the Sherpa (Siemiginowska et al., 2001, in prep.) package for spectral fitting in CIAO. In the following two sections we summarize our results.
2.1 X-ray Spectral Fitting
For sources of a few mCrab the inherent order confusion problem of the Chandra HRCS-LETG (Brinkman et al., 2000) is important only at Å. Furthermore, narrow features, such as absorption lines, are not in any case seriously affected. So we limited our spectral analysis to the shorter wavelengths of 11-24 Å ( keV) range, allowing us to use only the 1st-order RMFs and ARFs, to fit our spectra. Errors throughout the paper are quoted at a 90 % confidence level, for 1 interesting parameter.
To model the 11-24 Å portions of the continuum of PKS 2155-304, we used a power law attenuated by an equivalent hydrogen column density of cm-2 neutral gas to account for the measured Galactic absorption from cold gas along the line of sight to this source (Dickey & Lockman, 1990) 333Due to the high degree of saturation of the Galactic disk , the local damped Ly absorption line in the HST-STIS spectrum of PKS 2155-304 cannot provide a better estimate of the Galactic column of neutral H along this line of sight. . The model used for the neutral absorber includes only photoelectric edges by neutral elements, and so does not account for resonant absorption lines from the same elements. We obtained a statistically acceptable fit with a power law photon index of , consistent previous results (e.g. Kataoka et al., 2000).
The residuals to this fit clearly show (at a significance level greater than 8 ) two strong and unresolved (see §3.1) features in absorption (Fig. 1b,d), at wavelengths consistent with the OVIIKα and the NeIXKα resonant lines at zero velocity, plus a third intense OI1s→2p resonant absorption line from gaseous OI (Fig. 1c). Negative residuals are also present at the energy of the instrumental resonant molecular OI absorption line (Fig. 1c). The residuals around the expected OVIIIKα and the OVIIKβ rest-frame wavelengths also show absorption features at a lower () significance level (Fig. 1e, see §3.1). We added six negative gaussians to our continuum model, and refitted the data, leaving the positions and the total flux of all the gaussians free to vary independently, but linking all the widths (in units of km s-1) of the high ionization resonance lines from O and Ne.

The best fitting line parameters values are listed in Table 1, along with the derived ion column densities for all the atomic transitions. We also include in table 1 2 upper limits on the equivalent widths of the two lines of NeXKα and NeIXKβ, which we derived by adding two more gaussians to our model, freezing their positions to the rest-frame wavelengths of these transitions and calculating the errors on the lines’ normalizations.
| Line Id. | FWHM | EW(abs)a | Nion | |||
| (Å) | (km s-1) | (km s-1) | (eV) | ( cm-2) | ||
| FUSE | ||||||
| OVI | ||||||
| OVI | ||||||
| Chandra | ||||||
| OVIIKα | ||||||
| OVIIIKα | FWHM(OVII | |||||
| OVIIKβ | FWHM(OVII | |||||
| NeIXKα | FWHM(OVII | |||||
| NeXKα | 12.134b | 0b | FWHM(OVII | |||
| NeIXKβ | 11.5467b | 0b | FWHM(OVII | |||
| OI() | -() | |||||
| OI(molecular) | NA | -() |
a Absorption line EW are formally negative; here we drop the sign. b Frozen. c Krause, 1994.
The strong solid-state instrumental OI line at Å (Fig. 1a,c), is only partly accounted for by the current effective area model (Fig. 1c, dashed curve; see also Table 1) and is easily separated by the HRCS-LETG from the gas phase OI1s→2p resonant transition at Å (Krause, 2001), which is also clearly visible in our data (Fig. 1c), and will be object of study of a forthcoming paper. Here we stress only how the intervening Galactic cold absorber is clearly distinguished from the highly ionized intervening medium seen through the He-like and H-like resonant lines from O and Ne (Table 1; see also §3.1 for differences in the dynamics).
2.2 UV Spectral Fitting
We also used Sherpa to fit the 1027-1035 Å portion of the FUSE spectrum of PKS 2155-304 around the strongest line of the OVI2s→2p doublet, at Å. Residuals after a fit with a power law continuum model, show resolved OVI2s→2p absorption in these data, with at least two components present (Figure 2). We added two negative gaussians to our best fit continuum model. The fit shows that one line is relatively narrow (FWHM km s-1) and slightly redshifted ( km s-1 in the rest frame), and the other is broader (FWHM km s-1) and blueshifted ( km s-1; see Table 1). These values are consistent with those reported by Savage et al. (2000) and Sembach et al. (2000).

We looked for Ly absorption associated with these two components, but verified that they both would fall well within the Voigt wings of the damped Ly due to cold absorption in our own Galaxy, and are so not visible.
The FUSE spectrum of PKS 2155-304 also shows the presence of strong OI3s→3p() absorption (see Figure 1 in Sembach et al., 2000). For this line we measure ( km s-1) and FWHM of km s-1, much narrower than the width of either of the OVI3s→3p components.
3 Analysis of Absorption Lines
3.1 Gas Dynamics

To intercompare the dynamics of the gas producing the detected absorption lines, figure 3 shows their residuals, in velocity space, from the FUSE and Chandra spectra to their best fitting continuum models. Zero velocities in this diagram correspond to the rest frame wavelengths of the detected transitions (Verner et al., 1996, Krause, 1994). The spectral resolution of the HRCS-LETG (R, FWHM 660 km s-1 at 20 Å) does not resolve the high ionization X-ray absorption lines (see Table 1).
The spectral resolution of the FUSE spectrometer (, FWHM 20 km s-1 at Å) is more than one order of magnitude larger than that of the Chandra HRCS-LETG, and is sufficient to resolve the OVI2s→2p absorption into at least two components (Figure 3a; Table 1). The total width of the OVI2s→2p complex in the FUSE spectrum is FWHM=264 km s-1, fully consistent with the upper limit on the width of the high ionization X-ray lines (Table 1). We also note that both position and width of the OI3s→3p() absorption line in the FUSE spectrum, are clearly different from widths and positions of each of the two OVI components in the same spectrum (Fig. 3a,f), but again fully consistent with width and position of the OI line in the Chandra spectrum (Fig. 3f,c, Table 1).
We then conclude that: (a) the high ionization lines, both in the UV and X-rays are likely to be produced by gas with similar dynamical properties, and broad range of dispersion velocities (from the UV profile), while (b) the low ionization atomic OI lines (both in FUSE and Chandra) are produced by a slow-moving cloud of cold gas, with relatively low internal dispersion velocity, and so differs dramatically in both physical and dynamical properties from the high ionization gas.
In the following we discuss only the highly ionized component.
3.2 Curve of Growth Analysis
Absorption lines equivalent widths (EWs), and their ratios, can in principle provide invaluable information on the physical state of the gas, and allow one to distinguish between quite different scenarios. However these diagnostics can only be applied to unsaturated lines. Fortunately the UV OVI2s→2p lines are clearly not saturated, since the ratio between the EWs of the doublet ( Åand Å), is fully consistent with the oscillator strengths (OSs) ratio of 2 (Savage et al., 2000). For the X-ray lines of OVII, OVIII and NeIX, in principle, one could compare the EWs of the corresponding K and K lines. However, the errors on the EWs of the K lines from these ions are too large. An alternative approach uses the Curve of Growth (CoG; e.g. Spitzer, 1978), computed for a given Doppler parameter, to see whether each line falls on the linear branch of the CoG. We ran our model for resonant absorption (Nicastro, Fiore and Matt, 1999) to produce CoGs for the OVI, the OVIIKα, the OVIIIKα doublet, and the NeIXKα. We assume a Doppler parameter of b=200 km s-1, since this is the observed of the OVI2s→2p complex. The CoGs are plotted in Figure 4, along with the maximum possible measured EWs (best fit + 2) of each line (EWs are plotted in absolute value). For the OVI complex we considered the total EW from the two best fit gaussians. All the lines EWs fall well within the linear branches of their CoGs. Hence the lines are not saturated, and the resulting column densities, listed in Table 1, should be reliable. 444The partial covering and scattering effects that can occur when the absorbing material is close to the source, as in AGN “warm absorbers” and broad absorption lines (e.g. Arav et al., 2001), do not apply in this case, since PKS 2155-304 has z=0.116, while the absorbers are at their rest wavelengths, and so are physically well separated. .

4 Discussion
The FUSE and Chandra spectra of PKS 2155-304 contain absorption features from local intervening ionized gas that span a broad ionization interval, from neutral (OI), through mildly ionized (OVI, OVII), to highly ionized (OVII, OVIII and NeIX). The neutral and the ionized components have very different dynamical and physical properties and so must belong to two different, spatially separated, systems. The profile of the OVI complex in the FUSE spectrum suggests that the ionized component is also made up of at least two different absorbers: one slow-moving, with relatively low internal dispersion velocity and possibly associated with a cloud in the Galactic disk, and one moving towards us with a velocity of about 150 km s-1 ( km s-1 transforming from the Heliocentric to the Galactic Standard of Rest frame 555http://nedwww.ipac.caltech.edu/forms/vel_correction.html ) and with a similar internal dispersion velocity and possibly associated either with an ionized high velocity cloud in the Galactic halo, or with a WHIM filament.
In the next sections we demonstrate that neither pure collisional ionization nor pure photoionization models can account for the presence of strong OVII and NeIX absorption with the observed intensity of the OVI lines, unless the three absorbers (one X-ray and the two UV) are associated with three different Galactic clouds with drastically different equilibrium conditions (with temperatures differing by an order of magnitude), and so locations. Alternatively we show that if there is one highly tenuous absorber, then the photoionization contribution by the diffuse X-ray background becomes important and can change the internal ion abundance distribution to account for all the UV and X-ray observational constraints in a single absorbing medium. These solutions however, imply path lengths of the order of several Mpc, and so definitively locate the UV-X-ray absorber in the intergalactic medium (IGM), beyond our Galaxy on a scale of the Local Group, or somewhat bigger.
4.1 The XRB Contribution
For the photoionization contribution by the diffuse, extragalactic X-ray background, we adopt an EUV to -ray Spectral Energy Distribution [i.e. the specific flux ] given by a broken power law with an exponential high energy cutoff (i.e. , with for , for , , , keV, and keV; we also adopt a low energy cutoff at energies lower than the hydrogen ionization threshold ). We assume a normalization of 10 ph s-1 cm-2 keV-1 sr-1, at 1 keV (Parmar et al., 1999, Boldt, 1987, and Fabian & Barcons, 1992). Following the Hellsten et al. (1998) parameterization for the redshift evolution of the X-ray background, we can write the ratio between the diffuse background ionizing photons density and the electron density of a filaments at redshift z (i.e., the ionization parameter U) as:
| (1) |
where is the frequency of the H ionization threshold.
In eq. 1 we defined the local IGM overdensity compared with the mean density of the Universe, , as , where cm-3 (Hellsten et al., 1998). Hence, for typical overdensities of (Hellsten et al., 1998, Davé et al., 2000), we expect, at any redshift, , for (Walker et al., 1991; h = 0.5). Given the flat X-ray spectrum of the X-ray background, XRB photoionization greatly modifies the ionic distribution of a purely collisionally ionized gas at temperatures lower than logT , for electron densities of cm-3 (). Photoionization is not important at typical ISM densities of to 1 cm-3 (e.g. Spitzer, 1990; but see §4.5 for alternative ionizing sources).
4.2 Models
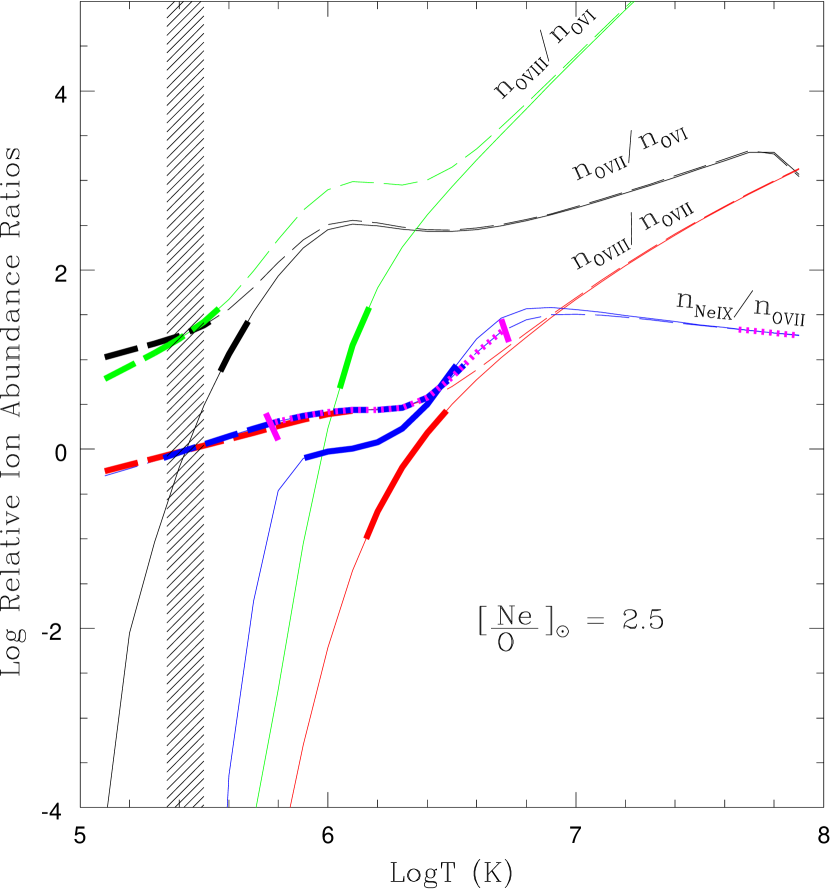
We ran CLOUDY (vs. 90.04, Ferland, 1997) to build models for temperatures (in K) from logT = and densities cm-3. Figure 5 shows the ratios between the predicted ionic abundances of OVII/OVI (black curves), OVIII/OVI (green curves), OVIII/OVII (red curves) and NeIX/OVII (blue curves). Solid curves are for cm-3, while long-dashed curves correspond to cm-3 (i.e. ). The thick sections of the lines delimit the 2 allowed intervals given the measured relative ion column densities derived from the corresponding EWs (see Table 1), using the formula - valid only when the lines are not saturated - (Nicastro, Fiore, & Matt, 1999), where is the relative abundance of the element X, compared to H, and is the relative density of the ion of the element . Figure 5 uses the total measured EW for the OVI2s→2p complex (i.e. narrow and broad components combined).
According to the above formula, the ratio between equivalent widths of two lines from two different ions of the same element, then, depends only on the ratio of the corresponding equivalent widths. Instead, for ions from different elements, the relative ion densities are proportional to the inverse of their relative metallicity (i.e. ). For the NeIX/OVII ratio (blue lines) we show allowed regions for a solar Ne/O ratio (magenta, dotted line, delimited by perpendicular tickmarks) and for 2.5 times solar ([Ne/O], Grevesse & Anders, 1989, Grevesse & Noels, 1993. Blue, dashed line). This values are discussed in §4.3.
4.3 Galactic versus Extragalactic Origin
Let us consider first the Galactic “high-density” solutions, for which the gas is in pure collisional ionization equilibrium. The ratio of OVIIKα to the entire OVI2s→2p UV complex (thick solid black curve) sets a quite stringent upper limit of logT (T in K) on the allowed temperature of the OVI-OVII absorber, if both the lines are produced by the same material. However, the OVIII and NeIX ions are clearly too highly populated to be consistent with the intensities of the OVI and OVII lines, requiring logT, and so no common solution exists for all the lines. We find that this is true for any cm-3.
Let us now consider the extreme extragalactic “low-density” (cm-3) solution (Fig. 5, thick long-dashed curves) where photoionization by the diffuse XRB overionizes the medium. These conditions allow the oxygen OVI, OVII, and OVIII ions to have a common temperature (shaded region in Fig. 5) for the relatively low temperature range logT . A consistent solution for even the oxygen lines, requires the absorber to be highly tenuous ( cm-3). A solar Ne/O ratio (magenta, dotted intervals) is not consistent with these conditions, but a Ne/O ratio of times solar (blue, dashed interval) provides consistency for all the ions (see §4.7). Increasing the Ne/O metallicity ratio decreases the NeIX/OVII relative density ratio estimated from the corresponding measured EW ratio - see §4.2 - and so lets the thick intervals in Figure 5 shift toward the left on the theoretical curve, down to the region where a common solution for all the ions can be found.
For a given temperature, we can derive the equivalent H column density of this gas. Assuming Ne/O = 2.5 and logT = 5.45 gives cm-2. This translates, for a constant electron density of cm-3, to a linear size of the absorbing cloud of gas of Mpc, consistent with a filament with an overdensity of located in the intergalactic medium near to our Galaxy. For O abundances of 0.3 (as found in clusters of galaxies, Sarazin, 1988) the size would increase to Mpc ( % of the distance to PKS 2155-304, and % of the distance to the first group of galaxies close to our line of sight to the blazar: Penton Stocke, & Shull, 2000).
4.4 Multi-Component Solutions
The above discussion is based on the hypothesis that both the broad and narrow components of the OVI absorption complex are produced by a single, structured, absorber that is also producing the X-ray absorption. Here we explore alternative multi-component solutions.
Let us suppose that only one of the two OVI2s→2p absorption lines in the UV spectrum, is associated with the X-ray absorber. The broader OVI line contributes about 1/3 to the total observed equivalent width from the OVI system, while the remaining 2/3 are provided by the narrower line (see Tab. 1). Based on the strengths of the OVI2s→2p lines and on the above discussion, it is then natural to associate the broader UV component with the X-ray absorber. In this case the narrow and more intense OVI component would be produced by a Galactic cloud of moderately ionized gas in collisional equilibrium. This “narrow” line gas must have a temperature of logT if the size of the cloud is not to exceed 1 kpc, the size of a big halo cloud (e.g. Spitzer, 1990), given the measured EW and assuming a maximum Galactic ISM density of cm-3. The upper limit on the temperature, instead is set by the observed EW(OVI/EW(OVIIKα) ratio, and this gives logT.
The second absorber should instead produce the broader and weaker OVI line, and all the X-ray lines. We tested this hypothesis by building a diagram similar to that in Fig. 5, but considering a variable fraction (from 0 to 1) of the EW of the broad OVI2s→2p line (Figure 6). We find that equilibrium, high density solutions exist only if a fraction of 5 to 25 % (at 2) of the broad OVI line is produced by the same gas producing the X-ray absorption. These solutions are limited to a range of temperatures around logT=6.4, whose width depends on the relative [Ne/O] abundance: for [Ne/O] (dashed regions in Fig. 6). For logT = 6.4 and [Ne/O], we find , and so a linear size of pc, for cm-3.

Since only 25 % of the broad OVI2s→2p can come from X-ray absorbing gas, a third ad hoc Galactic absorber similar in dynamical properties to the absorber imprinting the broad OVI2s→2p line, but with temperature differing by at least an order of magnitude from the temperature of the UV-X-ray absorber, is required to explain the remaining broad OVI absorption. Alternatively, a highly structured and, again, ad hoc multi-temperature plasma, with at least two zones separated by a sharp front, and with the same kinematics, would be needed to account for all the observed UV and X-ray lines. We can broaden the range of allowed temperature and increase the fraction of OVI absorption produced by the X-ray absorber, by allowing both the Ne/O ratio to be supersolar, and the gas density to be lower than cm-3. However this converges to the extragalactic solution (§5.2). We find that an acceptable solution with a minimum size is obtained for logT = 5.7, (i.e. ), and Ne/O = 2, which gives cm-3 and Mpc.
4.5 Alternative Photoionizing Sources
As we have demonstrated (§4.1, 4.3) X-ray photoionization is needed to modify the ion relative abundance distribution from the pure collisionally ionized case (with logT = 5.3-5.7), to allow for the simultaneous presence of OVI, OVII and OVIII, and also NeIX. In order for the photoionization contribution to play a significant role, the ionization parameter has to be of the order of (§4.1). Since the ionization parameter. , is simply the ratio between the number density of ionizing photons and the electron density of the gas, increases as either the electron density in the gas decreases (as in the IGM case) or the distance between the source of ionizing photons and the gas cloud decreases. So high values of U might also be reached in gas with typical ISM densities (i.e. cm-3) illuminated by other, discrete and locally much brighter hard X-ray sources than the XRB. In this section we explore this second possibility.
4.5.1 Isotropic Nearby Source
Based on the needed value of we can put constraints on the brightness of the ionizing source as seen by us, and on the angular separation between the source and the gas cloud. Let us consider an intervening cloud of gas located at a distance from us, along a given line of sight, and an ionizing source, located at a distance from us. Let be the distance between the ionizing source and the gas cloud. We can write: (a) ; (b) ; and (c) . In the above equations, is the source luminosity, and and are the source fluxes as seen by us and the gas cloud respectively. These two fluxes are related to each other through the source-gas angular separation : . The ionization parameter U at the illuminated face of the cloud can then be written as a function of the source flux as seen by us: , where is the total flux of ionizing photons (). To maximize the contribution from hard X-ray ionizing photons we use as the ionizing continuum a cutoff power law with from the H ionization threshold up to 100 keV, and from 100 keV up to infinity. This gives a total flux of ionizing photons of ph s-1 (where is the observed flux between 2 and 10 keV, and we assumed ). Our value then gives: . For arcmin and gas densities in the ISM range cm-3, then, the 2-10 keV observed flux must be as large as erg s-1 cm-2 ( Crab), to efficiently ionize the gas. For a 30 times smaller separation, this fluxes reduce to erg s-1 cm-2 ( Crab). No such source is currently seen.
For halo distances of 30 kpc the implied 2-10 keV luminosities are erg s-1 ( pc), far too large for any known stellar-size Galactic source, and erg s-1 ( pc), just about the maximum observed luminosity for the most luminous known Ultra-Luminous-X-ray sources (ULXs) or beamed microquasars. For the much closer distances of Galactic disk objects, say, 10 pc, these luminosities reduce to more normal values for X-ray binaries (i.e. erg s-1, and erg s-1) but the physical separations between the source and the gas cloud become very small: pc and pc respectively. So, either very luminous sources, or very close source-to-gas systems are needed to efficently ionize a tenuous gas cloud in our Galaxy to the observed degree.
We searched the ROSAT-WGACAT (White, Giommi, & Angelini, 1994) for bright X-ray sources in a 30 arcmin radius cylinder, centered on the line of sight to PKS 2155-304. We found 33 unidentified sources plus an F0 star with ROSAT-PSPC count rates between 0.0019 and 0.024 ct s-1, and angular distances from the line of sight from to arcmin. The closest of these sources to the PKS 2155-304 line of sight has a count rate of 0.0073 (source A: 1WGA J2158.8-3011), while the brightest (0.025 ct s-1) is at a distance of 15.1 arcmin (source B: 1WGA J2158.2-3000). We used PIMMS 666http://legacy.gsfc.nasa.gov/Tools/w3pimms.html to convert these count rates, into flux. To maximize the possible contribution at energies E keV, we assumed a hard X-ray continuum (a powerlaw with ) heavily absorbed by a column of cm-2 intrinsic neutral gas. This gave 2-10 keV fluxes of erg s-1 cm-2 ( Crab), for source A, and erg s-1 cm-2 ( Crab) for source B, at least (i.e. using cm-3) 4 and 5 orders of magnitude, respectively, lower than the values required to photoionize the gas at these angular separations.
4.5.2 Beamed Nearby Source
Let us consider a microquasar highly beamed into the direction of the gas cloud,and whose line of sight to us is somewhat perpendicular to the beam direction. The probability for a microquasar to be beamed in the direction of the gas cloud, and located within a 20-130 pc radius sphere from the gas cloud, depends on the distribution of the parent poulation, that, for microquasars, is largely unknown. We can compute here the minimum beaming factor needed, in the above optimal geometrical configuration, for source A or B to efficiently ionize a cloud of gas along the line os sight to PKS 2155-304. The luminosity amplification due to beaming, in the direction of the jet, is given by: . The observed luminosity along a perpendicular direction is insted de-boosted by the factor: (Urry & Shafer, 1984). In the above equations, is the source intrinsic luminosity, is the Lorentzian factor, and (Urry & Shafer, 1984). Solving for the intrinsic luminosity, and using as maximum value for the beamed luminosity of a microquasar erg s-1 and the observed value of erg s-1 (for source B, at 30 kpc), we obtain a minimum relativistic factor of , to compare with the estimated upper limit of for the microquasar GRS 1915+105 (Mirabel & Rodriguez, 1999). Any deviation from the above ideal geometry, would give a much larger Lorentz factor.
4.5.3 Historical Nearby Source
Low density gas has long recombination times. A source may thus have been much more luminous in the past and ionized the gas then, from which the gas has not yet recovered. Let us first suppose that the most luminous X-ray source we are currently seeing in the ROSAT archive is a binary system that went through a ULX phase (King et al., 2001) in the past (from the calculation in §4.5.1, for source A and B we need L(outburst)/L(now), respectively 777Such outbursts have been observed in X-ray novae between quiescent and active phases, e.g. Narayan, Garcia, & McClintock, 2001. ). The recombination time for the OVII-OVIII ions, in gas with electron density of cm-3 is of about years (Nicastro et al., 1999). Typical ULX phases are thought to last for years, and in our Galaxy the total estimated rate of ULXs is of 1 every years (King et al., 2001). So, allowing for a maximum delay of years, we may expect N = 2 ULXs in all the Galaxy over a period of years. Assuming, for the halo, a 30 kpc radius sphere, this gives a ULX density, over the same period, of n = kpc-3. So, the maximum number of ULXs expected over a period in a random pc radius sphere in our galaxy (the physical distances between sources A and B and the line of sight to PKS 2155-304, if both sources are put at 30 kpc from us, in the outskirts of the Galactic halo) is of , making prior ionization by a powerful transient source highly unlikely, albeit with a posteriori statistics.
4.5.4 Historical AGN at Galactic Center
A final possibility is that in the past the center of our Galaxy went through an AGN phase, producing far higher luminosities and photoionizing any low-density ( cm-3) clouds in the Galactic halo. At these densities we have years. Let us then suppose that less than years ago the black hole in the center of our Galaxy (Chakrabarty & Saha, 2001) was emitting at its Eddington luminosity of erg s-1. Assuming a typical Spectral Energy Distribution (SED) for AGN (Mathews & Ferland, 1987) this would produce an ionization parameter of at the surface of cm-2 halo clouds located at a distance D from the central AGN. To produce the observed line ratios, the photoionization contribution must be such that at the illuminated face of such a cloud of gas. This gives a distance for the gas cloud of kpc, consistent with the outermost size of the Galactic halo. This solution requires that all halo clouds would show UV and X-ray absorption with similar physical properties as those observed in PKS 2155-304. Using the much lower luminosities estimated by ASCA for the central AGN in our Galaxy about years ago (i.e. erg s-1, Koyama et al., 1996), gives distances of 1-5 kpc, well within the Galaxy’s halo, and therefore not consistent with the the galactic coordinates of PKS 2155-304 (given our distance of about 10 kpc from the Galactic center).
4.6 Properties of the WHIM Gas
From our analysis of the combined UV and X-ray data, we conclude that the X-ray absorption and at least the broad OVI2s→2p are likely to be produced in tenuous extragalactic medium, with cm-3. From the position of the OVI and assuming that the feature lies within a few Mpc from our Galaxy, the gas is falling toward our Galaxy with a bulk velocity of km s-1 (in the Galactic Standard of Rest frame). The feature has a dispersion velocity ( km s-1) comparable with the bulk velocity, and a temperature of logT. The implied overdensity is and the total linear size of the feature along our line of sight is about Mpc.
The Ne/O abundance can be reduced to Solar if we allow for inhomogeneities in the flow, since inhomogeneities increase the upper limits on both the temperature and the density, and so also decrease the lower limit on the linear size of the feature (from 3 Mpc to kpc). Such inhomogeneities may arise near our Galaxy halo, where the gas may mix with denser medium, cooling and producing part of the observed OVI absorption.
The above overdensities and linear sizes are consistent with those predicted for the WHIM by hydrodynamical simulations for the formation of structure in the local Universe (e.g. Hellsten, 1998), and in particular in our Local Group (Kravtsov, Klypin, and Hoffman, 2001). According to these simulations, the local IGM is concentrated in filaments with overdensities of connecting already virialized structured (galaxies and clusters of galaxies), that were shock-heated during the collapse of the density perturbations. The average sizes of these perturbations are of the order of 30-50 Mpc in the local Universe, but the total extent of the density peaks are usually not larger than a few Mpc. The velocities of the matter in these filaments, should be of the order of the proper motions of the virialized structures that they connect, km s-1. We note that these velocities are of the same order as those observed on the blue side of the structured and complex OVI2s→2p profile in the UV spectrum of PKS 2155-304.
We also note that both the dynamics of this gas (as derived from the OVI line) and its physical state are very similar to those found (using UV absorption lines only) for the intervening ionized absorber along the line of sight to the quasar H 1821+643 (Tripp et al., 2001): internal dispersion velocities of the order of km s-1 (FWHM of the broad Ly line), temperature in the range logT (assuming pure collisional ionization), and pathlength of about 3 Mpc (using km s-1 Mpc-1). We predict that the planned high resolution and high quality X-ray spectra of this object, should then show OVIIKα absorption with an intensity similar to that found here.
4.7 The Ne/O problem: Dust Depletion
In virtually all the cases discussed, the Ne/O ratio in the absorber along the line of sight towards PKS 2155-304 is required to be higher than solar. There are various ways to reconcile with this problem: (1) Type II supernovae give rise to Ne/O ratios much higher than Type I supernovae, compared to Si (Tsuro et al., 1997 and references there in); (2) O can be depleted on to dust grains, but noble gas like Ne would not. If superwinds from galaxies are responsible for the enrichment of the IGM, then in order to produce high gaseous Ne/O ratios compared to solar, they must be able to produce a considerable amount of dust before leaving the high density galaxy environment. (3) In the modeling above, we have assumed a simple parameterization of ionizing background. The true shape of the background is clearly more complex, and a harder background would result in a large Ne/O ratio. Any or all of these factors might be playing a role in the observed value of [Ne/O].
It is important to notice that dust can easily survive at the kinetic temperatures (i.e. K) and densities (i.e. cm-3) of such a warm IGM filament. In such regime, the sputtering lifetime is inversely proportional to the gas density, and largely independent from the dust grain composition and gas temperature (Draine & Salpeter, 1979a,b). The survival time of a small interstellar grain of size m will be larger than yr in the IGM filament, and even larger for grains of larger size. We estimated the reddening expected along the line of sight to PKS 2155-304, based on (a) the observed equivalent H column density, (b) the typical size of a silicate dust grain, and (c) a typical ISM gas/dust ratio. In this condition the estimated E(B-V) is of about mag, fully consistent with the observations (Schlegel et al., 1998).
Finally we note that [Ne/O] overabundances of , compared to solar, have already been observed in several astrophysical environments (e.g. Paerels et al., 2001, Brinkman et al., 2001), strongly suggesting that the non-O-depleted values of this quantity, measured in stelar atmospheres, are not representative of the average gaseous [Ne/O] ratio in the Universe.
5 Conclusions
In this paper we report the first discovery of the “X-ray Forest” of absorption lines produced by highly ionized intergalactic medium. High significance X-ray absorption lines of OVII, OVIII and NeIX are detected along the line of sight to the bright blazar PKS 2155-304, and are associated with a known OVI UV absorber. We demonstrate that the dynamical properties of the X-ray and the UV absorber are fully consistent with each other, and that a reasonable common and self-consistent physical solution can be found only if photoionization and collisional ionization both contribute to the ionization of the absorbing gas. This requires electron densities of about cm-3 for the diffuse X-ray background to be significant. This low denisty requires a linear size, along the line of sight, of the order of Mpc. This clearly locates the absorber outside our Galaxy in intergalactic space. We demonstrate that both the dynamical and physical properties of such an absorber are remarkably consistent with those predicted for the low redshift warm phase of the IGM as predicted by hydrodynamical simulations for the formation of structures in the Universe. Finally we find that solutions with a Ne/O ratio of about 2.5 times solar are favored, suggesting type-II Supernova enrichment, or the presence of dust in the IGM.
Aknowledgements
This work has been partly supported by the NASA grant ADP NAG-5-10814 (FN), the Chandra grant DDO-1005X FN and AF), CXC grant NAS8-39073 (FN and AF) and the NASA grant LTSA NAG-5-8913 (SM).
References
- (1) Aldcroft, T., Elvis, M., McDowell, J., & Fiore, F., 1994, ApJ, 437, 584
- (2) Arav, N., Brotherton, M.S., Becker, R.H., Gregg, M.D., White, R.L., Price, T., Hack, W., 2001 , ApJ, 546, 140
- (3) Boldt, E., 1987, IAU Symp., 124, Observational Cosmology, ed. A. Hewitt, G. Burbidge, & Li Zhi Fang (Dordrecht: Reidel), 611.
- (4) Brinkman, A.C., et al., 2000, ApJ, 530, L111B
- (5) Brinkman, A.C., et al., 2001, A&A, 365, L324
- (6) Dickey, J.M. & Lockman, F.J., 1990, ARA&A, 28, 215
- (7) Draine, B.T., & Salpeter, E.E., 1979a, ApJ, 231, 77
- (8) Draine, B.T., & Salpeter, E.E., 1979b, ApJ, 231, 438
- (9) Ebisawa, K., Maeda, Y., Kaneda, H. & Yamauchi, S., 2001, to appear in Science, astro-ph/0108406
- (10) Falomo, R., Pesce, J.E., & Treves, A., 1993, ApJ, 411, L63
- (11) Fang, T., & Canizares, C.R., 2000, ApJ, 539, 532
- (12) Ferland, G.J., 1997, CLOUDY Version 90.04
- (13) Fiore, F., Nicastro, F., Savaglio, S., Stella, L., & Vietri, M., 2000, ApJ, 544, L7
- (14) Grevesse, N., & Anders, E., 1989, Cosmic Abundance of Matter, AIP Conference Proceedings 183, p. 1, Ed. C.J. Waddington (New York: AIP)
- (15) Grevesse, N., & Noels, A., 1993, in Origin and Evolution of Elements, ed. N. Prantzos, E. Vangioni-Flam, & M. Casse (Cambridge University Press, p. 15)
- (16) Hellsten, U., Gnedin, N.Y., & Miralda-Escudé, J., 1998, ApJ, 509, 56
- (17) Kataoka, J., Takahashi, T., Makino, F., Inoue S., Madejski, G.M., Tashiro, M., Urry, C.M., Kubo, H., 2000, ApJ, 528, 243
- (18) King, A.R., Davies, M.B., Ward, M.J., Fabbiano, G., Elvis, M., 2001, ApJL, 552, 109
- (19) Krause, M. O. 1994, Nucl. Instrum. Methods B, 87, 178
- (20) Kravtsov, A.V., Klypin, A., & Hoffman, Y., 2001, ApJ, submitted, astro-ph/0109077
- (21) Jenkins, E.B., 1978a, ApJ, 219, 145
- (22) Jenkins, E.B., 1978b, ApJ, 220, 107
- (23) Mathews, W.G., & Ferland, G.J., 1987, ApJ, 323, 456
- (24) Mirabel, I.F., & Rodriguez, L.F., 1999, ARA&A, 37, 409
- (25) Narayan, R., Garcia, M.R., & McClintock, J.E., 2001, to appear in Proc. IX Marcel Grossmann Meeting, eds. V. Gurzadyan, R. Jantzen and R. Ruffini, Singapore: World Scientific (astro-ph/0107387)
- (26) Nicastro, F., Fiore, F., & Matt, G., 1999, ApJ, 517, 108
- (27) Nicastro, F., Fiore, F., Perola, G.C, Elvis, M., 1999, ApJ, 512, 184
- (28) Paerels, F. et al., 2001, ApJ, 546, 338
- (29) Parmar, A.N., Guainazzi, M., Oosterbroek, T., Orr, A., Favata, F., Lumb, D., Perna, R., & Loeb A., 1998, ApJ, 503, L135
- (30) Malizia, A., 1999, A&A, 345, 611
- (31) Sankrit, R., Kruk, J.W., Ake, T.B. & Anderson B.-G., v. 1.0
- (32) Sarazin, C.L., 1988, “X-Ray Emission from Clusters of Galaxies, Cambridge: Cambridge University Press. Savage, B.D. & De Boer, K.S., 1979, ApJ, 230, L77
- (33) Savage, B.D. & Massa D., 1987, ApJ, 314, 380
- (34) Savage, B.D., Sembach, K.R. & Lu, L., 1997, AJ, 113, 2158
- (35) Savage B.D., et al., 2000, ApJ, 538, L27
- (36) Schlegel, D.J., Finkbeiner, D.P., & Davis, M., 1998, ApJ, 500, 525
- (37) Sembach, K.R. & Savage, B.D., 1992, ApJS, 83, 147
- (38) Sembach, K.R., Savage, B.D., Lu, L. & Murphy, E.M., 1999, ApJ, 515, 108
- (39) Sembach, K.R. et al., 2000, ApJ, 538, L31
- (40) Spitzer, L., 1978, Physical Processes in the Interstellar Medium (New York: Wiley-Interscience)
- (41) Spitzer, L., 1990, ARA&A, 28, 71
- (42) Tripp, T.M., Giroux, M.L., Stocke, J.T., Tumlinson, J., Oegerle, W.R., 2001, to appear in the ApJ, astro-ph/0108371
- (43) Tsuro, T.G., Awaki, H., Koyama, K., & Ptak, A., 1997, PASJ, 49, 619
- (44) Urry, C.M., & Shafer, R.A., 1984, ApJ, 280, 569
- (45) Verner D.A., Verner E.M., & Ferland, G.J., 1996, At. Data Nucl. Data Tables, 64, 1
- (46) York, D.G., 1977, ApJ, 213, 43
- (47) Walker, T.P., Steigman, G., Kang, H.-S., Schramm, D.M., Olive, K.A., 1991, ApJ, 376, 51
- (48) White, N., Giommi, P., & Angelini, L., 1994, IAUCirc, 6100
- (49)