The lensing system towards the doubly imaged quasar SBS 1520+530††thanks: Based on observations obtained at the 2.56m Nordic Optical Telescope (La Palma, Spain) and with the Hubble Space Telescope, operated by NASA.
The gravitational potential responsible for the lensing effect in SBS 1520+530 is studied over length scales from a few arc-seconds to a few arc-minutes. For this purpose, we use sharply deconvolved Hubble Space Telescope images in the optical and near-IR, in combination with ground based optical data obtained over a wider field-of-view. In particular, we have carried out a multi-color analysis in order to identify groups or clusters of galaxies along the line of sight. Photometric redshifts are measured for 139 galaxies unveiling significant excesses of galaxies 1.0′ NW and 1.7′ SW of the main lensing galaxy. The photometric redshift inferred both for the main lensing galaxy and for the galaxy concentrations is z=. This is in rough agreement with the measured spectroscopic redshift of the main lensing galaxy, z= (Burud et al. 2002), suggesting that it is part of a larger group or cluster. We investigate the impact of including the galaxy cluster, first on the modelling of the lensing system, and second on the expected time–delay between the two quasar images.
Key Words.:
galaxies – clusters – gravitational lensing – multiple quasar system – individual SBS 1520+5301 Introduction
The study of multiply imaged quasars is one of the most promising way
to measure cosmological parameters such as the Hubble parameter H0 (Refsdal 1964, Blandford & Narayan 1992). Indeed, H0 is
related to two observables: the time–delay between the light curves of
the quasar images and the mass distribution in the lens. Until
recently, simple mass distributions were used to model multiply imaged
quasars. However, the improvement of observing techniques has led to
the discovery that most image configurations require more complex
models, involving, for example, an external shear (Keeton, Kochanek
& Seljak 1997). This small but significant external perturbation to
the main lensing potential often corresponds to the presence of groups
or even clusters of galaxies along the line of sight (see for example
Keeton & Kochanek 1997, Burud et al. 1998, Morgan et al. 2001, Fassnacht & Lubin 2001). These additional structures must be taken into account
in order to properly model the mass distribution and accurately
convert the observed time–delay into H0.
SBS 1520+530 is a doubly imaged quasar at z=, with an angular
separation of 1.568″
(=15 21 44.83 ,
=+52 54′ 48.6″). It was discovered
by Chavushyan et al. (1997) in the course of the Second Byurakan
Survey (Markarian & Stepanian, 1983).
Crampton et al. (1998) identified the lensing galaxy from near-IR
adaptive optics images and proposed a simple lens model including
exclusively the main lensing galaxy. They concluded however that an
additional external shear was mandatory to model properly the
system.
Deep ground–based and HST data are used in the present
paper to map the mass distribution along the line of sight to SBS
1520+530. We then investigate the source of external shear and propose
a multi–components model for the total lensing potential, where the
main lensing galaxy is a member of a larger group or cluster of
galaxies.
2 Observations - data reduction
2.1 Ground–based observations
The ground–based optical data consist of two sets of images obtained during two observing runs, with the 2.56m Nordic Optical Telescope (NOT) on the island of La Palma, Spain.
SBS 1520+530 was observed with the High Resolution Adaptive Camera (HiRAC) on the night of February 25, 1998 under photometric conditions and average seeing between 0.8″ and 1.2″. The total exposure times were 90 min in , 40 min in and 30 min in . With a pixel size of 0.11″, the useful field–of–view of the 2102 2052 detector is about 3.5′ on a side. The images were reduced using sky flat-fields. Strong fringes (10%) are affecting the -band images, but many dithered short exposures were combined into a high signal-to-noise map of the fringes which was then subtracted from the data. This procedure leads to final images with sky subtraction accurate to the percent level.
Additional images were obtained on the night of February 16, 1998, with the Andalusia Faint Object Spectrograph and Camera (AlFOSC). The pixel size is 0.188″ on this instrument, which sets the field–of–view to 6.5′. The observations were taken under 0.9″ seeing and through thin cirrus. Total exposure times were 25 min in and 30 min in . These images were combined with the HiRAC (flux calibrated) data to obtain a deeper dataset but were also used to look for overdensities of galaxies over a wider field–of–view than that of the HiRAC data.
2.2 Hubble Space Telescope observations
Archival data of SBS 1520+530 were used to derive the precise astrometry of the system in the immediate vicinity of the lens. These data are part of a much larger public survey of gravitational lenses (PI: E. Falco) known as the CfA-Arizona Space Telescope LEns Survey (CASTLES). NICMOS2 -band (F160W) data were taken on July 20, 1998, with a total exposure time of 47 min. At the date of observations, the NICMOS2 pixel size was 0.0759″ 0.0753″.
Optical data were obtained with WFPC2 through the F814W filter (August 22, 1999), with a total exposure time of 27 min and through the F555W filter (November 11, 1999), for a total exposure time of 35 min.
3 Image deconvolution
| F555W | F814W | I | F160W | (”) | (”) | z | |
|---|---|---|---|---|---|---|---|
| Date | 11/11/1999 | 22/08/1999 | 25/04/1998 | 22/07/98 | / | / | / |
| A | 18.86 | 17.91 | 17.68 | 17.09 | 0 | 0 | 1.855 |
| B | 19.31 | 18.83 | 18.49 | 18.17 | -1.426 | -0.652 | 1.855 |
| 0.576 | 0.436 | 0.476 | 0.465 | / | / | / | |
| gal L | 24.8 | 21.8 | 21.17 | 18.75 | -1.1300.005 | -0.3870.001 | 0.88 |
| gal M | 24.5 | 22.60.2 | 21.840.10 | 20.03 | -2.4950.005 | 0.690 0.005 | 0.89 |
3.1 Image processing
Several dithered images are available for each filter: 3 in F555W, 4 in F814W and 4 in F160W. These images were combined after cosmic rays and bad pixels rejection using standard IRAF procedures and were subsequently deconvolved using the “MCS” deconvolution algorithm (Magain et al. 1998). The algorithm can either deconvolve one single frame or deconvolve simultaneously several frames on the same object, combining them at the same time into one deep sharp frame. The algorithm also decomposes the data into a sum of point sources (here the quasar images and nearby stars) and extended sources (the lensing galaxy). One can therefore derive the photometry of the lens, decontaminated from the quasar light.
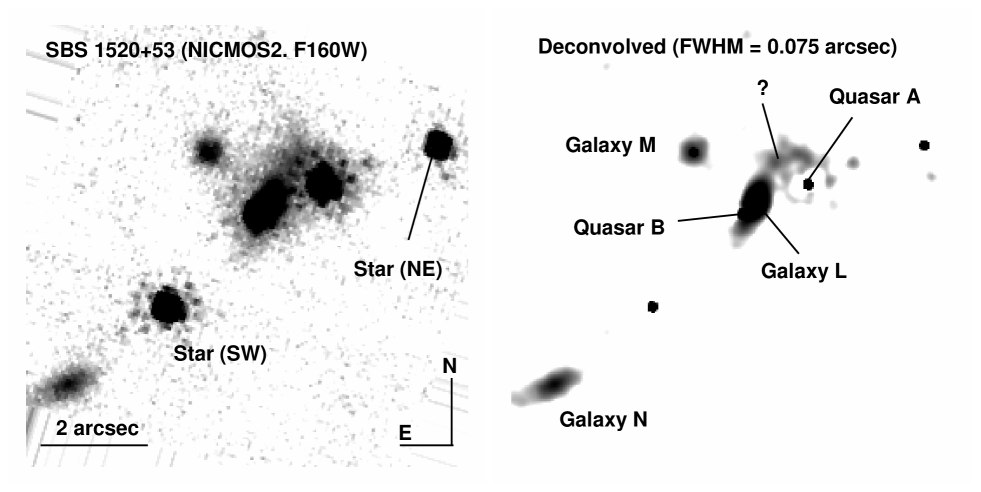
We deconvolved the data in two ways. The F555W and F814W data were deconvolved only after combining the individual images, because of poor signal-to-noise ratio. For the more numerous and deeper F160W images, the individual data frames were simultaneously deconvolved in order to produce a high quality image of the system. This process is the same as described in Courbin et al. (1998) with a slight deviation from the standard application of this technique. In the standard application, each frame is seen as the convolution of a unique ideal frame with the PSF associated to each image in the data set. In the present case, the PSF available in the data (stars “SE” and “NW” in Fig. 1) are faint compared to the quasar images and we chose to compute one single PSF for all frames. This PSF is constructed from all stars available in the data set, i.e. two stars per frame, times four frames. This has the advantage of providing a high signal-to-noise PSF with very good rejection of cosmic rays and bad pixels but it also implicitly assumes the temporal stability of the PSF over the period of observation. The quality of the residuals after deconvolution (see Courbin et al. 1998 for more details) remains good, indicative that our assumption is actually correct.
3.2 Results
The result of the simultaneous deconvolution of the F160W images is displayed in Fig. 1. Objects are labelled as in Crampton et al. (1998). The two PSF stars used for the deconvolution are the ones labelled “SE” and “NW”. Note the elongated lensing galaxy L appearing between the two quasar images. Two other objects are also visible in the immediate vicinity of the lensed source (labelled galaxies M and N in Fig. 1). Although at the confidence limit after the deconvolution process, the extended plumes to the NW of the lensing galaxy L might trace a prior interaction with galaxy M. However we shall ignore this feature in the subsequent modelling. Table 1 summarizes the main properties of the quasar images and of the lensing galaxy. As the lensing galaxy appears to be essentially elliptical, models are particularly sensitive to its orientation and ellipticity: hence particular attention was paid to the precise determination of these parameters. We used the Im2shape software (Bridle et al. 2002) to determine accurate values of the PA and of the ellipticity of the galaxies L and M. We measure an ellipticity of 0.500.02 for galaxy L, the ellipticity being defined as . Its major axis is oriented at PA. Galaxy M is located at 2.56″ to the NE of the quasar image A and is likely to play some role in the lens modelling. It is almost circular (=0.040.02, PA). Galaxy N is too far away from the main lensing galaxy L (7″) to play an important role in the modelling, at least if realistic masses are considered. The coordinates of the quasar image B, of the lensing galaxy L and of galaxy M, relative to the quasar image A, are provided in Table 1. Photometric redshifts have been derived for the different objects in the immediate vicinity of SBS 1520+530. These redshifts were estimated with Hyperz111The original code and user’s manual are available at http://webast.ast.obs-mip.fr/hyperz (Bolzonella et al. 2000), as were those of the intervening galaxy cluster/group (see Section 4.2 for complete details). Results from Hyperz consist in two different redshift estimates. The first redshift corresponds to the best fit (smallest ) obtained after testing a wide variety of galaxy templates at different redshifts. It is called the “photometric redshift”, zphot. The second redshift corresponds to a weighted mean redshift zwm, representative of the “most frequent” redshift allocated to the galaxy, while testing a family of galaxy templates over a range of redshifts. The latter redshift, zwm, is less affected by degeneracies due to redundant spectral features in galaxy templates. We obtain, for galaxy M, zphot=0 .89 and zwm=0.57, and for the main lensing galaxy L, zphot0 .88 and zwm=0.71. At the time we were performing this analysis, a spectroscopic redshift of galaxy L was measured, z=0.71 (Burud et al. 2002). These three values are consistent within the error bars.
4 Detection of an intervening galaxy cluster/group
4.1 Photometry of the field: an overdensity of galaxies
The photometry of all galaxies detected in the field–of–view near SBS 1520+530 was performed using the SExtractor 1.2 software (Bertin & Arnouts 1996). No obvious defects were present on the detector chip. Yet the central part of the field (20″ in diameter) was masked, as it is saturated by a very bright star.
The presence of an intervening galaxy cluster/group along the line of sight to SBS 1520+530 was first investigated on the wide field dataset provided by AlFOSC. In the -band, we have detected 620 galaxies over a 6.5′ field–of–view after removal of the stellar objects. A stellar object was defined as an object brighter than , with a FWHM smaller than 1.0″ (the seeing being 0.9″ ) and with elongation (defined as ) smaller than 1.1. Isodensity contours were obtained from the AlFOSC image, for all galaxies in the range . This eliminates low redshift “normal” galaxies but may still include some contamination by faint dwarf galaxies which cannot be identified using only , and photometry. Following these criteria we have displayed the -band image in Fig. 2 where a significant overdensity of galaxies is seen close to the centre of the field. The projected density of galaxies is a factor two larger in the densest parts than in the rest of the field. The shape of the overdensity is irregular and even double-peaked, with one peak located at 1.0′ NW of SBS 1520+530 and a second peak at 1.7′ to the SW. These overdensities also appear in the smaller field–of–view of the HiRAC -band image, applying similar selection criteria, i.e. rejecting the stellar objects and considering only the objects with (see Fig. 3).
4.2 Photometric redshift analysis
Multi–color information is available in a 2.8′ wide field around SBS 1520+530 which corresponds to the HiRAC field–of–view. This is sufficient to recognise the concentration of galaxies detected in the AlFOSC image and to infer photometric redshifts, based on their , and magnitudes. A total number of 139 galaxies are detected in the three filters simultaneously. The magnitudes and their error bars are used as the input to Hyperz (Bolzonella et al. 2000), in order to estimate redshifts. Hyperz makes a comparison between the photometric spectral energy distribution (SED) of the observed galaxy and those obtained from a set of reference template spectra, using the same photometric system. Reddening is also taken into account: we used the Calzetti law (Calzetti et al. 2000). The limiting magnitudes, corresponding to 80% completeness, are 25 in , 24 in , and 23 in . This allows to detect objects up to z1.2. The entire library of template spectra proposed in Hyperz has been considered, encompassing a variety of star formation histories.
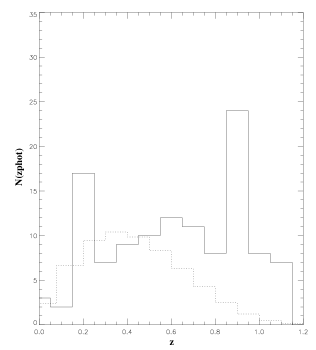
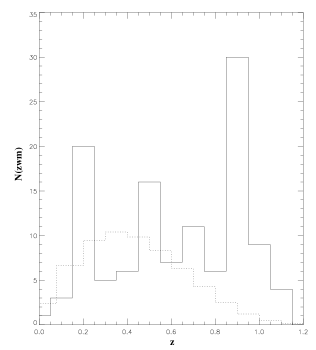
The most likely redshift is estimated for each galaxy through a minimization. As the distribution of versus redshift is not symmetrical around the best redshift value, the weighted mean redshift zwm can also be a relevant and interesting parameter. In Fig. 4, we have plotted the relative distribution of galaxies as a function of redshift, using both the photometric redshift zphot (upper plot) and the weighted mean redshift zwm (lower plot). The distributions are shown along with that of a simulated field with the same mean density of galaxies, but no galaxy clustering. In the simulation, the redshift of galaxy formation is set at zf=7, and the cosmological parameters are H0=50 km.s-1.Mpc-1 and =1. Two redshift bins show an excess of galaxies, at z0.2 and at z0.9. These two concentrations in the redshift space appear in both types of distributions, whether zphot or zwm is considered (see the two panels in Fig. 4). Moreover, the shapes of the distributions do not change if a redshift limit is imposed in Hyperz, for example at 1.0 or 1.5. Therefore, the galaxy excesses at z0.2 and z0.9 are not related to the choice of the redshift limit.
| Model | Fitted parameters | Fixed parameters | Td | ||
|---|---|---|---|---|---|
| L1 | rcut(L)=51 kpc =203 km.s-1 | , | 113 | – | 7.5 |
| L0 | rcut(L)=51 kpc =203 km.s-1 = 3° | 1 | 7.5 | ||
| (L+M)1 | =198 km.s-1 =135 km.s-1 | , , rcut(L) , , rcut(M) | 5 | – | 7.1 |
| (L+M)0 | =198 km.s-1 =135 km.s-1 =-9° | , rcut(L) , , rcut(M) | 7.1 | ||
| (L+M+C)1 | =189 km.s-1 =718 km.s-1 | , , rcut(L) , , rcut(M), rcut(C) | 1 | 100 | 6.5 |
The color image on Fig. 5 illustrates this result as well: the galaxy population with violet colors corresponds to galaxies around z=0.2 while the galaxy population with red color corresponds to galaxies around z=0.9.
As the galaxies contributing to the red population (redshift peak around 0.9) are also those which build up the overdensities seen in Fig. 2 and 3, we deduce that the cluster/group located to the West of the quasar images is indeed at redshift z=0.9 (3 error bars). We cannot exclude that there might be a real difference between the redshift of the main lensing galaxy (z=0.71) and the redshift of the cluster/group. However, we consider in the modelling (see section 5) that they are both at z=0.71, as this is still consistent with the error–bars.
5 Lens modelling
Analytical modelling of SBS 1520+530 was performed using the Lenstool software developed by Kneib et al. (1993). This software computes the lens mass distribution necessary to reproduce the configuration and flux ratios of multiply imaged quasars. In the present case, multiple component lenses can be used, each one being a truncated Pseudo-Isothermal-Elliptical-Mass-Distribution (PIEMD, Kassiola & Kovner 1993, Kneib et al. 1996, Hjorth & Kneib 2002). Given the observational constraints available we explored a number of lens configurations, involving a single lensing galaxy (model L), two galaxies (model L+M), and two galaxies plus a galaxy cluster (model L+M+C). Obviously, the galaxy cluster is represented by a circular PIEMD mass distribution.
The constraints available are the positions of the quasar images and
their flux ratio in the F160W band (Table 1), the positions of galaxies L and M and their PA () and ellipticities ()
with error–bars given in section
2 and the position of the cluster. The error-bars on PA take
into account that the misalignment between dark-matter halo and light of a
galaxy could be of 10 (Kochanek 2001), so that the galaxy mass
distribution could have an orientation different from that traced by
the light.
Given the results and uncertainties from the photometric redshift analysis (see section 3 and 4), a same redshift can be considered for all model components. We take this redshift to be that of the main lensing galaxy, z=.
5.1 Model L
We first run a model considering only the lensing galaxy L. The fitted parameters, and are given in Table 2. The quantities and , as well as the position of the lens, are fixed to their observed values within their respective error bars. In this case, neither the flux ratio nor the relative position of the quasar images are recovered, as shown by the large value of the . This strengthens the suspicion that galaxy L is not the only intervening lens.
5.2 Model L+M
Therefore, in a second step we consider that galaxy M (the nearest galaxy to galaxy L) contributes to the total lensing potential as well. Again the quantities , , , , and the positions of the two galaxies are fixed to their observed values within their respective error bars. In this case we recover the flux ratio, but not the geometrical configuration of the quasar images.
5.3 Model L+M+C
Therefore, additional mass is necessary to fit both the configuration and
flux ratio of the quasar images. A contribution from a galaxy cluster is
proposed and introduced in the model. We first center the
cluster between the two peaks detected in the galaxy density map (see
Fig. 2), but we fail to obtain an acceptable
fit to the data. The best values are obtained for a centering
of the cluster component on the NW peak of the galaxy overdensity.
Doing this, we obtain the results summarized in the last line of Table
2. Adding the SW peak of the galaxy overdensity as a forth PIEMD still provides a good fit. Indeed, being further away, its contribution is minor in the lens model and its unique impact is to reduce the time–delay by a few days.
5.4 Inferences from the lens modelling
The mass to light ratio of galaxy L computed
within the Einstein radius (r156 kpc or 0.7″) for the
different models is given in Table 2.
The luminosity was determined directly from the observed
F160W photometry, as the F160W filter for a galaxy at
roughly correspond to the I-band filter at z=0, and thus no color
correction was applied. For an elliptical galaxy 1.9
therefore the derived for the galaxy L,
is consistent with the range of usual
ratios found in lens systems (Keeton et al 1998).
The time–delay predictions given in Table 2 were computed for the various models of the lens, using H0=65 km.s-1.Mpc-1 =0.3 and =0.7. Changing the cosmology to =1 and =0, with the same value for H0, decreases the time–delay to 85 days for the L+M+C model. Changing the value of H0 from 65 km.s-1.Mpc-1 to 50 km.s-1.Mpc-1 with =0.3 and =0.7, increases the time–delay from 100 days to 125 days for the L+M+C model.
6 Concluding remarks
We have studied the doubly imaged quasar SBS 1520+530 using both HST and ground based data, in order to map the projected mass distribution of the lensing system at small and large scales.
First, by deconvolving the HST/NICMOS data, we have accurately measured the shape and brightness of the main lensing galaxy. We detect a weak extension to the NW of the lensing galaxy (Fig. 1). This feature does not seem to be a residual of the deconvolution process. If it is a genuine feature, it may have some influence on the lens model, considering its proximity to image A of the quasar. However until it has been confirmed, we ignore it for the modelling.
Second, we have mapped the relative surface density of faint galaxies around the quasar images and identified an overdensity of objects to the West. Photometric redshifts were estimated for the main lensing galaxy L as well as for all the galaxies in the 7.5 (′)2 surrounding the lensed quasar. This analysis reveals a concentration in redshift space around a mean value z=0.9 and confirms the 3D–reality of the observed projected overdensity of objects: we consider it to be a galaxy cluster. As a consequence, it is probable that the main lensing galaxy L (measured spectroscopic redshift z=0.71) is a member of this cluster (measured photometric redshift z=0.9). Following this argument and considering that the spectroscopic redshift measurement is more accurate, we have built our lens model with a unique redshift value, z=0.71, for the main lensing galaxy, for galaxy M and for the cluster.
Finally, the presence of a galaxy cluster to the W of SBS 1520+530 is also suggested by the lensing model analysis which does require such a contribution. If not taken into account, it is impossible to reproduce the observed configuration and flux ratio of the double quasar images. This argument is valid as long as light traces mass, which seems to be the case for most lensing galaxies (Kochanek 2001).
An independent and complementary way of probing the line of sight mass distribution is to measure the time–delay induced by the lens system (also necessary to constrain H0). Therefore, it is interesting to predict the time-delay corresponding to the lens model derived from the lensed quasar image configuration. We have made time-delay predictions for the 3 different lens models analysed in this paper, to be compared with the observed time-delay, when it will be available.
Yet, further detailed observations are needed to improve the understanding of the lensing system and enable to use it as a cosmological probe. SBS 1520+530 will be observed by the X–ray satellite Chandra (PI: G.Garmire): this observation should confirm the existence of the cluster in a way similar to the quadruply lensed quasar RX J0911.4+0551 (Morgan et al. 2001). Deep Keck/Gemini multi-object spectroscopy would be invaluable to settle the redshift of the detected cluster/group and provide an estimate of its mass.
Acknowledgements.
It is a pleasure to thank Jens Hjorth and Andreas Jaunsen for providing the lensing galaxy redshift prior to publication. We also acknowledge constructive remarks from the referee, David Rusin. Cécile Faure acknowledges support from an ESO studentship in Santiago. F.C. is supported by Chilean grant FONDECYT 3990024, by the European Southern Observatory, and by a Marie Curie grant MCFI-2001-00242. Two collaborative grants between Chile and France are also gratefully acknowledged: ECOS/CONICYT CU00U05 and CNRS/CONICYT 8730. Jean–Paul Kneib thanks CNRS for support as well as ESO for a productive visit in Santiago.References
- (1) Bertin E., Arnouts S., 1996, A&AS 117, 393
- (2) Blandford R.D., Narayan R., 1992, ARA&A 30, 311
- (3) Bolzonella M., Miralles J.M., Pelló R., 2000, A&A 363, 476
- (4) Bridle S., et al. , 2002, in preparation
- (5) Burud I., Hjorth J. et al., 2002, in preparation
- (6) Burud I., Courbin F., Lidman C., et al. 1998, ApJ 501, L5
- (7) Calzetti D., Armus L., Bohlin R. C., Kinney A. L., Koorneef J. Storchi-Bergmann, 2000, ApJ 533,682
- (8) Chavushyan V.H., Vlasyuk V.V., Stepanian J.A., Erastova L.K., 1997, A&A 318, L67
- (9) Courbin F., Lidman C., Magain P., 1998, A&A 330, 57
- (10) Crampton D., Schechter P.L., Beuzit J.-L., 1998, AJ 115, 1383
- (11) Fassnacht C.D., Lubin, L.M., astro-ph/0111205
- (12) Hjorth J., Kneib J.-P., 2002, submitted to ApJ
- (13) Kassiola A., Kovner I., 1993, ApJ 417, 474
- (14) Kochanek C.S., 2001, to appear in the proceedings of the Yale Cosmology Workshop on the Shapes of Galaxies and Their Halos, astro-ph/0106495
- (15) Keeton C.R., Kochanek C.S., 1997, ApJ 487, 42
- (16) Keeton C.R., Kochanek C.S., Seljak U., 1997, ApJ 482, 604
- (17) Keeton, C. R., Kochanek, C. S., & Falco, E. E. 1998, ApJ, 509, 561
- (18) Kneib J.-P., Mellier Y., Fort B., Mathez G., 1993, A&A 273, 367
- (19) Kneib J.-P., Ellis R., Smail I. et al., 1996, ApJ 471, 643
- (20) Magain P., Courbin F., Sohy S., 1998, ApJ 494, 472
- (21) Markarian B.E., Stepanian D.A., 1983, Afz 19, 639
- morgan (01) Morgan N. D., Chartas G., Malm M., et al. 2001, ApJ 555, 1
- (23) Refsdal S., 1964, MNRAS 128, 307