A Correlation Between Inclination and Color in the Classical Kuiper Belt
Abstract
We have measured broadband optical photometry of 24 Classical and Scattered Kuiper belt objects (KBOs), approximately doubling the published sample of colors for these classes of objects. We find a statistically significant correlation between object color and inclination in the Classical Kuiper belt using our data. The color and inclination correlation increases in significance after the inclusion of additional data points culled from all published works. Apparently, this color and inclination correlation has not been more widely reported because the Plutinos show no such correlation, and thus have been a major contaminant in previous samples. The color and inclination correlation excludes simple origins of color diversity, such as the presence of a coloring agent without regard to dynamical effects. Unfortunately, our current knowledge of the Kuiper belt precludes us from understanding whether the color and inclination trend is due to environmental factors, such as collisional resurfacing, or primordial population effects. A perihelion and color correlation is also evident, although this appears to be a spurious correlation induced by sampling bias, as perihelion and inclination are correlated in the observed sample of KBOs.
Subject headings: comets: general — Kuiper Belt, Oort Cloud — solar system: formation
1 Introduction
Beyond Neptune, the Solar System is populated by Kuiper belt objects (KBOs, also trans-Neptunians) larger than 100 km in diameter, which represent about 0.1 Earth masses of material and are presumed to contain the least thermally processed material in the solar system (Trujillo, Jewitt & Luu 2001). As of Oct 2001, KBOs are known, less than 1% of the inferred population. Dynamically, the KBOs can be divided into at least three classes: (1) the Classical KBOs represent 2/3 of the observed sample and about 1/2 the inferred population; (2) the Resonant KBOs are comprised primarily of Plutinos ( AU) and objects in 2:1 mean-motion resonance with Neptune ( AU), representing 15% of the observed sample, but only 6% of the total population; and (3) the Scattered KBOs comprise about 10% of the observed sample, but nearly half the inferred population because their extreme dynamical properties ( and eccentricities ) place them at unobservably great heliocentric distances for large fractions of their orbits (Trujillo, Jewitt & Luu 2000).
Since the KBOs are thought to be the least thermally modified bodies in the solar system, they are expected to provide insight into the physical and chemical processes that dominated the primitive solar nebula. Given the fact that the KBOs have been observed for nearly a decade, very little is known about their physical properties, primarily because of their extreme faintness (median magnitude ). The most striking physical feature observed of the KBOs is their substantial color diversity, from nearly neutral reflectance to the reddest objects in the solar system (Jewitt & Luu 1998 and Tegler & Romanishin 2000). Objects are reddened from the visible throughout the near-IR (Davies et al. 2000), presumably from a single coloring agent (Jewitt and Luu 2001), although the physical and chemical mechanisms for the reddening process have not been identified. Recently, Tegler & Romanishin (2000) reported that the Classical KBOs exhibited a correlation between color and inclination. No other observers have reported this trend, and Tegler & Romanishin estimate the significance of their reported trend using their two-color paradigm, which has not been confirmed by independent sources (Barucci et al. 2001 and Jewitt & Luu 2001). Thus, we chose to conduct our own observations of this population. Using our new observations, we demonstrate that the inclination and color correlation is indeed statistically significant. In addition, we note the presence of a perihelion and color correlation which appears to be due to sampling bias.
2 Observations
We chose to observe the Classical KBOs — those KBOs which are expected to be the least dynamically modified by Neptune. In practice, 19 Classical KBOs and 5 Scattered KBOs ( AU, 30 AU 40 AU) were observed due to the distribution of objects in the sky when observations were scheduled. Results of this work are not changed significantly by the inclusion or exclusion of the Scattered KBOs, as they are a minority population in our sample. All data were taken with the same equipment, the LRIS (Oke et al. 1995) and LRIS-B (McCarthy et al. 1998) cameras at the 10 meter Keck I telescope during the nights of Feb 26–27, 2001. This dichroic-based instrument combination allows the simultaneous use of blue and visible filters (yielding color) or blue and red filters (yielding color), allowing a factor two increase in efficiency over the previous single camera system. The efficiency of the LRIS/LRIS-B instrument has permitted us to approximately double the published sample of broadband optical colors for the Classical KBOs in just two nights.
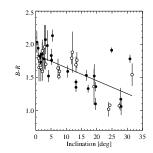
Standard stars (Landolt 1992) were imaged at a variety of airmasses and photometric reductions were performed using a two dimensional PSF-fitting procedure, which allows for arbitrary non-radially symmetric variations of the PSF. Using this method, bright field stars were sampled in both spatial dimensions of the focal plane to estimate the true point-spread-function (PSF) for a given image. Since exposure times were fixed at 5 minutes, KBO apparent motion (3 arc-sec/hr or 0.25 arc-sec/exposure) was minimized, yielding no significant difference between the KBO PSFs and the stellar PSFs given the arc-sec -band seeing (seeing for the and bands was similar, since focus was optimized for ). The stellar PSF was fit to the KBO image to determine flux and local background levels. In all cases, KBO PSFs were consistent with the model PSFs within the Poisson noise. Additionally, synthetic data tests were performed to demonstrate that the PSF fitting procedure is robust to errors in KBO centroiding. Approximately 4 , 2 and 2 measurements were taken of each KBO, although measurements were repeated if contamination by background sources was suspected. The reduced data appear free of instrumental biases — no correlations were observed between color and data collection parameters such as airmass, seeing, time of observations, apparent motion of objects, location in the focal plane or sun-target-observer angle. The most striking feature of these data appears in Figure 1, which shows an apparent correlation between orbital inclination and color. With few exceptions, this correlation appears to vary continuously from the reddest (low-inclination) KBOs to the bluest (high-inclination) KBOs. Both the and color measurements for each object are presented in Table 1. The physical implications of these observations are discussed in § 3, while an estimation of the statistical significance of the color and inclination trend, as well as other trends, appears in the remainder of this section.
2.1 The KBO Inclination and Color Correlation
To estimate the significance of the relationship between color and , we computed the Spearman (1904) rank correlation statistic for our data set, which takes on non-zero values between for correlated quantities. The strength of the Spearman method is that it does not presuppose a functional form for the correlation, as do linear least-squares estimates. In addition, the Spearman method is less sensitive to the presence of deviant data points than a chi-squared rank correlation test, as it is the difference in rank between sorted data lists that is compared, not the actual data values themselves. Two statistical tests (Press et al. 1992), the -statistic and the variance of the sum squared difference of ranks, , can be used to estimate the significance of a non-zero value of (here, we report the mean of the two tests). We measure the correlation between color (a stronger indicator of color than ) and orbital inclination as for the data points in our new sample. The probability of this or a more significant one occurring in an uncorrelated sample is ( significance, assuming Gaussian statistics, since yields the confidence level).
In order to increase sample size, we repeated this analysis combining our data with all previously published data (Table 2). Color measurements of the same object from multiple investigators have been combined into one value, with error bars reflecting the greater of (1) the standard error of the color values or (2) the mean of the reported errors when combined in quadrature. We note that the process that produces the colors appears stochastic in nature, with individual KBOs departing from the color correlation based on their past interactions with the coloring mechanism. Error bars reflect color measurement error, and not the expected departure of an individual KBO from the overall color / inclination trend, which cannot be computed a priori without more information about the physical nature of the coloring process. We note that in cases of duplication between our objects and published objects, our color values are statistically indistinguishable from other published values. By increasing the sample size using previously published data on all KBOs, the significance of the inclination and color correlation increases to ().
It appears that the correlation between color and inclination has not been widely reported because of the influence of the Plutinos, for which no correlation is apparent. Removing the Plutinos from the combined sample of data results in a large increase in the correlation statistic to (). However, we must note that the removal of the Plutinos is still statistically tentative, as a two-dimensional Kolmogorov-Smirnov test (Press et al. 1992) shows that the null hypothesis that the Plutino and other KBO (, ) values are drawn from the same distribution can be rejected with only 93% () confidence. This observation in itself has some potential implications for the origin of color diversity, as discussed in the next section. Since the correlation between inclination and color for the non-Plutino KBOs (1) increases in significance with increased sample size, (2) does not appear to be the product of any observational biases, (3) is observed in both and the , and (4) has () chance of being produced in an uncorrelated population, we conclude that it is statistically significant.
2.2 Other Correlations
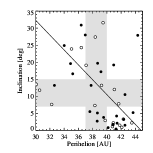
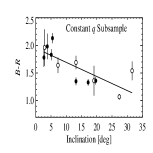
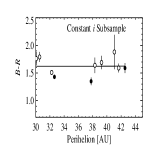
The only other color trend that we observe for the Classical KBOs is a perihelion and color correlation. This trend, however, is almost certainly due to sampling bias. To illustrate this, we have considered two subsamples of the data, which are shown as the greyed bars in Figure 2. The first subsample (the “constant ” subsample) shows little perihelion variation but large inclination variation and consists of objects between . The constant subsample exhibits a correlation between inclination and color, indicating that the inclination and color correlation cannot be attributed to perihelion variations alone (Figure 3). The second subsample (the “constant ” subsample) shows little inclination variation but large perihelion variation and consists of objects between . The constant subsample shows no correlation between perihelion and color, indicating that the perihelion and color trend is most likely a spurious correlation induced by sampling bias.
3 Interpretation
The link between color and inclination rules out very simple mechanisms of producing the observed KBO color diversity. The presence of a coloring agent (surface frosts, for example) independent of the Kuiper belt dynamical environment cannot be the only cause of color diversity, because in such a scenario, no correlation between color and any orbital parameter would be expected. More complex processes must be invoked such as evolutionary processes or remnant primordial composition effects.
Collisional resurfacing has been suggested as a possible mechanism for producing the wide range of KBO colors (Luu & Jewitt 1996 and Jewitt & Luu 2001). In this model, a close competition between radiative processing, which reddens the surface, and collisional resurfacing, which restores neutral ices to the surface, produces the observed color variations. Assuming that collisions are most likely to take place near the ecliptic where the KBO number densities are highest, a color and inclination correlation seems likely. An object’s speed perpendicular to the ecliptic follows . From laboratory simulations (Fujiwara, Kamimoto & Tsukamoto 1977) scaled to solar system events (Fujiwara et al. 1989), the mass ejected during a collision is proportional to impact energy squared, . Thus, ejecta mass could be a strong function of object inclination, , leading to a correlation between color and inclination. If this were the case, one might expect to see a correlation between color and population averaged impact velocity (Stern 1995). Unfortunately, because of the paucity of color data, it is not currently possible to separate the effects of an correlation from a correlation because the two parameters are so strongly correlated. In addition, it is not clear why the collisional environment would be different for the Plutinos, which show no correlations between and color. Further modeling is required to fully quantify this effect. Unfortunately, the competition between collisions and radiative processing is quite difficult to model, as we do not have a thorough understanding of all of the astrophysical effects that take place. For instance, no dynamical models have yet estimated collision rates based on population dynamics in a manner that could demonstrate a dynmaics-induced color correlation. In addition, models of radiative processing have not addressed the effect of the complete carbonization of surfaces, which would result in a dark, neutrally colored surface. Furthermore, no collisional resurfacing models have adequately reproduced the magnitude of color variations presently observed for the KBOs (Jewitt & Luu 2001).
The best alternative to evolutionary processes is that the colors are primordial in nature. An correlation might be expected if the KBOs were composed of multiple sub-populations with different primordial colors and inclinations. Such a model is compatible with two recently reported dynamical groupings: (1) the Levison and Stern (2001) large and small size components of the Classical KBOs and (2) the Brown (2001) high- and low- components of the Classical KBOs. However, we find no correlations between color and any orbital parameter other than , as might be expected for a cosmogonic origin to the colors. Even if the KBO colors are dominated by primordial processes, the role of collisions in altering KBO surfaces must still be addressed given that (1) collisions are thought to be responsible for reducing the mass of the Kuiper belt by a factor since the epoch of formation (Stern & Colwell 1997 and Kenyon & Luu 1999) and (2) it is expected that a large fraction of KBO surfaces are covered with impact signatures (Durda & Stern 2000).
References
- (1) Barucci, M. A., Doressoundiram, A. & Tholen, D. 1999, Icarus, 142, 476–481
- (2) Barucci, M. A., Romon, J., Doressoundiram, A. & Tholen, D. J. 2000, AJ, 120, 496–500
- (3) Barucci, M. A., et al. 2001, A&A, 371, 1150–1154
- (4) Brown, M. E. 2001, AJ, 121, 2804–2814
- (5) Burkhardt, G. 1982, Astron. & Astrophys. 106, 133
- (6) Davies, J. K. et al. 2000, Icarus, 146, 253–262.
- (7) Durda, D. D. & Stern, S. A. 2000, Icarus, 145, 220–229
- (8) Fujiwara, A., et al. 1989, in Asteroids II, ed. R. P. Binzel, T. Gehrels, & M. S. Matthews (Tucson: Univ. Arizona Press), 240–265
- (9) Fujiwara, A., Kamimoto, G. & Tsukamoto, A. 1977, Icarus, 31, 277–288
- (10) Jewitt, D. & Luu, J. 1998, AJ, 115, 1667–1670
- (11) Jewitt, D. C. & Luu, J. X. 2001, AJ, 122, 2099–2114
- (12) Kenyon, S. J. & Luu, J. X. 1999, AJ, 118, 1101–1119
- (13) Landolt, A. U. 1992, AJ, 104, 340–371.
- (14) Levison, H. F. & Stern, S. A. 2001, AJ, 121, 1730–1735
- (15) Luu, J. & Jewitt, D. 1996, AJ, 112, 2310–2318.
- (16) McCarthy, J. K. et al. 1998, Proc. of SPIE, 3355, 81–92
- (17) Oke, J. B. et al. 1995, PASP, 107, 375–385
- (18) Press, W. H., Teukolsky, S. A., Vetterling, W. T. & Flannery, B. P. 1992, Numerical Recipes in C: The Art of Scientific Computing, Second Edition (Cambridge: Cambridge University Press), pp. 640–641, pp. 645–649
- (19) Spearman, C. 1904, Am. J. Psychology, 15, 72–101
- (20) Stern, S. A. 1995, AJ, 110, 856–868
- (21) Stern, S. A. & Colwell, J. E. 1997, ApJ, 490, 879–882
- (22) Tegler, S. C. & Romanishin, W. 1998, Nature, 392, 49–51
- (23) Tegler, S. C. & Romanishin, W. 2000, Nature, 407, 979–981
- (24) Trujillo, C. A., Jewitt, D. C. & Luu, J. X. 2000, ApJL, 529, L103–L106.
- (25) Trujillo, C. A., Jewitt, D. C. & Luu, J. X. 2001, AJ, 122, 457–473