Imaging and spectroscopy of the faint remnant G 114.30.3
We present the first calibrated CCD images of the faint supernova remnant G 114.3+0.3 in the emission lines of O ii, O iii, HN ii and S ii. The deep low ionization CCD images reveal diffuse emission in the south and central areas of the remnant. These are correlated with areas of intense radio emission, while estimates of the S ii/H ratio suggest that the detected emission originates from shock heated gas. In the medium ionization image of O iii we discovered a thin filament in the south matching very well the outer radio contours. This filament is not continuous over its total extent but shows variations in the intensity, mainly in the south–west suggesting inhomogeneous interstellar clouds. Deep long–slit spectra were also taken along the O iii filament clearly identifying the observed emission as emission from shock heated gas. The H emission is a few times erg s-1 cm-2 arcsec-2, while the variations seen in the O iii flux suggest shock velocities into the interstellar clouds around or below 100 km s-1. The sulfur line ratio approaches the low density limit implying electron densities less than 500 cm-3.
Key Words.:
ISM: general – ISM: supernova remnants – ISM: individual objects: G 114.3+0.31 Introduction
The vast majority of supernova remnants have been discovered by their non–thermal synchrotron radio emission. Since the optical wavelengths suffer significantly more attenuation than the radio, the detection of a supernova remnant in the optical band is a difficult task. The supernova remnant G 114.3+0.3 was initially detected in the 21 cm continuum survey of Kallas & Reich (kal80 (1980)) and subsequently studied in more detail by Reich & Braunsfurth (rei81 (1981)). The remnant shows up in the radio as an ellipsoidal shell occupying an angular extent of 60′ 78′. The radio emission is stronger in the south–east and south–west compared to other areas of the remnant. The surface brightness is low, while at the same time the source displays a high degree of polarization. More interest was raised for this system following the proposal of Fürst et al. (fur93 (1993)) and Kulkarni et al. (kul93 (1993)) that the pulsar PSR 233461 is associated with SNR 114.3+00.3. This pulsar rotates at a period of 495 ms and its spindown rate suggests an age of 41000 yr. The distance estimates to this pulsar–remnant association lie in the range of 2–3 kpc. ROSAT PSPC pointed observations showed that the pulsar is a weak X-ray source, while no emission was detected from the remnant itself (Becker et al. bec96 (1996)).
Fesen et al. (fes97 (1997)) reported the detection of faint filamentary structures in H in the west, south–west areas of the remnant. However, no images were shown due to the faintness of the filaments. Even though the spatial correlation of the optical emission with the radio contours favors their association, flux calibrated images in H and S ii or long–slit spectra are needed to establish the nature of the optical flux. In an effort to deepen our knowledge of the properties of the optically detected remnants, especially the faintest ones, we performed deep CCD imaging and spectral observations of G 114.3+0.3. Information about the observations and the data reduction is given in Sect. 2. In Sect. 3 and 4 we present the results of our imaging observations and the results from the long–slit spectra taken at specific locations of interest. Finally, in Sect. 5 we discuss the physical properties of the remnant.
2 Observations
2.1 Optical images
The observations presented in this paper were performed with the 0.3 m Schmidt Cassegrain telescope at Skinakas Observatory, Crete, Greece. The field of G 114.3+0.3 was observed in July 12 and 14, 1999. The observations were performed with a 1024 1024 Site CCD which had a pixel size of 25 m resulting in a 89′ 89′ field of view and an image scale of 5″ per pixel. The number of frames taken is given in Table 1 along with the total exposure times in the specific filters used during the observations. The filter characteristics can be found in Mavromatakis et al. (mav00 (2000)). The final images in each filter are the average of the individual frames where appropriate, while during the astrometry process the HST Guide star catalogue was used. All coordinates quoted in this work refer to epoch 2000.
We employed standard IRAF and MIDAS routines for the reduction of the data. Individual frames were bias subtracted and flat-field corrected using well exposed twilight flat-fields. The spectrophotometric standard stars HR5501, HR7596, HR7950 and HR8634 were used for absolute flux calibration.
2.2 Optical spectra
Long–slit spectra were obtained on July 16, 21, and 22, 2001 using the 1.3 m Ritchey–Cretien telescope at Skinakas Observatory. The data were taken with a 1300 line mm-1 grating and a 800 2000 Site CCD covering the range of 4750 Å – 6815 Å. The slit had a width of 77 and, in all cases, was oriented in the south-north direction. The coordinates of the slit centers, the number of available spectra from each location and the exposure time of each spectrum are given in Table 2. The spectrophotometric standard stars HR5501, HR7596, HR9087, HR718 and HR7950 were observed in order to calibrate the spectra of G 114.3+0.3.
| HN ii | S ii | O iii | O ii |
|---|---|---|---|
| 3600a(2)b | 3600 (2) | 6600(3) | 1800(1) |
a Total exposure time in sec
b Number of individual frames
| Slit centers | No of spectra | ||
|---|---|---|---|
| (Exp. times) | |||
| 23h39m46s | 61°21′43″ | 2a (3600)b | |
| 23h39m17s | 61°19′06″ | 2a (3600)b | |
| 23h36m37s | 61°17′41″ | 2a (3600)b |
a Number of spectra obtained
b Exposure time of individual spectra in sec
| SEa | SWa | Centera | LBN 565b | |
|---|---|---|---|---|
| HN ii | 11 | 10 | 14 | 90 |
| S ii | 2.4 | 3.5 | 2.6 | 9 |
| O iii | 1.0 | 0.6 | – | – |
| O ii | 2 | 1.6 | – | 5 |
Fluxes in units of erg s-1 cm-2 arcsec-2
aMedian values over a 112″ 67″ box
bMedian values over a 394″ 394″ box
3 Imaging of G 114.3+0.3
3.1 The HN ii and S ii line images
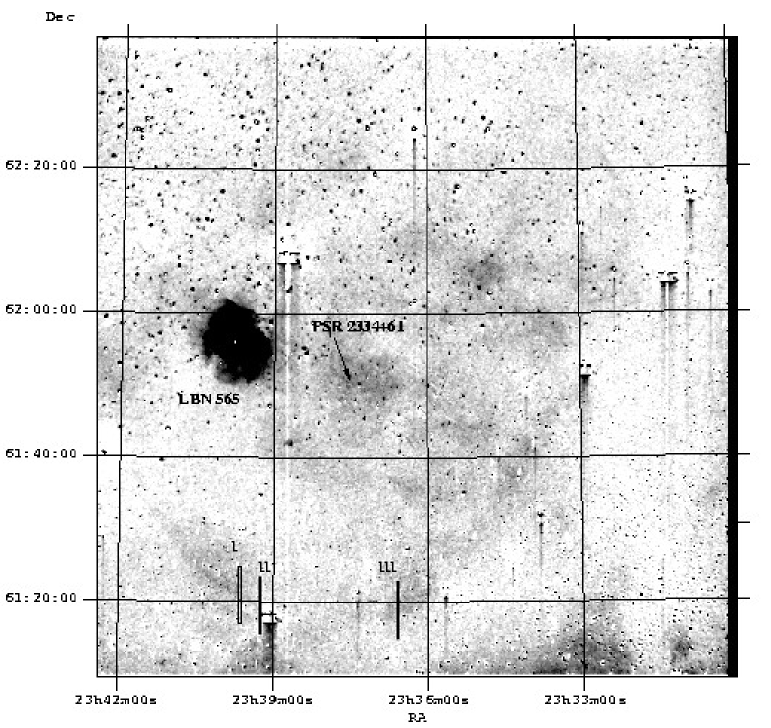
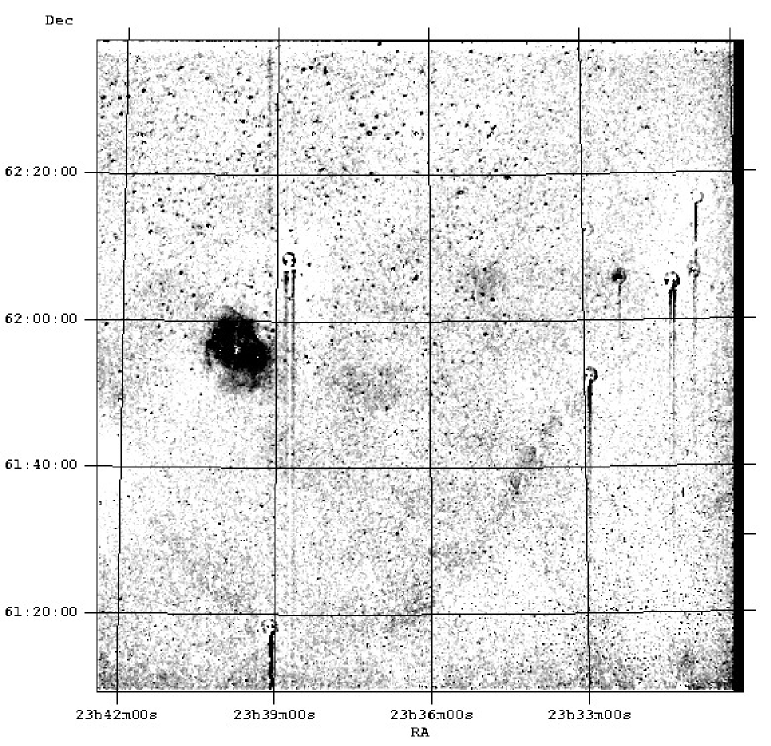
The low surface brightness of G 114.3+0.3 in the radio, optical and X–ray bands seems to be one of its major characteristics. Especially, in the latter band the emission, if any, is below the ROSAT detection limit. Our HN ii and S ii images (Fig. 1 and 2, respectively) reveal weak diffuse emission in the south–east, south–west and central areas of the remnant. The bright, extended source LBN 565 (Lynds lyn65 (1965)) which is believed to be a background source (Reich & Braunsfurth rei81 (1981)) is also visible in the low ionization images. In Table 3, we list typical fluxes measured in several locations within the field of G 114.3+0.3 including the H ii region LBN 565. Since the images are flux calibrated, the HN ii and S ii frames can be used to study the nature of the detected emission. These provide evidence that the emission in the south–east and south–west originates from shock heated gas (S ii/H 0.6-1.0), while LBN 565 is an H ii region (S ii/H 0.3-0.4). Towards the center of the remnant we estimate S ii/H 0.4-0.6 showing that the diffuse emission may be associated with G 114.3+0.3. We note here that the areas where the optical flux is due to shock heating coincide fairly well with the areas where the radio emission is strongest, i.e. in the south (see Fig. 1 and Fig. 4).
3.2 The O iii and O ii images
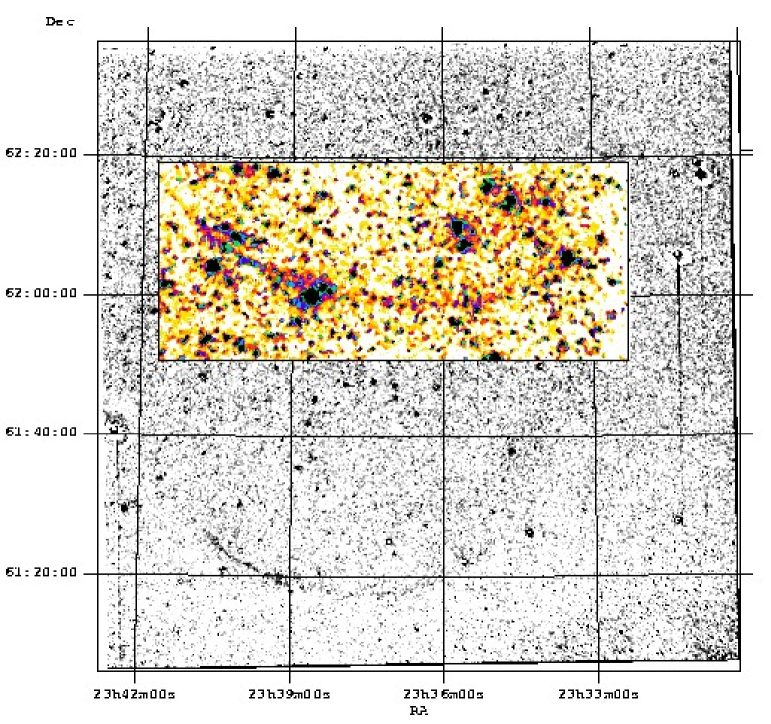
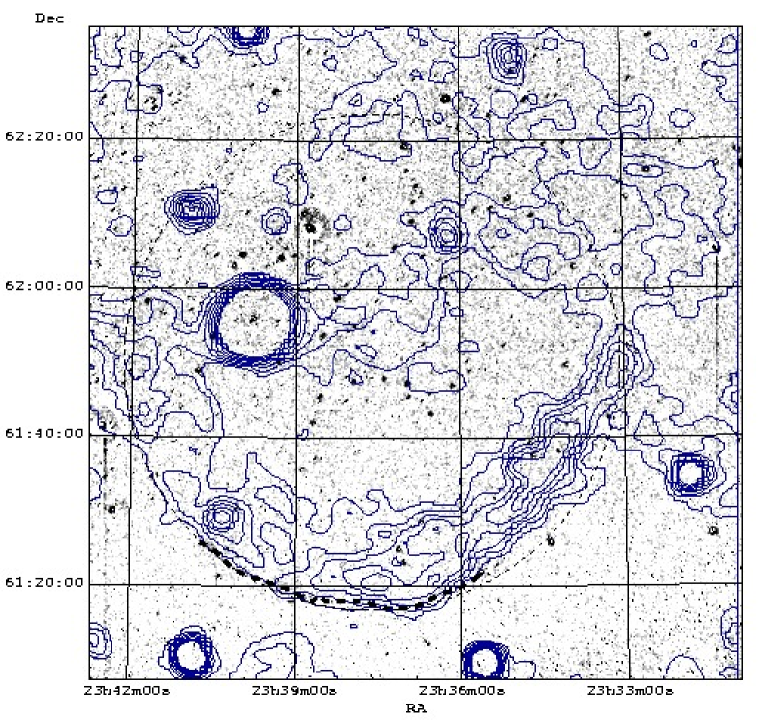
The morphology of the low ionization line of O ii is similar to that seen in the HN ii and S ii images and is not shown here. Typical fluxes measured in the O ii calibrated image are also given in Table 3. Contrary to the morphology seen in the low ionization images, the O iii morphology is strikingly different. A filament is detected in the south which originates at 23h40m42s, 61°25′04″ and ends at 23h36m22s, 61°20′15″, while some weak emission can be seen up to 23h35m36s and 61°22′06″(Fig. 3). The filament is not continuous over its full extent but there are maxima and minima interchanging in the O iii flux, mainly in the south–west. This probably reflects inhomogeneities in the interstellar “clouds” resulting in strong variations of the shock velocity upon which the O iii flux depends crucially (Cox & Raymond cox85 (1985)). No O iii emission is detected in other areas of the remnant, including those areas where diffuse H, N ii or S ii emission is observed. The spatial location of the O iii arc like filament nicely matches the outermost radio contours at 4850 MHz (Fig. 4) suggesting its association with G 114.3+0.3. The O iii arc probably lies very close to the leading edge of the forward shock front. However, the low resolution of the published radio data (Condon et al. con94 (1994)) do not allow us to study in detail this issue.
4 The long–slit spectra from G 114.3+0.3
The deep low resolution spectra cover the south–east and south–west parts of the remnant. All spectra clearly demonstrate the fact that the observed emission must originate from shock heated gas (Table 4). We note here that the signal to noise ratios quoted in Table 4 do not include calibration errors which are less than 10% for the specific days of observation. In addition, the ratio of the sulfur lines approaches the low density limit indicating low electron densities (e.g. Osterbrock ost89 (1989)). The spectra taken from position I (Fig. 1) display strong O iii emission relative to H suggesting shock velocities greater than 100 km s-1 (Cox & Raymond cox85 (1985), Hartigan et al. har87 (1987)), while the intensity of the sulfur lines suggests electron densities of a few tens of cm-3. However, given the errors on the individual sulfur fluxes, we estimate that electron densities less than 270 cm-3 are allowed.
The spectra from position II show roughly the same characteristics with those from position I, i.e. shock velocity greater than 100 km s-1 and low electron densities. However, due to the lower absolute fluxes the larger errors on the sulfur fluxes allow densities up to 600 cm-3. The spectra from position III display a different qualitative behavior compared to those from positions I and II. Furthermore, we were able to extract spectra from different apertures along the slit (IIIa, IIIb, IIIc). Spectral variations are observed among these spectra. A significant detection of the O iii line is only possible for the spectrum at position IIIa suggesting shock velocities greater than 100 km s-1. It is found that electron densities less than 400 cm-3 are allowed for this position. Emission from the O iii5007 Å line is marginally detected in spectrum IIIb suggesting shock velocities less than 100 km s-1. Electron densities also less than 400 cm-3 are estimated from the sulfur line ratio and its 1 error. Finally, in position IIIc we do not detect any O iii emission but for the first time weak H emission is detected.
| I | II | IIIa | IIIb | IIIc | |
| Line (Å) | Fa,b | Fa,b | Fa,b | Fa,b | Fa,b |
| 4861 H | 200 | 240 | 140 | 180 | 187 (3)c |
| 4959 [OIII] | 220 (2) | – | 126 (2) | – | – |
| 5007 [OIII] | 688 (5) | 1508 (5) | 417 (4) | 84 (1) | – |
| 6548 N ii | 242 (3) | – | – | 211 (4) | 190 (4) |
| 6563 H | 1000 (12) | 1000 (4) | 1000 (13) | 1000 (18) | 1000 (17) |
| 6584 N ii | 776 (9) | 476 (3) | 690 (8) | 593 (10) | 602 (12) |
| 6716 S ii | 502 (7) | 546 (4) | 725 (11) | 571 (10) | 725 (13) |
| 6731 S ii | 341 (5) | 371 (3) | 559 (8) | 432 (8) | 530 (12) |
| Absolute H fluxd | 2.4 | 1.5 | 3.0 | 4.2 | 3.3 |
| H/H | 5 | 4.2 | 7 | 5.6 | 5.3 ( 1.8) |
| S ii/H | 0.8 | 0.9 | 1.3 | 1.0 | 1.3 |
| F(6716)/F(6731) | 1.5 | 1.5 | 1.3 | 1.3 | 1.4 |
a Uncorrected for interstellar extinction
b Listed fluxes are a signal to noise weighted average of the individual fluxes
c Numbers in parentheses represent the signal to noise ratio of the quoted fluxes
d In units of erg s-1 cm-2 arcsec-2
All fluxes normalized to F(H)=1000
5 Discussion
The supernova remnant G 114.3+0.3 is one of the faintest and least observed remnants in optical wavelengths (e.g. Boumis et al. bou01 (2001) on G 17.4-2.3). It is also a weak radio source, while extended X-ray emission is not detected in the ROSAT band. The evolved supernova remnant under study is now observed for the first time in a number of optical emission lines apart from H. Diffuse emission in the low ionization images is detected in the south and central areas of the remnant. Its spatial correlation with regions of strong radio emission and the relatively high S ii/H ratio (§3.1) lead us to propose that the observed emission is associated with G 114.3+0.3. We have also discovered a filament in the medium ionization line of O iii in the south which is very well correlated with the outermost radio emission at 4850 MHz. Its projected thickness is 20″ and it is very likely that this filament roughly delineates the outer edge of the expanding shell. Both the calibrated images and the long–slit spectra suggest that it is the result of emission from shock heated gas. G 114.3+0.3 belongs to the group of remnants which display strong O iii emission in only certain sections of the remnant, e.g. CTB 1 (Fesen et al. fes97 (1997)), CTB~80 (Mavromatakis et al. mav01 (2001)) and G 17.4-2.3 (Boumis et al. bou01 (2001)). The strikingly different morphologies between the low and medium ionization lines point to the presence of significant inhomogeneities and density variations in the preshock medium. It is known that the H or S ii lines are produced in cooler areas behind the shock front, while the O iii line is emitted from regions much closer to the front. Since in the former case higher column densities are sampled compared to the latter, the presence of inhomogeneities and density variations would mainly affect the recombination zone where the low ionization lines are produced (see Hester hes87 (1987)). Such effects may also explain the variations seen in the O iii/H ratio in the long–slit spectra.
Emission from the H line is below our detection threshold, while the low significance of the H emission detected at position IIIc results in an extinction c of 0.75 (0.45) or an AV of 1.6 (0.9). Using the code of Hakkila et al. (hak97 (1997)) to estimate the interstellar absorption in the direction of G 114.3+0.3, we find a logarithmic extinction of 1.5 (0.3) for a distance of 2 kpc and 2.0 (0.3) for a distance of 3 kpc. Our measurement is compatible with both estimates within the 2 range due to the large error. An extinction in the range of 1.0–1.5 could be more favorable since it would imply H fluxes below our detection limit, although other values cannot be excluded.
In order to obtain quantitative estimates of basic supernova remnant parameters we will use the relations
| (1) |
and
| (2) |
given by Fesen & Kirshner (fes80 (1980)) and McKee & Cowie (mck75 (1975)), respectively. The factor is of the order of 1–2, is the electron density derived from the sulfur line ratio, nc is the preshock cloud density, is the explosion energy in units of 1051 erg, Vs,100 is the shock velocity into the clouds in units of 100 km s-1, and rs,pc the radius of the remnant in pc. The long–slit spectra show that an upper limit on the electron density is 500 cm-3 and we use it in Eq. 1 to obtain nc V 11. Using this last result in Eq. 2, we find E51 1.6 D, a rather coarse upper limit. The distance to the remnant in units of 2.5 kpc is denoted by D2.5kpc (Kulkarni et al. kul93 (1993)).
Since a direct measurement of the interstellar hydrogen density is not available, a density of 0.1 cm-3 (Fürst et al. fur93 (1993), Frail et al. fra94 (1994)) and an E51 of 1 and 0.1 will be assumed in the following calculations. According to Cioffi et al. (cio88 (1988)) and the above range of parameters the onset of the pressure–driven snow-plow phase (PDS) would occur at 38 pc and 19 pc, respectively. These radii when compared with the current radius of 25 pc at 2.5 kpc suggest that in the former case the onset of the PDS phase will occur in another 40000 yrs, while the PDS phase has already started in the latter case. We note here that an interstellar density of e.g. 0.5 cm-3 would lower the limiting radii to 14 pc and 10 pc, respectively, implying that the remnant is well within the radiative phase of its evolution. Since neither the distance, nor the ambient medium density are accurately known, we cannot confidently determine the current stage of evolution of G 114.3+0.3. However, since the majority of the cases we have examined results in radii lower than the current radius it may be possible that the remnant has passed the adiabatic phase of its evolution and has entered the snow–plow phase. For all these cases, the forward shock velocity at the onset of the radiative snow–plow phase lies in the range of 250 – 350 km s-1.
It is proposed that now after 41000 yrs (Kulkarni et al. kul93 (1993)) following the supernova explosion which gave birth to PSR 2334+61, the remnant is probably in the radiative phase of its evolution. Its current radius is 25 D2.5kpc pc and the shock front is propagating in a inhomogeneous interstellar medium as the optical data indicate. Soft X–ray emission from G 114.3+0.3 is not detected in the ROSAT observation of PSR 2334+61 (Becker et al. bec96 (1996)) and we obtain an upper limit on the unabsorbed soft X–ray luminosity of 6 1035 erg s-1 (0.1 – 2.0 keV). Deep X–ray observations would help to actually determine the X–ray properties of the remnant or place new, more stringent upper limits.
6 Conclusions
The supernova remnant G 114.3+0.3 was observed in major optical lines. New diffuse structures were detected in the south–east and central areas of the remnant. The flux calibrated images imply that the diffuse emission is associated with G 114.3+0.3. In addition, we discovered an O iii filament in the south which is very well correlated with the radio contours at 4850 MHz. Long–slit spectra along this filament suggest that the emission arises from shock heated gas, while the sulfur line ratios indicate low electron densities.
Acknowledgements.
The authors would like to thank R. Fesen for his helpful comments. We would also like to thank the referee for his remarks and suggestions. Skinakas Observatory is a collaborative project of the University of Crete, the Foundation for Research and Technology-Hellas and the Max-Planck-Institut für Extraterrestrische Physik. This work has been supported by a P.EN.E.D. program of the General Secretariat of Research and Technology of Greece. This research has made use of data obtained through the High Energy Astrophysics Science Archive Research Center Online Service, provided by the NASA/Goddard Space Flight Center.
References
- (1) Becker W., Brazier K.T.S., Trümper J. 1996, A&A 306, 464
- (2) Boumis P., Mavromatakis F., Paleologou E.V. 2001, A&A, submitted
- (3) Cioffi D. F., McKee C. F., Bertschinger E. 1988, ApJ 334, 252
- (4) Condon J. J., Broderick J. J., Seielstad G. A., Douglas K., Gregory P. C. 1994, AJ 107, 1829
- (5) Cox D. P., Raymond J. C. 1985, ApJ 298, 651
- (6) Cox D. P. 1972, ApJ 178, 159
- (7) Fesen R. A., Kirshner R. P. 1980 ApJ 242, 1023
- (8) Fesen R. A., Winkler P.F., Rathore Y., Downes R.A., Wallace D., Tweedy R.W. 1997, AJ 113, 767
- (9) Frail D. A., Goss W. M., Whiteoak J. B. Z. 1994, ApJ 437, 781
- (10) Fürst E., Reich W., Seiradakis J. 1993, A&A 276, 470
- (11) Hartigan P., Raymond J. and Hartmann L. 1987, ApJ 316, 323
- (12) Hakkila J., Myers J. M., Stidham B. J. and Hartmann D. H., 1997, AJ 114, 2043
- (13) Hester J. 1987, ApJ 314, 187
- (14) Kallas E. and Reich W. 1980, A&AS 42, 227
- (15) Kulkarni S.R., Predehl P., Hasinger G., Aschenbach B. 1993, Nature 362, 135
- (16) Lynds B. T. 1965, ApJS 12, 163
- (17) Mavromatakis F., Papamastorakis J., Paleologou E. V., and Ventura J. 2000, A&A 353, 371
- (18) Mavromatakis F., Ventura J., Paleologou E. V., and Papamastorakis J. 2001, A&A 371, 300
- (19) McKee C. F., Cowie L. 1975, ApJ 195, 715
- (20) Osterbrock D. E. 1989, Astrophysics of gaseous nebulae, W. H. Freeman & Company
- (21) Reich W. and Braunsfurth E. 1981, A&A 99, 17