Conference Summary
Astronomy Department, California Institute of Technology, Pasadena CA 91125, USA
1. Introduction
Clusters of galaxies are of wide interest in the astronomical community both as laboratories where baryons and dark matter can be conveniently studied and, through their statistical properties at various look-backtimes, as tracers of cosmic structure and evolution. The Local Organising Committee wisely narrowed the topics of this meeting to four broad themes and so I will organise my summary remarks under these headings.
First I think I should address the plea ”Why bother to study clusters?”, raised provocatively by Colin Norman at one stage during the proceedings111Fortunately, I have forgotten to which speaker he made this remark!. We have learnt enough about clusters and the growth of structure to know that two of the traditional motivations require much more careful consideration.
For years on time allocation committees, I read observers repeat a mantra in the first sentence of their proposals: “Clusters of galaxies represent the largest bound structures in the Universe..” in justification of their role as tracers of large scale structure. A number of speakers at this meeting reminded us that clusters no longer uniquely occupy this role. We have other tracers of large scale structure and, moreover, it seems we need to be much clearer of what exactly we mean by a cluster before we can convincingly use them as cosmological probes.
A second, traditional, motive for studying clusters has been observational convenience, e.g. in studying constituent populations such as galaxies at various look-back times. At first sight, it’s an attractive proposition for an observer to study a few rich clusters at various redshifts each containing hundreds of accessibly-luminous galaxies and then to “join the results” in a timeline to make some evolutionary claim. But, at most redshifts of interest, we can expect to find a wide range of overdensities represented (groups, merging systems, virialised clusters). Put simply, rich cluster A at =1.2 is unlikely to evolve into rich cluster B at =0.5 and neither may necessarily become a present-day Coma.
Both these worries indicate a high degree of rigour is needed in using clusters. We need very large samples spanning ranges of mass at any redshift of interest and perhaps it would be foolish to adopt one single selection criterion for their study. A similar “panchromatic” theme has emerged over the past decade in understanding how to address the question of evolution using samples of galaxies.222Witness the controversy surrounding the use of UV/optical and far-infrared probes of the cosmic star formation history. No single technique wins: several are required.
The motivation for studying clusters that emerged at this meeting focused broadly along the following themes:
-
•
Testing gravitational instability by measuring the number density of massive clusters at high redshift, viz. .
-
•
Breaking degeneracies in estimates of the the cosmological parameters by examining the local population of clusters as a probe of the mean mass density and the normalisation of the mass power spectrum, and .
-
•
Verifying hierarchical structure and the nature of the dark matter and keeping those theorists in check who predict a universal mass profile with central cusps, .
-
•
Determining the origin of the heating of the intracluster medium, its enrichment history and examining whether non-gravitational processes are involved.
-
•
Examining the history of spheroidal galaxies and role of the environment, for example in understanding the origin of the morphology-density relation and the destiny of the infalling component of gas-rich field galaxies.
Let me make a disclaimer in what follows. I am not an expert in any of the areas I was asked to summarise and so I submit these concluding remarks only as someone who tried to listen carefully to most talks, dutifully avoiding the lunchtime mountain hikes to make sense of what I heard333I apologise if I missed some talks but I tried to secure powerpoint files or transparencies for most of those.. With 70 talks and 80 posters, inevitably I have had to be very selective in discussing results.
If one could summarise the meeting in two paragraphs, I would say the following:
-
•
There is an explosion of terrific data, from large surveys (X-ray and ground-based) which offer qualitatively new ways in which we find and do statistical studies of clusters, and also in resolved data within clusters which opens up new opportunities for understanding the detailed astrophysics of dense environments.
-
•
The subject is moving from exploratory surveying to detailed astrophysics. As part of this “growing up” there is a need to admit defeat on some of the old methods and to embrace new ones, particularly on the statistical questions. For many years cluster workers had something of a monopoly in the study of early galaxies and large scale structure, but it is time to take advantage of other datasets being delivered and view cluster astrophysics as only one part of a larger body of information.
2. Searching for Distant Clusters
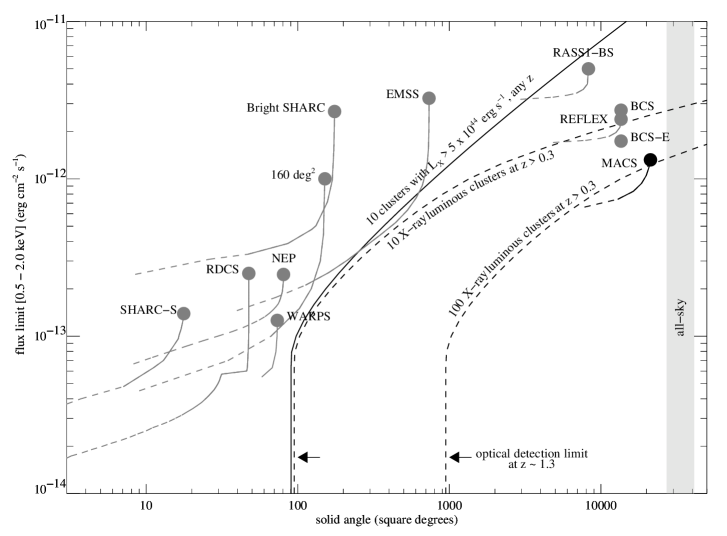
During the first part of our meeting we listened to progress made in finding clusters, mostly (but not exclusively) at high redshift. We heard about a bewildering number of deep surveys (MACS, REFLEX, WARPS, LCDCS, EIS, RDCS to name but a few..Figure 1) each requiring significant follow-up with the world’s most powerful facilities. Excellent reviews of this active field have been given by Borgani (2001) and Borgani & Guzzo (2001).
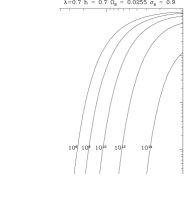
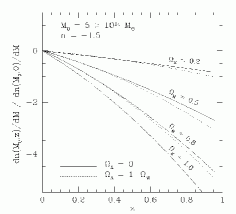
The motivation is a sound one: testing gravitational instability in the context of a known cosmological model, or alternatively, by assuming a structure formation model such as CDM, constraining the cosmological parameters. The fraction of collapsed large massive structures () at, say, 1 for a given cosmology is one of the most robust predictions of the dark matter models (Figure 2). The necessary ingredients are a large well-defined sample and robust estimates of the cluster masses.
An additional motivation for locating high clusters, is to undertake evolutionary studies. For galaxies, this is less appealing now we can find statistically-complete field samples at similar redshifts by independent photometric means (Adelberger 2000, Daddy et al 2001, McCarthy et al 2001), many of which are extensive enough for locating clustered objects in a self-consistent way. Marc Postman stressed the dangers here by contrasting differences found between conclusions drawn from galaxies studied in the X-ray selected CNOC and optically-selected Morphs samples. If clusters are found by a manner which relates to the properties of their constituent galaxies (e.g. by only searching for ones with prominent red sequences as discussed by Mike Gladders, or finding ones associated with powerful radio galaxies as reviewed by Philip Best), one can get different views of what is going on in dense regions.
The quest for high clusters has a chequered history. Most of the early work was motivated by a quest for the deceleration parameter based on brightest cluster galaxies (Gunn & Oke 1975, Kristian et al 1976). Denis Zaritsky gave us a new twist to this story with his evidence for varying accretion onto brightest cluster galaxies in the Las Campanas Distant Cluster Survey (see also Aragón-Salamanca et al 1998). Claims for number evolution in cluster counts with redshift have also swung to and fro over the years. Until recently only a handful of optical or X-ray selected clusters were available444On more than one occasion, challenges to a standard paradigm have been made on the basis of the existence of a single high , assumed massive, cluster.. The most exciting aspect about this meeting is the enormous advance in the numbers of distant clusters.
So how best to find distant clusters? Marc Postman nicely summarised the various search techniques, their advantages and biases. The most useful techniques are those that minimise projection effects. Faint X-ray surveying in the 0.1-10 keV range is cerainly an expensive method in telescope time (but good things don’t come cheap): the background is low, we expect and thus, so long as massive clusters have hot intracluster media, this is the method of choice. Kathy Romer emphasized how, even with the higher EPIC background, XMM promises to extend the depth of the ROSAT surveys to mean redshifts well beyond 1.
Whilst we have yet to reap the benefits of SZ effect as a survey tool, James Bartlett showed us that this method has the great advantage of being distance independent (modulo evolution) with a signal . Instruments such as Planck Surveyor, and the proposed Arcminute Microkelvin Imager which Rüdiger Kneissl described, should also readily probe beyond 1.
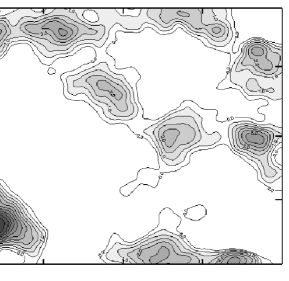
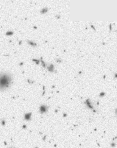
In a similar category to the SZ effect is weak lensing. As this technique wasn’t explicitly reviewed at the meeting, I reproduce the nice discovery of a =0.28 cluster by Wittman et al (2001) in Figure 3. Although lensing offers the most direct route to the total mass, it still suffers from projection effects, the effect of the mass sheet degeneracy555Mass estimates based on weak shear of a background population are insensitive to an additional unclustered component of dark matter. and, as a high density of background galaxies is needed, the technique will most likely be limited to the study of clusters with 0.10.8.
Concerning the optical searches, Marc showed us, from the analysis of Goto et al (in preparation) how, even locally within the SDSS, changing the search algorithms can deliver very different samples. This is worrying to me as I imagine this kind of uncertainty can only be worse in faint surveys. While smart ideas such as “matched filters” designed to minimise projection and maximise contrast, are of course to be welcomed there is a natural concern that, like Maximum Entropy restoration techniques, such methods work reliably only when we have a clear idea of what we are searching for. Do we?
The Red Cluster Sequence method described by Mike Gladders seems the most promising of the optical methods. Indeed the authors claim it to be “comparable or superior to X-ray methods” (Gladders & Yee 2000) - a bold assertion! Certainly panoramic detectors sensitive in and make this a much more efficient way to locate red colour-magnitude sequences to 1 and, at CFHT, there is the prospect of coupling lower detections with weak lensing constraints to directly get masses. Simulations suggest this search technique should be complete to 1, even allowing for some dispersion and bluing in the color-magnitude relation. Unless there is a (perverse) population of massive clusters devoid of a uniform population of spheroidals, the technique seems a sound one.
But the next thorny issue is how to get a reliable mass, the second important requirement to test Figure 2 and one worth thinking about before embarking on any time-consuming survey! The mass of a distant cluster has traditionally been inferred from the X-ray luminosity (assuming a relation), an optical richness (very crude) or a velocity dispersion based on a few members. Clearly none of these is really adequate. This is, I think, where the X-ray surveys win hands down even if “smart” algorithms rescue the optical searches. We can fully expect, with adequate investment, X-ray temperatures for large numbers of distant clusters in the coming years. Brian Holden showed new Chandra data that indicates little evolution in the relation to 0.8. Whilst assumptions are necessary to link and virial mass (Voit 2000), the prospects look good, particularly with cross-checks from the SZ effect. Lauro Grego showed us the promise of deriving masses independently from her interferometric SZ techniques.
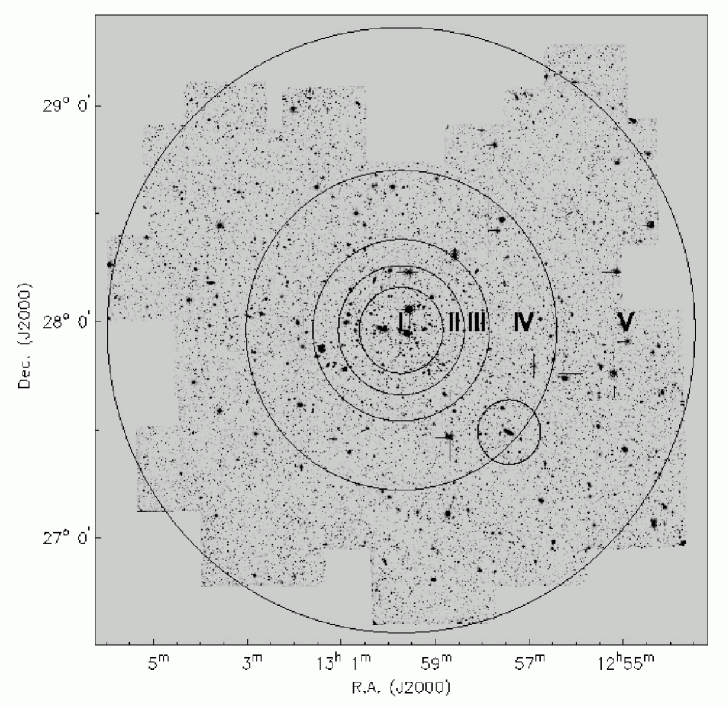
The major problem in my opinion is that the optical searchers have no real route to cluster mass (except by recourse to independent X-ray techniques or perhaps weak lensing over a limited range); projection also remains an issue. Multiple systems, often separated by only modest velocity differences, would be very hard to detect without a huge spectroscopic investment. A good example in showing the pitfalls is the cluster surrounding the =1.206 galaxy 3C324 (Smail & Dickinson 1995, Figure 4) now known from spectroscopic evidence to consist of two components separated by only 0.06. Although radio-selected, not only would its richness have been overestimated without careful spectroscopy, it seems unlikely the Red Sequence method applied to a similar system at any redshift would be able to photometrically-separate the two systems.

In the case of the local X-ray cluster data essential as a basis for all high comparisons, Luigi Guzzo and Hans Böhringer demonstrated the remarkably precise cluster luminosity function obtained from the REFLEX survey. Few would disagree that this is a major achievement in the subject not just in statistical terms but also because of the considerable care taken to ensure homogeneity in the survey.
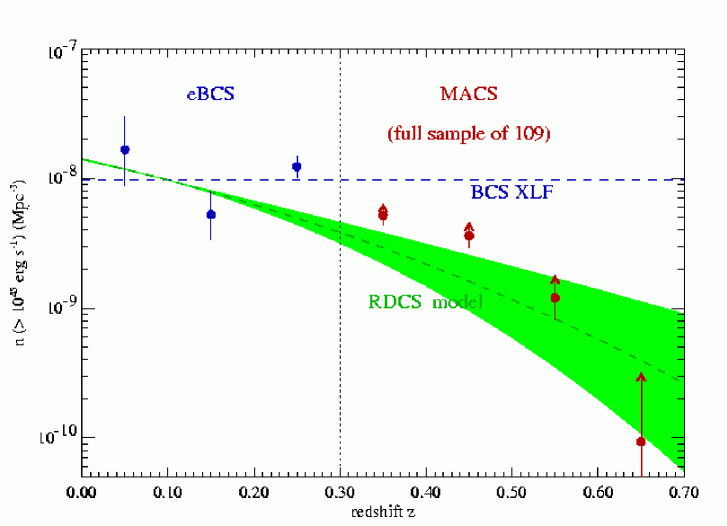
Turning then to the cosmological results and necessarily being somewhat selective, Harald Ebeling (MACS) and Piero Rosati (RDCS) discussed a fairly modest decline in the abundance of massive clusters to 1 (Figure 5); this is a fairly convincing conclusion for 0.5 but beyond I suspect there is still some room for manoever. Qualitatively, this is similar to the 4.7 decline claimed by Gioia (2001) in her NEP sample (not discussed at this meeting). Stefano Borgani has modelled the decline with redshift in the RDCS-3 sample with available data and claims the data is consistent with popular choices of and (see 3).
Can we say there is “concordance” between the observers? Not yet but good progress is being made. Most of any agreement refers to evolution in luminous, presumed massive, clusters. A number of niggly issues remain including the effects of incompleteness, cosmic variance for the smaller field surveys, AGN/cooling flow contamination, and how to compare surveys with minimal overlap. For example, at the lower luminosities probed by the WARPS survey, the situation is quite unclear with some arguing for no evolution at all. Much of the dispersion in the inferred evolution arises from uncertainties in the number of local massive clusters against which comparisons are needed. WARPS and RDCS appear to disagree on the “local” abundance to an extent that seriously affects their respective analyses. However, the prospects for extending these tests to higher redshift and clarifying the temperatures with Chandra appear very promising, even before the new XMM surveys are underway.
As an outsider to the subject of distant X-ray cluster surveys, I was struck in both Harald and Marc Postman’s reviews of the large number of competing surveys underway. If the labour involved in constructing these surveys was not enough, remember that the time required to fully exploit them is even larger. For example, the construction of Ebeling’s ROSAT-based MACS sample of 840 clusters involved two colour CCD imaging and spectroscopic verification of a significant sample. To exploit all 109 clusters beyond 0.3 with multi-slit spectrographs, a weak lensing deep imaging study, Sunyaev-Zel‘dovich (SZ) detections and other applications would require almost dedicated access to a huge range of facilities (a tall order even by Harald’s standards!). When one realizes this is just one of the many ambitious surveys we heard about with more in the pipeline, I worry has the planning of all these surveys seriously taken into account the necessary investment for a full exploitation?
3. Mapping Large Scale Structure with Clusters
Bob Nichol gave us a very balanced review of the changing role of clusters as new probes of large scale structure became available. He also posed some controversial questions, e.g: “in the era of galaxy and lensing surveys, who needs clusters?” He also stressed many of the complications that arise from the frequent merging of clusters on our assumption of relaxed systems in virial equilibrium.
I think it fair to say the traditional role of using clusters selected in various way (optically from the Abell/ACO catalogues or from X-rays) as the most efficient way to get to the mass power spectrum on large scales is being overtaken by the large redshift surveys. In the era of 2dF and SDSS, huge volumes populated by over 100,000 galaxies are publically available666See http://www.mso.anu.edu.au/2dFGRS/ & http://archive.stsci.edu/sdss/edr_main.html. and delineate the power spectrum more reliably than the earlier Abell/ACO cluster samples whose integrity is still being debated. In the case of the X-ray cluster samples, Luigi Guzzo’s analysis of the REFLEX survey is comparable in importance to 2dF and SDSS at the time of writing. A particularly impressive achievement in that sample is the detection of infall in the plane convincingly demonstrating the quality of the sample. However, the redshift surveys are continuing apace and from them one can create far more reliable spectroscopically-based cluster samples. Of particular interest is the volume to 0.55 probed by SDSS Luminous Red Galaxies survey. The message is clear: wholesale galaxy mapping has arrived..use the data!
Bob drew attention to possible “baryon wiggles” in both the power spectrum of Abell/ACO clusters seen by Miller et al (2001) and referred to one tentatively in the 2dF data (Percival et al 2001). It must be remembered that, in such plots, the redshift-space power spectrum is significantly affected by aliasing introduced by the window function of the survey volume. Without careful simulation of this effect it is very hard to be sure whether bumps are artefacts or genuine baryon oscillations. Neither the REFLEX not the 2dF surveys claim to have detected these features. Indeed, the 2dF team estimates unless the baryon density is much higher than expected, they will remain undetected in the completed SDSS survey.
Elena Pierpaoli described a second aspect of local cluster statistics, namely constraining the amplitude of the mass power spectrum. The abundance of clusters of known mass provides a joint constraint on the variance, on 8 Mpc scales and the mean mass density, in a form dependent on . By adding X-ray temperature measurements and improving the mass- connection, an improved constraints has been determined. In the past year, the same constraint has also been probed in a completely independent way via weak lensing studies of randomly-chosen fields (so called “cosmic shear” surveys) (eg. van Waerbeke et al 2001, Bacon et al 2000, 2001 in prep.). Reassuringly both methods get fairly similar answers with =0.40-0.50 although it is important to remember that cosmic variance and the redshift distribution of the background faint galaxies may affect uncertainties in the lensing estimates777Since the conference, estimates about 20% lower for the combination of and have been published, both from cluster studies and large scale structure results. Lahav et al (astro-ph/0112162 gives a good summary)
The weak lensing results are independent of any assumed cluster population and do not rely on Gaussian fluctuations in the mass spectrum. Accordingly, comparisons of lensing and cluster-based methods are an important way to verify the assumptions we may take for granted, not only in the cosmological framework but also in cluster physics.
4. Physical Processes Within Clusters
We had an interesting session on the internal mass distributions within cluster where Andrea Biviano gave a very comprehensive review of years of effort invested in estimating orbital anisotropies and mass distributions in clusters. The number of clusters which have been comprehensively surveyed spectroscopically is increasing rapidly and the new field surveys (SDSS, 2dF) will generate lots more. Cluster galaxy dynamics will remain a critical tool in determining the orbital anistropy of cluster galaxies of different types. As Andrea showed, there is convincing evidence that spheroidal galaxies retain an isotropic velocity field, consistent with their long-standing membership, whereas late type systems show a detectable radial anisotropy reflecting their continuous infall.
The peripheries of clusters at moderate redshifts are largely unstudied regions important in linking cluster-based environmental evolution to that in field galaxies. Tommaso Treu and Taddy Kodama described complementary dynamical/HST and photometric imaging programs to address this question. Kodama finds a potentially important result whereby the colours of field galaxies undergo a sharp transition from blue-to-red at some galaxian surface density, presumably reflecting some process associated with their arrival at the cluster. Treu is embarking on a longer term project to understand the mechanistic details of infall in a single well-studied cluster. Both routes are important ones to pursue.
Andrea was cautious about deriving mass profiles from galaxy velocities. This has been a long standing problem in individual clusters, even Coma, because of the inevitable degeneracies arising from unknown orbital anisotropies as a function of radius. If a functional form is adopted for the mass profile (e.g. NFW), solutions can be found but the present motivation is surely to determine these forms directly, as is possible in a more competitive way with X-ray data in the inner regions and weak lensing to the periphery. Steve Allen showed how much progress has been made in reconciling strong lensing and X-ray based mass estimates following improved Chandra data on 7 clusters and found no significant deviations from the universal mass profile seen in numerical simulations.
In an effort to overcome some limitations, it has become common practice to co-add data from many clusters in the hope of improving signal to noise and erase asymmetries. Peter Katgert and Roland van der Marel showed us results from coadded samples based on the ENACS and CNOC surveys respectively, and concluded mass traces light to a reasonable approximation. However, is a composite cluster really a physical entity? A number of critics were unconvinced because of the dangerous effect one or two “complex” systems might have on the final conclusion. Even with a substantial number of redshifts, it seems one has to be cautious in interpreting dynamical data in terms of a simple gravitational potential.
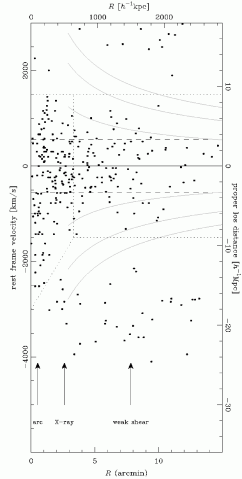
A salutory lesson can be learnt from the comprehensive survey of the regular cluster Cl0024+16 (see Treu et al, Metevier et al, these proceedings) by Czoske et al (2001). For many years this was regarded as a classic regular virialised system at =0.4 and its mass profile even formed the basis for promoting self-interacting dark matter as discussed by Oleg Gnedin. However, when 650 redshifts were gathered (of which 295 are members), Czoske et al resolved a foreground system (whose mass was initially thought to be quite modest but now is claimed to be significant) undergoing an end-on merger with the main body of the cluster (Figure 6). This discovery may explain its low X-ray luminosity c.f. the original high velocity dispersion. With less than 100 member velocities, Cl0024+16 would surely have been considered a representative cluster for coaddition but now we know it is a more complex beast. Bootstrap-style experiments might be helpful to clarify the robustness of the coaddition procedure.
Soon after the first X-ray detections of hot gas from the intracluster medium (ICM) were detected, it was realised that most of the baryons in clusters are in gaseous form. Assuming an isothermal distribution, the surface brightness profiles offer a valuable probe of cluster mass disribution, and the X-ray morphology indicates the evolutionary state. Clusters are expected to continuously assemble in popular hierarchical models and we can expect to directly witness this growth via shock heating events.
XMM and Chandra are transforming this field and this conference has provided one of the first opportunities for us to discuss the assumptions made in analysing earlier data. Monique Arnaud illustrated some of this progress in her excellent review. Although merging substructures produce shock-heating Chandra reveals unforeseen complexities, for example in the “cold fronts” seen in some clusters which suggest the associated timescales may have been underestimated. Monique demonstrated several lines of evidence for the continuing assembly of clusters (X-ray substructure, anisotropic accretion etc). However, even in the well-studied case of the outskirts of the Coma cluster, Uli Briel demonstrated significant uncertainties in understanding the merger timescales involved. Such data are thus illustrative of hierarchical assembly but may not give us the needed quantitative verification of mass assembly.
The most striking aspect of the new high quality data is the growing evidence for non-gravitational processes in understanding the physics of the ICM. Whilst temperature profiles obtained with ASCA and BeppoSAX were often discrepant (as discussed by De Grandi), the XMM data gives reasonable support to the assumption of isothermal cores. However, the expected self-similar “scaling laws” between the gas mass, virial radius and X-ray temperature, e.g. in are not obeyed. The steep relation implies non-gravitational processes, almost certainly associated with additional heating mechanisms.
Theoretical explanations for the steep relation were the subject of almost an entire afternoon session. There was a bewildering number of ideas. Fabio Governato reviewed for us how feedback heating can be incorporated in numerical simulations and showed that a steep relation cannot be easily explained via conventional heating sources such as supernovae. Paolo Tozzi demonstrated that, with an energy of 1-2 kev/baryon, AGN are a promising possibility but it seems there is no obvious evidence for heating from these sources. Peter Thomas from the VIRGO consortium can predict the slope but only at the expense of a strong evolution in the relationship. Uros Seljak gave us an analytical model based on a universal gas profile where departure from self-similarity arises from a temperature-dependent hot gas fraction.
Perhaps that glass of wine at lunchtime was not a good idea but this was a confusing session for me. Unlike observers who compare ASCA/BeppoSAX/XMM temperature profiles, worrying about sensitivity, psf and background differences, when it comes to numerical simulations, I am puzzled that there appears to be no necessity to inter-compare results. Surely this is a first step in convincing anyone of the believability of a particular simulation?
Additional physical complexities in the inner cool cores of clusters were reviewed by Andy Fabian. In the physical environment of a dense cluster core, hot gas is able to cool radiatively in a timescale of less than years and a stable flow of cooling gas to the cluster centre is expected. Almost 50% of all X-ray clusters show some signs of the associated temperature gradient implying mass inflow and deposition rates of 10-100 yr-1. However, XMM spectra show no sign of the expected Fe XX lines of radiative cooling in the 13-18 Å range. Hans Böhringer also discussed additional temperature diagnostics unaffected by absorption effects. Either the gas is not cooling radiatively or there is perhaps is a balancing effects from a hitherto-unidentified heating mechanism. And there are serious duty cycle issues concerned with preventing cooling beyond 2-3 kev.
As usual, Andy had no shortage of ideas for resolving the puzzle, the most intriguing from my perspective being the hypothesis of a starkly bimodal metallicity distribution which has the desired effect of suppressing the amount of cooling witnessed through the diagnostic iron lines. Like most conference participants I suspect, I have little idea where this additional complexity in the ICM physics is taking us. The Chandra images of the Perseus cluster discussed by Schmidt (with such enthusiasm!) show holes in the X-ray emission where the gas appears hotter and more metal rich. Dynamical complexities were introduced by Ettori in the wealth of data he presented for Abell 1795. A number of speakers introduced magnetic fields associated with radio polarisation (in the case of Abell 2255 discussed by Govoni), radio sources (although as Fabian remarked the gas is not obviously hotter in these regions) or in explaining the survival of cold clouds with associated fronts (Arnaud).
I think we can be optimistic that there is a lot to learn which will assist in the entire interplay between gas cooling, star formation and enrichment. Many years ago at a conference I attended in Cambridge, Andy claimed confidently that cooling flows provided a key mechanism for the formation of giant elliptical galaxies. Although cooling flows remain controversial, Andy can still assert (as Richard Bower emphasised independently) that the physics of gas cooling in cluster cores will tell us much about feedback and star formation: still key ingredients in galaxy formation.
5. Evolution of Galaxy Populations within Dense Environments
On the last day, Pieter van Dokkum surveyed the literature on the role that clusters continue to play in our understanding of galaxy formation and evolution. There is a subtle shift of emphasis however. Rather than being “laboratories of convenience” 888Perhaps there is a better terminology here!, galaxies in clusters are now being studied alongside equivalent field populations and as likely successors to well-studied Lyman break galaxies at 2.
Most of the discussion, by van Dokkum, Rosati & Kelson, concentrated on the role of very distant (0.5) clusters, largely in terms of differentiating stellar ages and the ages of mass assembly of giant ellipticals. Our large telescopes are being flexed to their limits to secure impressive fundamental plane data (to 1.2 in 12 hour Keck exposures!) which continues to support the notion that old stellar populations in at least some fraction of the data. That the stars in ellipticals may be older than the assemblies in which they now reside is illustrated in the red mergers seen in the well-studied X-ray luminous cluster MS1054 (=0.83). Pieter posed the question of how common such a system might be and gave some new examples of red mergers in other clusters. It is good to see some progress in separating the ages of stars from those of the accumulated mass that makes up giant ellipticals.
The biases introduced not only in selecting galaxies within clusters (by HST morphology, by colour or infrared magnitude) but also by how the clusters themselves were selected (X-ray, optical..) continue to worry me. D. Fadda also reminded us how gas rich and dusty systems may be common even in dense clusters. As remarked earlier, it is hard to know what errors are made by connecting data at different redshifts to delineate an evolutionary picture. One suspects we are reliant either on theoretical modelling (heaven forbid!) or comparative field samples. Beyond 0.5 this will be some time coming although a number of speakers alluded to the upcoming Keck and VLT spectroscopic surveys.
It is now 20 years since Alan Dressler published his quantitative study of the morphology-density relation in a nearby sample of 55 rich clusters (Dressler 1980). Pieter and Bianca Poggianti urged us to go back and improve the local samples now we have panoramic CCD cameras and multi-object spectrographs so we can be sure of the local fractions (Figure 7). A key issue here is the origin of S0s; the Morphs team (Dressler et al 1997) proposed their recent demise from gas stripping and tidal effects and presented a strong claim for an evolving E/S0 fraction with lookback time. Pieter urged us to be much more cautious in differentiating Es and S0s; with resolved spectroscopy of 0.5 galaxies feasible on many telescopes, this appears to be a profitable route in conjunction with HST data.
6. Parting Thoughts
This has been a fascinating meeting and we have a lot to be thankful for. Foremost we have amazing observational facilities capable of finding clusters and studying them to great depths in complementary ways. We now can resolve clusters at the arcsec level in X-rays and locate their concentrated masses with S-Z and weak lensing techniques. We can also locate local clusters as byproducts in the comprehensive redshift surveys being undertaken. Instead of viewing these as competing techniques we should exploit them all as complementary probes to check our physical assumptions.
We also have the opportunity to learn new physics in the cluster cores from the paradoxes emerging from the steeper relations and the absence of lines of radiative cooling in those with temperature gradients. It should perhaps be no surprise that simple gravitational physics is not enough to explain what we see. The fall-out in our understanding of galaxy and cluster formation from resolving this paradox could be a big one.
As the concluding speaker I want to thank Drs Mardirossian and Mezzetti for all the necessary arrangements here at beautiful Sesto Pusteria and to the Organising Committee for their hard work. We should in particular thank Stefano Borgani for his obvious insight in constructing a thoughtful scientific program and amazing energy he and his colleagues invested in making this a great meeting!
References
- 1 Adelberger, K. 2000 in Clustering at High Redshift, eds. Mazure, A. et al, ASP Conference Series, 200, p13.
- 2 Aragón-Salamanca, A. et al 1998 MNRAS, 297, 427.
- 3 Bacon, D.J. et al 2000 MNRAS 318, 625.
- 4 Beijersbergen, M. et al 2001 MNRAS in press (astro-ph/0106354).
- 5 Borgani, S. 2001 in Galaxy Clusters and the High Redshift Universe Observed in X-rays, eds. Neumann, E. et al in press (astro-ph/0106471).
- 6 Borgani, S. & Guzzo, L. 2001 Nature 409, 39.
- 7 Czoske O., et al. 2001, A&A, in press(astro-ph/0111118)
- 8 Daddy, E. et al 2001 A&A 376, 825.
- 9 Dressler A. 1980, ApJ, 236, 351.
- 10 Dressler A. et al. 1997, ApJ, 490, 577.
- 11 Fukugita, M. 2000, in Proc. 30th ICHEP, eds. Lim, C.S. & Yamanata, T., World Sci. p299.
- 12 Gioia, I. 2001 in Chemical Enrichment of the Intracluster Medium in press (astro-ph/0107452).
- 13 Gladders, M. & Yee, H.C. 2001 in Cosmic Evolution & Galaxy Formation, ed. Franco, J. et al, ASP Conf. Series 215, p233
- 14 Gunn, J.E. & Oke, B. 1975 ApJ, 195, 255.
- 15 Kodama T., et al. 2001, ApJ, 562, L9
- 16 Kristian, J. et al 1976 ApJ, 205, 688
- 17 McCarthy, P. et al 2001 ApJ, 560, L31.
- 18 Miller et al 2001 ApJ, 555, 68.
- 19 Percival, W. et al 2001 MNRAS 327, 1279.
- 20 Smail, I. & Dickinson, M.E. 1995 ApJ, 455, L99.
- 21 van Waerbeke, L. et al 2001 A&A 374, 757.
- 22 Voit, G.M. 2000 ApJ, 543, 112.
- 23 Wittman, D. 2001 ApJ, 557, L89.