The Limiting Stellar Initial Mass for Black Hole Formation in Close Binary Systems
Abstract
We present models for the complete life and death of a 60 star evolving in a close binary system, from the main sequence phase to the formation of a compact remnant and fallback of supernova debris. After core hydrogen exhaustion, the star expands, loses most of its envelope by Roche lobe overflow, and becomes a Wolf-Rayet star. We study its post-mass transfer evolution as a function of the Wolf-Rayet wind mass loss rate (which is currently not well constrained and will probably vary with initial metallicity of the star). Varying this mass loss rate by a factor 6 leads to stellar masses at collapse that range from 3.1 up to 10.7 . Due to different carbon abundances left by core helium burning, and non-monotonic effects of the late shell burning stages as function of the stellar mass, we find that, although the iron core masses at collapse are generally larger for stars with larger final masses, they do not depend monotonically on the final stellar mass or even the C/O-core mass. We then compute the evolution of all models through collapse and bounce. The results range from strong supernova explosions () for the lower final masses to the direct collapse of the star into a black hole for the largest final mass. Correspondingly, the final remnant masses, which were computed by following the supernova evolution and fallback of material for a time scale of about one year, are between 1.2 and 10 . We discuss the remaining uncertainties of this result and outline the consequences of our results for the understanding of the progenitor evolution of X-ray binaries and gamma-ray burst models.
1 Introduction
It has long been known that stellar-mass black holes could form from the collapse of massive stars (Oppenheimer & Snyder 1939) and it is believed that above some progenitor initial mass limit, stars collapse to form black holes. A growing set of evidence suggests that this mass limit in single stars () lies somewhere below 25 M⊙. Fryer (1999) obtained this result from core collapse simulations. Maeder (1992) and Kobulnicky & Skillman (1997) find it to be most consistent with nucleosynthesis constraints. And the explosion of a star of about 20 M⊙ as SN 1987A (Arnett et al. 1989) gives a lower limit to the initial stellar mass required for direct black hole formation (to be distinguished from black hole formation due to fall back; see below). Within the uncertainties of the above studies, it appears that the black hole mass limit of single stars is reasonably constrained.
In this paper, we deal with the black hole mass limit for primary stars of close binary systems (), i.e., for stars which evolve into the compact objects contained in high and low mass X-ray binaries or which might become -ray burst sources: collapsars and black hole binary mergers (see Fryer, Woosley, & Hartmann 1999 for a review). As the presence of a companion star only increases the mass loss of the primary star in a binary system before the first supernova, the black hole mass limit of binaries is likely to be larger than that of single stars (i.e., ).
There are two observational constraints from observed black hole systems on the black hole mass limit in binaries. Using population synthesis studies, Portegies Zwart, Verbunt, & Ergma (1997) find that the number of low mass black hole X-ray binaries in our Galaxy requires . Ergma & van den Heuvel (1998) argue (without detailed modelling) that the observed periods of less than h found in most low mass black hole systems are incompatible with . While the latter argument is based on considerations of angular momentum loss associated with the (uncertain!) Wolf-Rayet winds. In both investigations neither and are distinguished, nor do they consider the dependence of on the type of binary evolution.
Wellstein & Langer (1999; WL99) showed that indeed may be very different from , and is strongly dependent on the type of binary interaction. Only in the so called Case C systems — i.e., in initially wide systems where mass transfer starts only after the primary has evolved through the major part of core helium burning — may the black hole mass limits be comparable; i.e., (Brown, Lee, & Bethe 1999). However, due to the Wolf-Rayet winds, which reduce the total stellar mass and thus the helium core mass during core helium burning, the black hole mass limit for Case A and Case B binaries (mass transfer starts during or directly after core hydrogen burning), is clearly smaller; i.e., and . And although WL99 found that , this result is expected to be different (i.e., ) if less efficient Wolf-Rayet wind mass loss were assumed (i.e., compare our Model 1s2 below with Model 2′ of WL99).
The relevance of detailed binary evolution models for the significance of constraints on from observed X-ray binaries has been demonstrated by WL99. Ergma & van den Heuvel (1998) argued that the pulsar GX301-2, which has a 40…50 M⊙ supergiant companion, originated from a star of more than 50 M⊙, implying that for this particular system. However, WL99 computed detailed Case A progenitor evolution models which satisfy all observational constraints for this system, but in which the pulsar progenitor has an initial mass of only 26 M⊙. This solution implies .
In the following we investigate in detail the black hole mass limit for primary stars in close binary systems, using a particular Case B evolutionary sequence with 60 M⊙ primary star. We study five cases where we only change the stellar wind mass loss rate in the Wolf-Rayet phase of the primary star which we vary over the anticipated regime of uncertainty, i.e., by a factor of 6. For high mass loss rates (e.g., Hamann, Koesterke & Wessolowski 1995, Langer 1989b, Braun 1997, Woosley, Langer, & Weaver 1995), the stellar mass at collapse can reduce down to 3 M⊙ with an iron core mass as low as 1.3 M⊙ (Woosley, Langer, & Weaver 1995). The lower Wolf-Rayet mass loss rates proposed by Hamann & Koesterke (1998) and Nugis & Lamers (2000) result in higher final masses (WL99).
For all five cases, we model the evolution of the primary star up to iron core collapse (Sect. 2), which predicts the final stellar mass and the detailed pre-supernova structure of these objects — e.g., their final iron core mass. We then use these pre-collapse structures to model their collapse through bounce and explosion (if applicable; Sect. 3). Finally, we follow the evolution of the supernova ejecta for about one year, which allows us to estimate the final remnant mass including fall back of previously ejected material onto the compact object. With these coupled simulations we obtain the dependence of the compact remnant mass in a given binary system on the assumed strength of the Wolf-Rayet wind. Implications of our results for determinations of the black hole mass limit and the progenitor evolution of X-ray binaries are discussed in Sect. 4.
2 Pre-Supernova Evolution
In this section, we describe the evolution of the primary star from the end of the Case B mass transfer until core collapse. The earlier evolutionary stages are described in WL99.
2.1 Assumptions and method
Based on evolutionary models of Wolf-Rayet stars, and by comparing observed number ratios of Wolf-Rayet to O stars and carbon to nitrogen rich Wolf-Rayet stars in our Galaxy, Langer (1989b) has proposed a mass-dependent mass loss rate for Wolf-Rayet stars. At the time, this mass loss rate was consistent with results derived from Wolf-Rayet wind model atmospheres for individual objects (e.g., Hamann et al. 1995). With this rate, Woosley et al. (1995) studied the evolution and pre-supernova structure of helium stars. They found fairly small final stellar masses, even for the initially most massive stars in their sample. The inclusion of “clumping” in Wolf-Rayet atmosphere models by Hamann & Koersterke (1998) recently suggests that the mass loss rates of these stars could be considerably smaller. Hamann & Koersterke proposed a clumping ratio of 23, i.e., a reduction of the mass loss rate by the same factors. This agrees with the recent, independant Wolf-Rayet mass loss rate determinations of Nugis & Lamers (2000).
Binary star models with reduced Wolf-Rayet mass loss rates have already been presented by WL99. Here we concentrate on their most massive Model 1 (see Table 1 of WL99), i.e., a binary system consisting of a 60 and a 34 companion with an initial orbital period of 20 days. Note that the primary’s evolution is rather independant of the secondary mass and of the orbital period, as long as the system remains a Case B system, and as long as a merging of both binary components is avoided. We also consider WL99’s Models 1′, and 1′′ which use 1/2, and 1/4 times their “standard” Wolf-Rayet mass loss rate — which is similar to that of Langer (1989b). Here, we denote these respectively as Models 1s1, 1s2, and 1s4. We computed additional models with 1/3 (Model 1s3) and 1/6 (Model 1s6) times their standard Wolf-Rayet mass loss rate. This may cover the range of uncertainty, and it allows us to explore in detail the implications for the pre-supernova structure and the supernova explosions.
The evolution of the binary system prior to and through the mass transfer, and through the Wolf-Rayet mass loss phase was computed with the stellar evolution code described by WL99 (see also Langer 1991b; Braun 1997; Langer 1998). Before ignition of central neon burning, at a central temperature of , the calculation is stopped, and the further evolution is followed using the KEPLER code (Weaver, Zimmerman, & Woosely 1978), similar to the calculations of Woosley, Langer, & Weaver (1993), and that of rotating stars by Heger, Langer, & Woosley (2000). Since both codes use a very similar equation of state, this “link” was unproblematic and did not result in noticeable adjustments of the stellar structure. We followed the evolution of the primary star as a single star until “onset of core collapse”, which we define as the time when the infall velocity in the core exceeds 900 (Woosley & Weaver 1995). At this point, the one-dimensional stellar evolution calculation is stopped. The subsequent core collapse calculations and the start of the supernova explosion are discussed in §3.
2.2 The Wolf-Rayet phase
The massive primary star undergoes two major mass-loss phases. First, it loses mass during a mass-transfer phase due to Roche lobe overflow, which almost uncovers its helium core (see below). Then, Wolf-Rayet winds begin to dominate the mass-loss. Here we discuss how the evolution of the primary varies for different Wolf-Rayet mass-loss multipliers.
The 60 primary star loses most of its hydrogen envelope during the mass transfer phase which ends shortly before the onset of central helium burning, reducing the primary mass to 26.8 . Then the star experiences a Wolf-Rayet stage in which hydrogen is still present (the “WNL” phase). This stage lasts between 25 and 122 (see Table 1) and ends when the hydrogen-rich layers have been lost completely. The luminosity of the star depends primarily on the size of the hydrogen-free core, which is roughly the same for all of our models during this phase. Since, in our simulations, the mass loss depends only on the luminosity and surface hydrogen abundance of the star (see equation 1 of WL99), the total mass lost during this phase scales almost directly with the Wolf-Rayet mass-loss multiplier. Hence, the lifetime of this phase roughly scales inversely with this multiplier. However, the models with lower mass loss rates eventually become slightly more luminous with time since the helium core evolves and grows slightly due to hydrogen shell burning. So the lifetime does not strictly scale with the inverse of the mass loss rate but is slightly shorter than the inverse scaling law imples (Table 1).
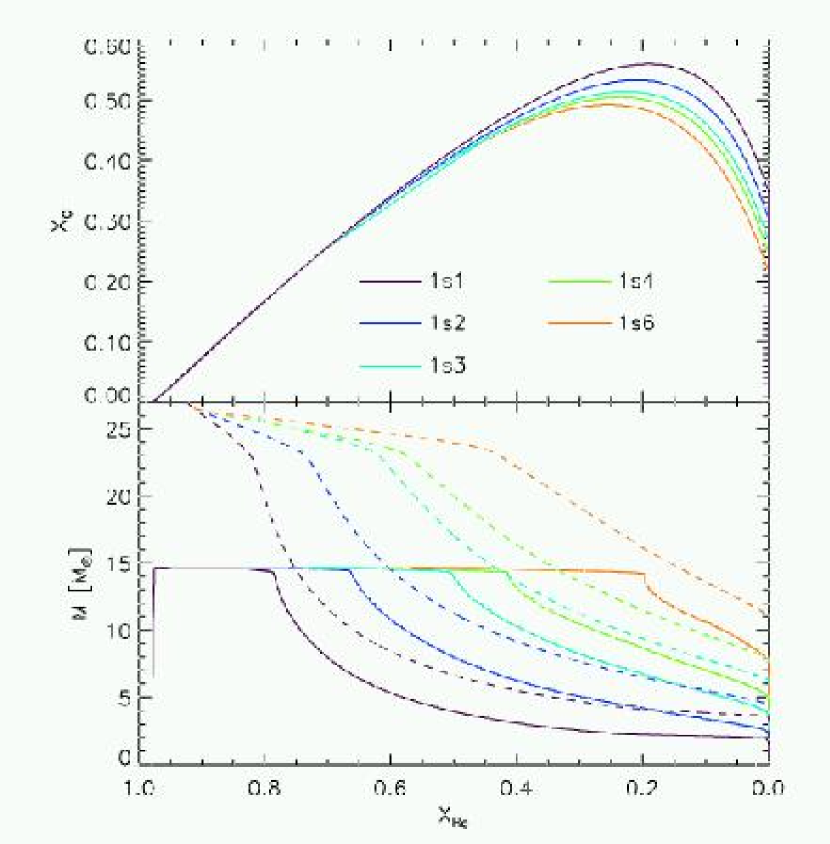
When the helium core is completely uncovered, the star passes through a “WNE” phase and the mass loss rate increases — this corresponds to the “kink” in the line for the total mass of the star in the lower panel of Fig. 1, at a central helium abundance of about 82 % in Model 1s1 and 45 % in Model 1s6. It ends when the star uncovers the layers that are enriched in products of central helium burning. This occurs when the mass drops below the maximum extent in mass of the convective core, or — in particular in the models with smaller mass loss rates — in the partially mixed layers above the convective core (see Fig. 1 of Langer 1991a). This marks the end of the WNE and the beginning of the WC Wolf-Rayet phase.
The total mass lost due to the Wolf-Rayet wind depends much weaker than linearly on the mass loss multiplier (e.g. Model 1s1 loses only 1.5 times as much mass as Model 1s6 through Wolf-Rayet winds; Table 1). The reason is that, unlike in the WNL phase, the helium core mass and its chemical composition change considerably during the WNE phase. Since the stellar luminosity depends on both quantities, this feeds back to the mass loss rate. Assuming the total pressure in the star is due to equal contributions from ideal gas and radiation pressure — which is the case in a Wolf-Rayet star of about 20 — one obtains from homology considerations for chemically homogeneous stars (Kippenhahn & Weigert 1990) with constant opacity
| (1) |
with and . Thus, for constant chemical composition the mass loss rate depends only on the stellar mass. In this case, the mass loss rate of our models were only a function of the stellar mass. However, the mean molecular weight, , changes in the course of helium burning from in the beginig to at the end. According to the above relation, this might change the luminosity of a Wolf-Rayet model of fixed mass by a factor of . Even though in more realistic models this effect is smaller (Langer 1989a), we see that their mass evolution does not follow a simple power law, and that the total amout of mass lost during the Wolf-Rayet stage is not a simple function of the mass loss multiplier. For example, models computed with a lower Wolf-Rayet mass-loss rate enter the WNE phase roughly with the same mass as those with higher mass loss rate, but they do so later in time, i.e., they have by then a chemically more evolved core (Fig. 1). Therefore, they have an increased luminosity at that time, which results in a higher mass loss rate than simply scaling it with the mass loss multiplier would predict.
Additional effects can influence the mass loss rate, e.g., the feature that the convective cores of chemically evolved stars recede later (Fig. 1). Thus, even if the luminosity is the only physical parameter on which the the WNE mass loss rate depends, it varies in non-trivial ways as function of time.
When the products of helium burning appear at the surface of the star, the star enters a “WC” phase. By then, the stellar mass has decreased significantly compared to earlier evolution stages and the star’s evolutionary time-scale becomes much longer than those in the WNL or WNE phases (see Table 1). Only for the lowest mass-loss rate multiplier (Model 1s6; biggest presupernova stellar masses) does the surface oxygen mass fraction become larger than the carbon mass fraction. The final surface helium mass fraction of this model is only 10 %, while it is 40 % in Model 1s1. The final masses are in the range 3.1 10.7 (Table 1).
2.3 From carbon burning to core collapse
An important consequence of the different evolution of the helium core mass (Fig. 1) is different core carbon abundances at central helium depletion (Table 1). This and the C/O-core mass determine the duration and extent of the carbon burning phases and of all later burning stages. The central carbon abundances at core helium exhaustion, , is larger for larger mass loss from the helium core during core helium burning. That is, it is much larger in the primary components of close binary systems than in single stars of the same initial mass (WL99; Brown et al. 2001). And for the same reason, it is a monotonic function of the mass loss multiplier in our study. We obtain the largest value in Model 1s1 (Table 1).
After central helium exhaustion, Models 1s11s3 experience convective core carbon burning, while in Models 1s4 and 1s6 the central carbon abundance is too low and the central burning phase remains radiative.
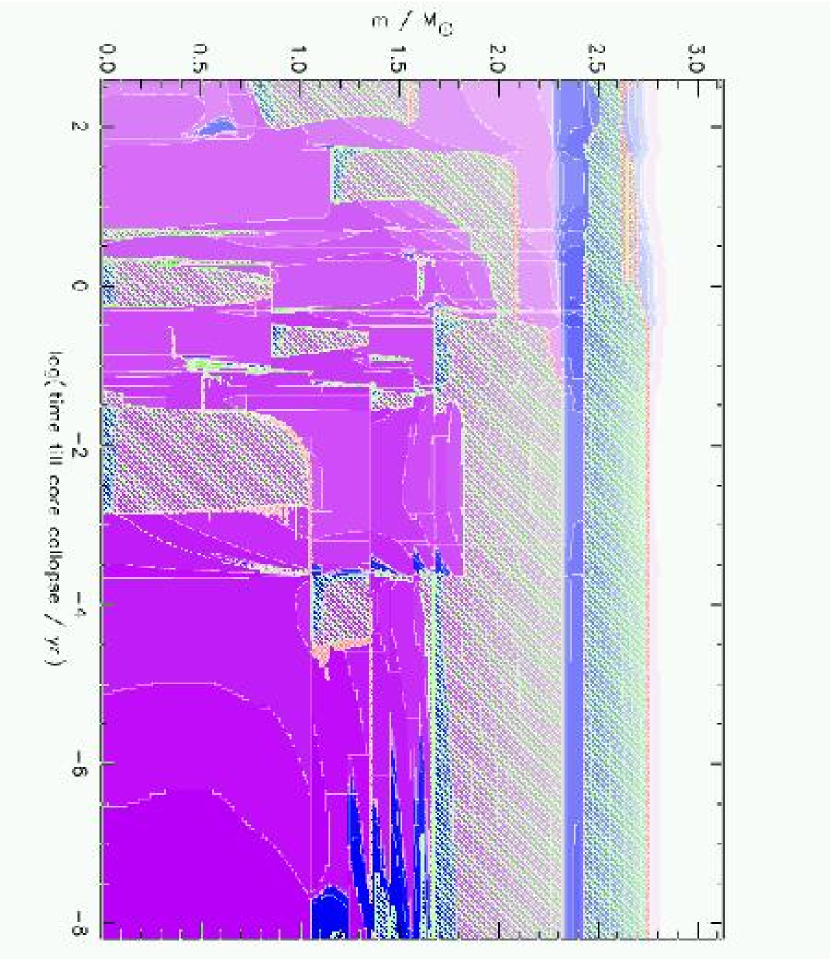
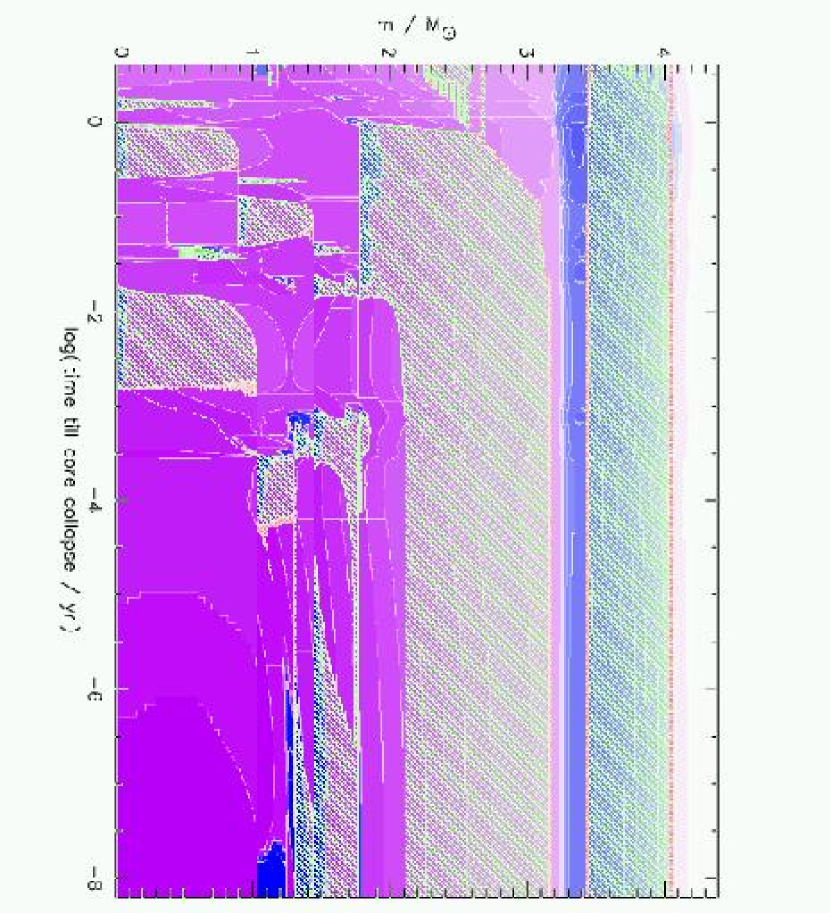
Core carbon burning is followed by carbon shell burning. In Models 1s21s4 the convective carbon shell burns through its fuel and extinguishes before neon ignition (Figs. 2 – 4; Model 1s1 has two phases of carbon shell burning before core neon ignition). The upper edge of the burning shell then marks the edge of the “carbon-free” core which is bigger in more massive models in our simulations. Thus we find that lower mass loss rates produce bigger carbon-free cores. Correspondingly, the silicon and iron core masses increase for lower mass loss multipliers in our model sequence.
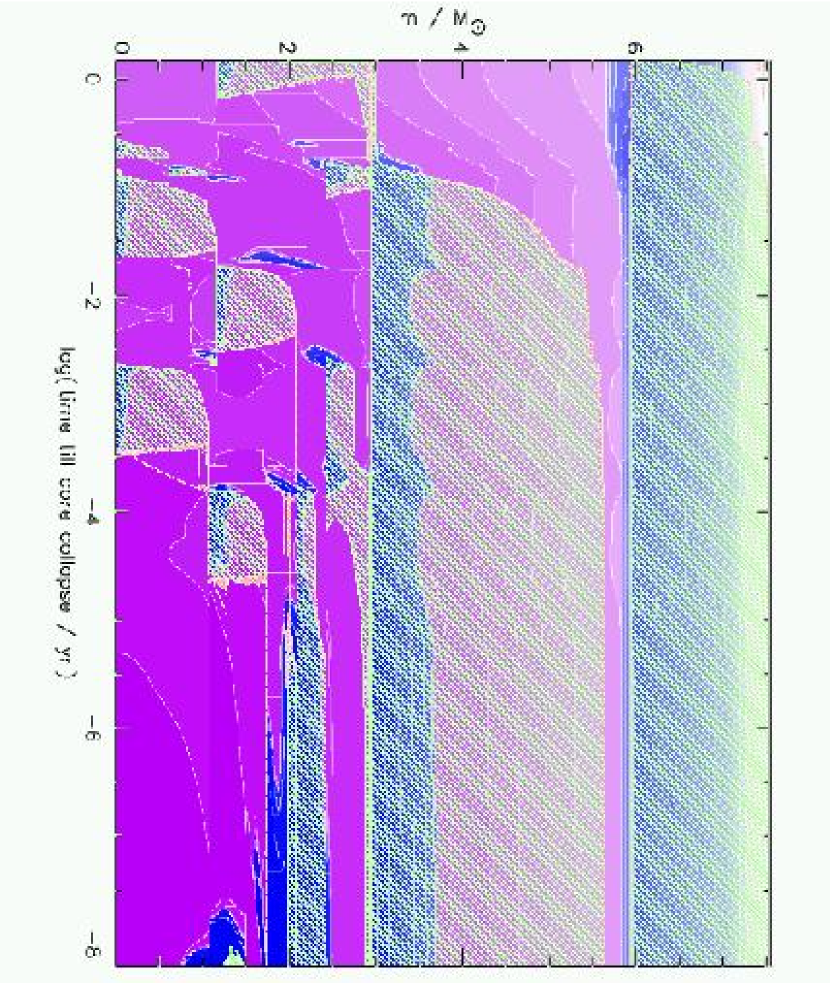
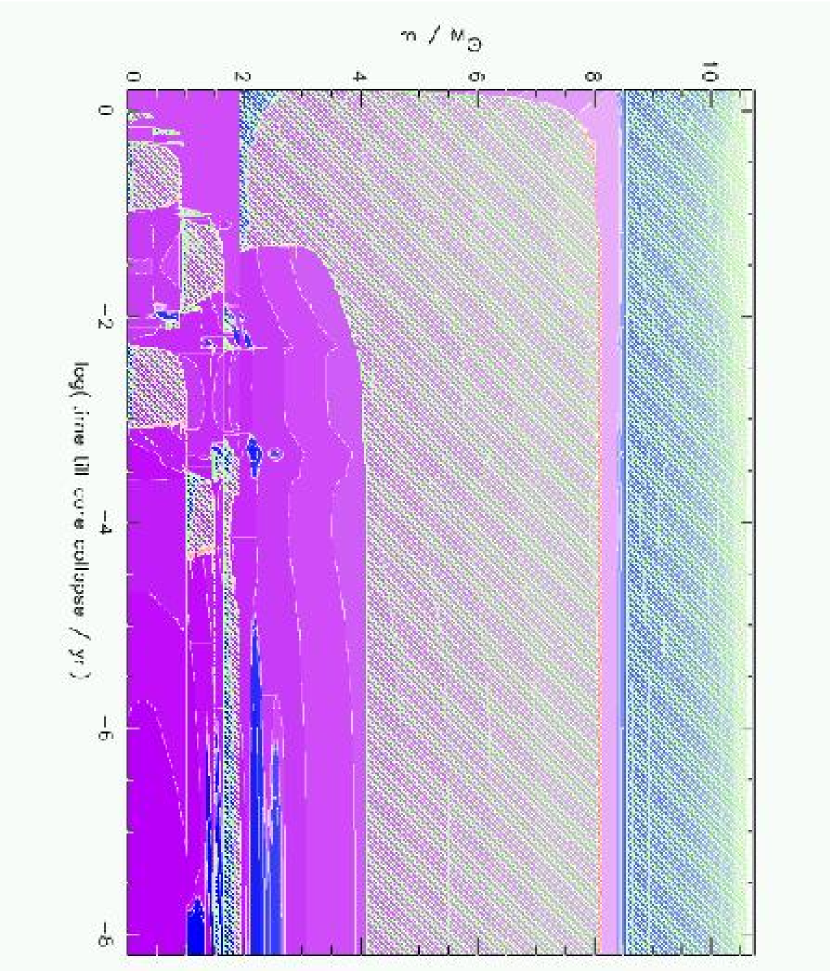
However, Model 1s6 shows that this trend is not universal (Fig. 5). In this model, even most of the neon and oxygen burning proceeds while the first carbon burning shell, which is located at only 1.9 , is still active. Hence, the carbon-free core is limited to the region below this shell until this late time. For cores of this high mass, the remaining evolution time-scale is too short for the former carbon shell to become a fully integrated part of the Ne/O core and some traces of carbon remain even until core collapse. Oxygen burning remains restricted to the region below, limiting the size of the silicon core to this mass. This is in contrast to, e.g., Model 1s4 where a much larger carbon-free core is established already before neon ignition, resulting in bigger silicon and iron cores. Therefore Model 1s6 ends up with a smaller iron core than Models 1s4 and 1s3, despite the fact that it has by far the largest total mass (Table 1).
A similar non-monotonic behaviour can occur at the transitions from two to three shells, and so forth. In our case, the reason is the change in the mass loss rate, but in general they depend on the core mass, the carbon abundance in the CO-core (Boyes 2001), and the mass and composition of the overlaying helium shell. Clearly, further studies are required to understand this phenomenon in more detail (Boyes, Heger, & Woosley 2001).
Models 1s1 and 1s2 end their lives as rather small helium cores (Table 1). Their evolution is influenced by partial electron degeneracy and results in the formation of rather small iron cores (Table 2), i.e., of the order their Chandrasekhar mass, after one phase of silicon shell burning (Figs. 2 and 3). In Models 1s3 and 1s4 (Fig. 4) the silicon shell reaches out to higher masses, resulting in bigger iron cores. This is a consequence of the larger carbon-free core established before beginning of central neon/oxygen burning. In Model 1s6, a small carbon-free core of 1.9 is maintained until very late, i.e., until the first oxygen shell burning is extinguished. (Fig. 4; note the logarithmic time axis). Only then does the carbon shell extinguish, so that only the region below this shell participates in the subsequent burning stages. This leads to a similar late time evolution and final iron core size less massive than Models 1s3 and 1s4. However, as we shall see in §3, the mass of the deleptonized core is not the only factor governing the remnant mass after collapse, and even though Model 1s6 has a less massive iron core, it produces a larger compact remnant.
There are only few calculations in the literature that allow a comparison with our study. Woosley, Langer, & Weaver (1995) modeled the evolution of helium stars using the Wolf-Rayet mass loss rates of Langer (1989). Their most massive model had an initial mass of 20 , which is similar to the initial helium core mass of our models (). Their resulting final stellar mass (3.55 ), CO core mass (2.53 ) and NeO core mass () lie between that of our Models 1s1 and 1s2, but the resulting iron core mass is bigger (1.49 ), possibly due to interactions of oxygen and silicon burning shells that lead to a peculiar behavior of our Model 1s2 (see Fig. 3).
3 Core-Collapse, Supernovae, and Compact Remnants
3.1 Numerics
We follow the core collapse of the final Wolf-Rayet star models described above using the 2-dimensional, smooth particle hydrodynamics, core-collapse supernova code originally described in Herant et al. (1994). This code follows the core collapse continuously from collapse through bounce and ultimately to explosion. The code includes a variety of neutrino rates and cross-sections to model 3 neutrino populations (, and ) and transports these neutrinos via a flux-limited diffusion algorithm. The equation of state is a patchwork of a series of codes valid over the range of densities and temperatures required in the course of the core-collapse simulation (see Herant et al. 1994 for details). In the regime of low density, the equation of state is identical to that of KEPLER. Hence, we do not encounter problems “matching” the output of KEPLER into the core-collapse code. To this code, Fryer et al. (1999) added spherically symmetric general relativity and a more sophisticated flux limiter.
In all our simulations, we model the inner of the star (for Model 1s1 we model the entire 3.1 M⊙ star) with 13,000-16,000 particles in a 180∘ hemisphere. We assume rotational symmetry about the hemisphere causing each particle to effectively represent a ring about the axis of symmetry. The advantage of this 2-dimensional, hydrodynamics code is that it allows us to model from collapse through explosion with reasonable angular resolution () without requiring us to reset the grid at any point in the simulation. In addition, we need only remove the inner 0.001 which minimizes the effects of the inner boundary.
This code has been used for a variety of core-collapse simulations (Fryer et al. 1999, Fryer 1999, Fryer & Heger 2000) which provide a basis with which to compare our models. By comparing the collapse results of the 60 cores in this paper with themselves, and with the core-collapse results of other massive progenitors (Fryer et al. 1999, Fryer 1999), we can determine trends caused by differences in the progenitors alone (and not the core-collapse code).
3.2 Core-Collapse and SN Explosions: Cause and Effect
Table 2 summarizes the results of our core-collapse simulations. Note that for decreasing Wolf-Rayet mass-loss rate, the explosion energy initially grows (Model 1s1 vs. Model 1s2). But as we continue to decrease the mass-loss rate, the explosion energy decreases down to Model 1s6 (which does not explode at all). This initial rise, and then decrease, in explosion energy mimics the trend in explosion energy of increasing progenitor mass without mass-loss (Fryer et al. 1999, Fryer 1999). The decrease in explosion energy with increasing progenitor mass fits easily into a simple picture of the neutrino-driven engine in which a convective region must overcome the ram pressure of infalling material in order to launch an explosion (see, for example, Burrows & Goshy 1993). The ram pressure at the accretion shock is given by
| (2) |
where is the accretion onto the convective region, is the gravitational constant, is the enclosed mass below the accretion shock and is the radius of the shock which caps the convective region.
More massive progenitors produce stars which have higher accretion rates onto the accretion region. Fryer (1999) found that these more massive stars could not explode until the accretion rate onto the convective region dropped significantly. Hence, more massive stars explode later. Their neutrino luminosity (and subsequent heating) at these later explosion times tend to be lower so that their explosions are weaker. Extremely low-mass progenitors (accretion induced collapse of white dwarfs, progenitors between 8-11 ) have very little infalling material, and the explosion occurs before significant neutrino-energy deposition. Hence, these low-mass progenitors also have explosion energies which are weaker than those of stars within the regime.
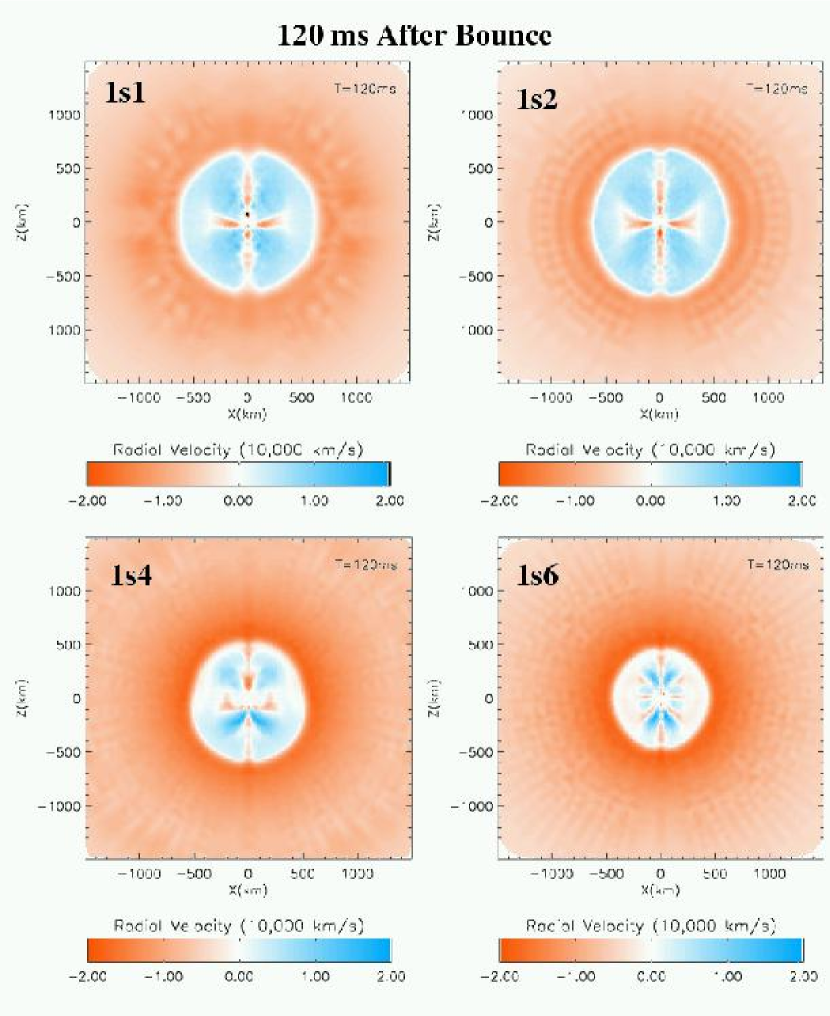
The pressure of the accreting material depends both upon the accretion rate of the infalling material and the position of the shock (which marks the boundary between the convective region and the collapsing star). For a given accretion rate, the ram pressure of the infalling material decreases as the shock progresses further out from the star (see, for example, Burrows & Goshy 1993, Janka 2000). By combining the accretion rates from our simulations (Fig. 6) with the shock radii 120 ms after bounce (Fig. 7), we can estimate the pressure that the convective region must overcome to launch an explosion. Fig. 7 shows in color coding the radial velocity of Models 1s1, 1s2, 1s4, and 1s6 at 120 ms after bounce. The position of the accretion shock can be easily be determined as the interface of low velocity (white) at the bottom of rapid inward movement (red). For Models 1s1 and 1s2, the shock is at roughly 650 km. In contrast, in Models 1s4 and 1s6 the shock is below 500 km and 400 km, respectively. Using Eq. (2), the corresponding shock pressures for Models 1s1, 1s2, 1s4, and 1s6 are 4.6, 4.5, 13.2, and 18.4 erg cm-3, respectively .
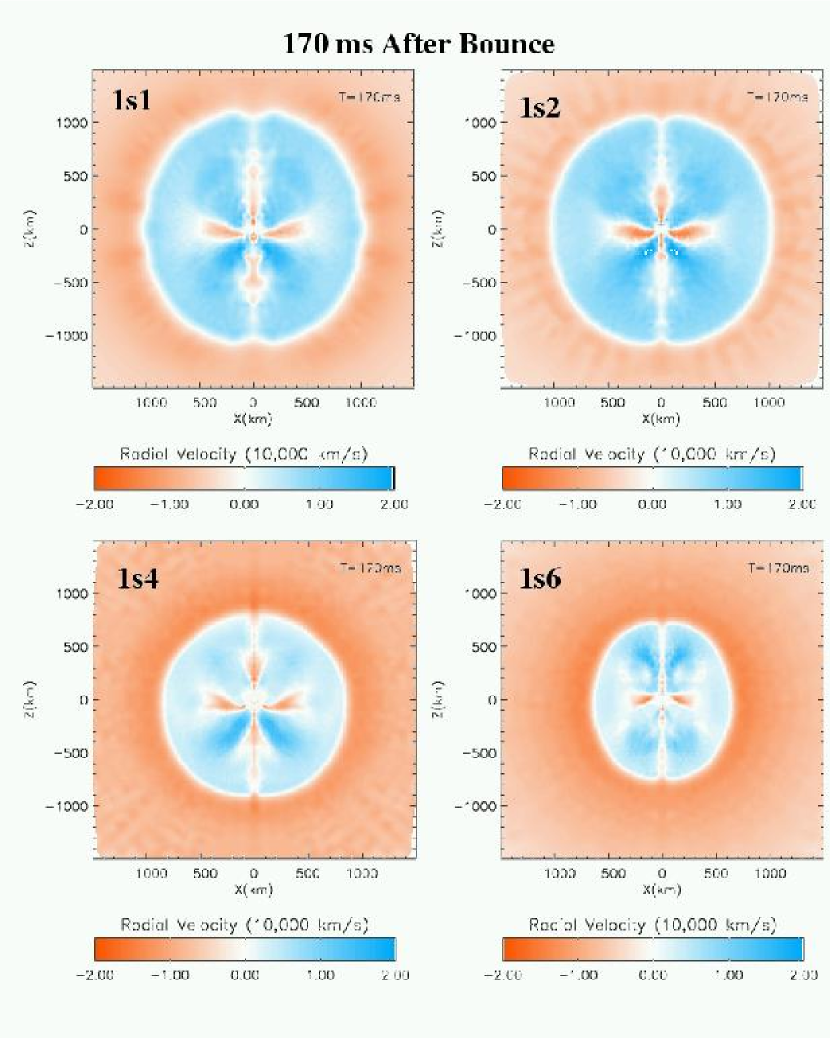
170 ms after bounce, we can already see the differences in the shock pressure manifesting themselves in the explosion evolution (Fig. 8). Models 1s1 and 1s2 have strong explosions with rapidly outward-moving shock radii at 1000 km, while Model 1s4 is exploding weakly (the shock is at 800 km), and Model 1s6 reaches its peak at 650 km. The trend of explosion energies matches the initial trend in the shock pressures just after bounce (Table 2). By calculating the pressure at the shock shortly after the shock stalls from the shock position and infall accretion rate, we can gain insight into the fate of the collapsed star (i.e., whether it will become a black hole or neutron star). The shock pressure is clearly a better diagnostic of resultant supernova explosion energy than the accretion rate alone, but, unfortunately, it can not be determined unless one models the collapse (at least through bounce) of the massive star. Fortunately, such calculations can be done in 1-dimension.
A few other characteristics of the collapse also affect the explosion. The neutrino luminosity from the proto-neutron star core determines how much energy is deposited in the convective region and, ultimately, the explosion energy (again, see Burrows & Goshy 1993, Janka 2000). In general, as the neutrino emission from the core increases, the chance that an explosion will occur also increases. Figure 9 shows the electron-neutrino luminosity for our four comparison models. Note that although the neutrino luminosities for Models 1s1, 1s2, and 1s6 are all nearly equal, Model 1s4 emits nearly twice as many electron neutrinos 100 ms after bounce. The large iron core of Model 1s4 compresses much less during collapse than the cores of the other stars, and a larger fraction of its energy is emitted via electron neutrinos instead of and neutrinos. Electron neutrinos deposit energy into the convective region much more efficiently than and and this helps to explain the fact that model 1s4 eventually explodes and Model 1s6 does not.
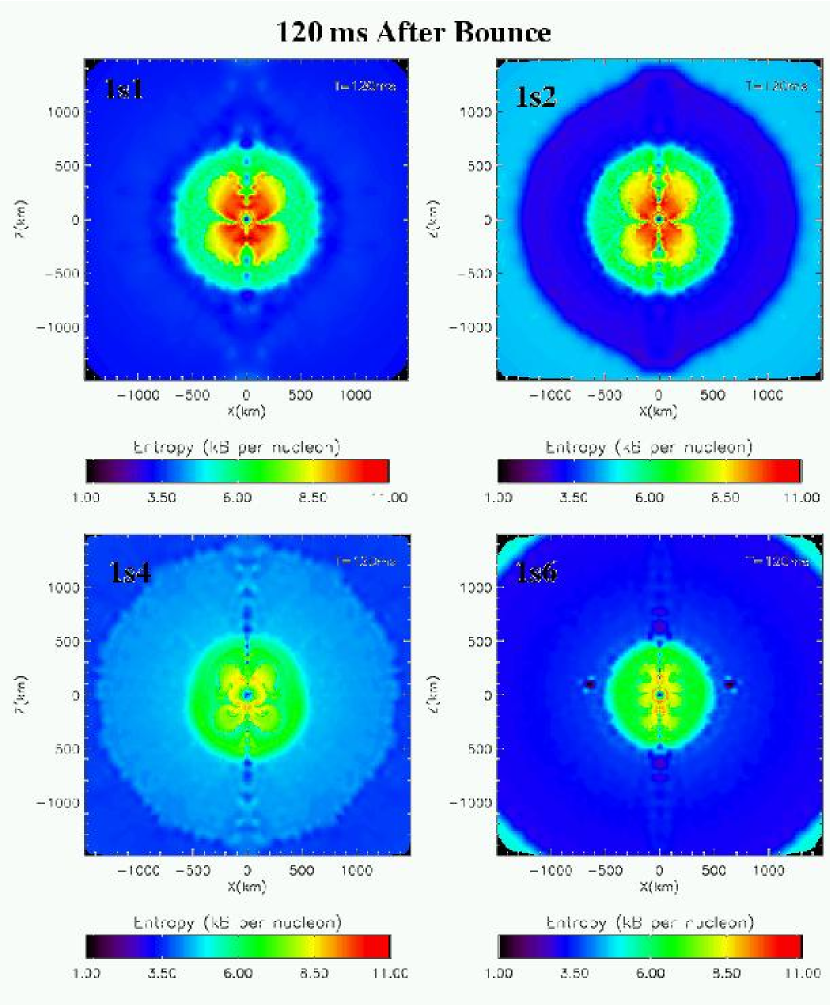
The efficiency of neutrino energy deposition can also differ slightly from model to model. The entropy profile left behind when the bounce shock stall differs from star to star (Fig. 10). It seeds convection, which enhances the efficiency of neutrino deposition. Note that the entropy profile set by the bounce shock is much higher in Models 1s1 and 1s2 than in Models 1s4 and 1s6, producing stronger initial convection.
3.3 Fallback and Remnant Masses
To calculate the remnant masses, we must follow the supernova explosion to late times ( yr), and to do this, we map our 2-dimensional results back into 1-dimension. This simplification is necessary to make the calculation computationally tractable and since the shock is roughly symmetric, this mapping can be accomplished smoothly. In addition, the outer edges of our 2-dimensional simulation do not move much over the course of the s collapse simulation and adding the rest of the star (in the models 1s3, 1s4, and 1s6) is also straightforward. Using a 1-dimensional core-collapse code (Herant et al. 1994), we can then follow the explosion to later times.
Even in 1-dimension, we must make some approximations to speed up the code. First, we remove the proto-neutron star and place an inner boundary at its surface. In addition, as material falls back onto the proto-neutron star and piles up onto its surface, we accrete this material onto the neutron star. This is achieved numerically by removing a zone when its density rises above a critical density and adding its mass to the proto-neutron star. If the critical density is too low, material can artificially accrete too rapidly onto the neutron star and the value of our critical density ( g cm-3) was chosen to avoid this artificial accretion. By running the explosion out to 1 yr after collapse, we calculate the final remnant mass (baryonic) and the final kinetic energy of the explosion (Table 2). Because of the energy required to unbind the envelope, the final kinetic energy is much less than the initial explosion energy. Depending on the modest variations in the Wolf-Rayet mass loss rate (a factor of 3), the death of a 60 star in a close binary system can produce anything from a low mass nutron star to a 10 black hole.
Figure 11 shows the mass trajectories of model 1s4, which has the most supernova fallback after an initial successful explosion (remember that Model 1s6 did not successfully launch an outward moving shock). In this simulation, it took nearly a year for all of the fallback material to ultimately accrete onto the neutron star.
4 Summary
In this paper, we present models for life and death of a series of 60 stars in binaries, whose evolution differs only by the mass loss rate adopted in the Wolf-Rayet stage. The Wolf-Rayet mass loss rate is still very uncertain and has only recently been revised downward by a factor 23 (Hamann & Koesterke 1998). In addition to being uncertain, it is likely that the Wolf-Rayet mass-loss rate depends on metallicity. Aside from the mass-loss rate, the metallicity has very little effect on the stellar evolution models. Thus, the study presented here can also be regarded as a study of this binary at different metallicities – the uncertainty of the WR mass loss rate then translates into a variation of the the initial stellar metal abundance.
We obtain final pre-collapse stellar masses in the range from 3.1 for the highest mass loss rate (Model 1s1) up to 10.7 for the lowest mass loss rate (1s6), while the central carbon abundance at core helium exhaustion drops form 35 % to 22 %, respectively. The ensuing complex interaction of carbon core and shell burning phases with later burning stages causes a non-monotonic behavior of the pre-collapse structure of the star, i.e., the masses of the neon-oxygen core, the silicon core or the deleptonized core (Table 1; Sect. 2.3).
Following the subsequent collapse and supernova explosion of these stars, we find that these models produce a range of compact remnants from a 1.17 neutron star (1s2) to a 10.7 black hole (1s6). The remnant mass does not scale strictly with the iron core mass (it depends on the density and temperature structure of the collapsing core - see §3) and we can not use this core mass to estimate the supernova explosion energy or the compact remnant mass. Amazingly, the large differences in the remnant mass are caused by only a factor of 3 change in the Wolf-Rayet mass-loss rate, and a 40% difference in the amount of mass lost through Wolf-Rayet winds. In view of this extreme sensitivity of the remnant mass on the WR mass loss, the persisting uncertainty of the WR mass loss rate, and the uncertainties of our core collapse models, it is difficult to draw solid conclusion.
Nevertheless, taking our results at face value implies that to form a black hole of 10 or more from a 60 star in a Case B (or Case A) binary, one might need to use WR mass loss rates smaller than the currently favoured ones (unless the system is at lower metallicity). That is, it seems difficult (though not impossible) to form those X-ray binaries which contain the most massive black holes, like Cyg X1 or V404 Cyg, through Case A or B at solar metallicity, and the Case C scenario (Brown et al. 1999, 2001, Kalogera 2001, Fryer & Kalogera 2001) may provide a viable alternative. For most low mass black hole binaries, which may contain black holes with 37 (Fryer & Kalogera 2001), our results imply that a Case B progenitor evolution may be sufficient if we assumed that the mass loss rate were reduced by a factor of 4. Given the uncertainties in WR mass loss, stellar evolution, and core-collapse, Case B progenitors for most black hole binaries are not excluded.
Furthermore, only with our lowest mass loss rate were we able to produce a direct collapse black hole from this Case B progenitor. Fryer, Woosley, & Hartmann (1999) suggested that most collapsar -ray burst progenitors are produced in binares that undergo Case B mass transfer, but our results imply that such binaries may not produce collapsars (at least at solar metallicity). However, most -ray bursts occur at high redshifts and low metallicities. That is, if the Wolf-Rayet mass loss rates truly decrease with decreasing metallicity, this does not preclude Case B progenitors of -ray bursts.
All in all, our results should be understood as temporary, awaiting a better understanding of the Wolf-Rayet winds and the core collapse of massive stars. But to understand the origin of the black hole binaries in our nearby universe, we must continue to pursue Case AB, as well as Case C models. We should finally mention that we left out two potentially important stellar parameter which is essential for most current models of collapsing stars: rotation and magnetic fields. Rotation may add another dimension to the expected remnant mass as function of stellar parameters, which has to be left here for future investigations. Although Fryer & Heger (2000) found that the currently proposed dynamos would not develop strong enough magnetic fields to drive the explosion alone, magnetic fields may still effect the explosion and should be considered.
References
- Arnett et al. (1989) Arnett, W.D., Bahcall, J.N., Kirsner, R.P., & Woosley, S.E. 1989, ARA&A, 27, 629
- Boyes (2001) Boyes, M. M. 2001, master thesis, University of California at Santa Cruz
- Boyes, Heger, & Woosley (2001) Boyes, M.M., Heger, A., and Woosley, S.E. 2001, in preparation
- Braun (1997) Braun, H. 1997, PhD thesis, Technische Universität München
- Brown, Lee, & Bethe (1999) Brown, G.E., Lee, C.-W., and Bethe, H.A. 1999, New Astronomy, 4, 313
- Brown et al. (2001) Brown, G.E., Heger, A., Langer, N., Lee, C.-H., Wellstein, S., and Bethe, H.A. 2001, submitted to New Astronomy
- Burrows & Goshy (1993) Burrows, A., & Goshy, J. 1993, ApJ, 416, L75
- Ergma & van den Heuvel (1998) Ergma, E., & van den Heuvel, E. P. J. 1998, A&A, 331, L29
- Fryer (1999) Fryer, C. L., 1999, ApJ, 522, 413
- Fryer et al. (1999) Fryer, C. L., Benz, W., Herant, M., Colgate, S. A., 1999, ApJ, 516, 892
- Fryer (1999) Fryer, C. L., Woosley, S.E., Hartmann, D.H. 1999, ApJ, 526, 152
- Fryer & Heger (2000) Fryer, C. L., & Heger, A. 2000, ApJ, 541, 1033
- Fryer (2001) Fryer, C.L., & Kalogera, V. 2001, ApJ, 554, 548
- Hamann & Koersterke (1998) Hamann, W.-R., Koesterke, L. 1998, A&A, 335, 1003
- Hamann, Koesterke, & Wessolowski (1995) Hamann, W.-R., Koesterke, L., Wessolowski, U. 1995, A&A, 299, 151
- Heger, Langer, & Woosley (2000) Heger, A., Langer, N., Woosley, S. E. 2000, ApJ, 528, 368
- Herant et al. (1994) Herant, M., Benz, W., Hix, W.R., Fryer, C. L., Colgate, S. A. 1994, ApJ, 435, 339
- Janka (2001) Janka, H.-Th. 2001, A&A, 368, 527
- Kalogera (2001) Kalogera, V. 2001, in Black Holes in Binaries and Galactic Nuclei, ed. L. Kaper, E. P. J. van den Heuvel, & P. A. Woudt (New York: Springer), 299
- Kippenhahn & Weigert (1990) Kippenehahn, R., & Weigert, A. 1990, Stellar Structure and Evolution, Springer-Verlag, Berlin
- Kobulnicky & Skillman (1997) Kobulnicky, H. A., & Skillman, E. D. 1997, ApJ, 489, 636
- Langer (1989) Langer, N. 1989a, A&A, 210, 93
- Langer (1989) Langer, N. 1989b, A&A, 220, 135
- Langer (1991) Langer, N. 1991a, A&A, 248, 531
- Langer (1991) Langer, N. 1991b, A&A, 252, 669
- Langer (1998) Langer, N. 1998, A&A, 329, 551
- Maeder (1992) Maeder, A. 1992, A&A, 264, 105
- Nugis & Lamers (2000) Nugis, T. & Lamers, H.J.G.L.M. 2000, A&A, 360, 227
- Oppenheimer (1939) Oppenheimer, J. R., & Snyder, H. 1939, Phys. Rev., 56, 455
- Portegies-Zwart et al. (1997) Portegies Zwart, S. F., Verbunt, F., & Ergma, E. 1997, A&A, 321, 207
- Weaver, Zimmerman, & Woosely (1978) Weaver, T. A., Zimmerman, G.B., & Woosley, S. E. 1978, ApJS, 101, 181
- Wellstein & Langer (1999) Wellstein, S., & Langer, N. 1999, A&A, 350, 148 (WL99)
- Woosley & Weaver (1995) Woosley, S. E., & Weaver, T. A. 1995, ApJS, 101, 181
- Woosley, Langer, & Weaver (1993) Woosley, S. E., Langer, N., & Weaver, T. A. 1993, ApJ , 411, 823
- Woosley, Langer, & Weaver (1995) Woosley, S. E., Langer, N., & Weaver, T. A. 1995, ApJ , 448, 315
| mod. | aaWolf-Rayet mass loss relative to Braun (1997) | bblifetime of the star in the WNL (), the WNE (), and WC+WO () phases | bblifetime of the star in the WNL (), the WNE (), and WC+WO () phases | bblifetime of the star in the WNL (), the WNE (), and WC+WO () phases | xxtotal amount of mass lost during the Wolf-Rayet stage | cccentral carbon mass fraction after central helium depletion | ddmass of the (helium) star (), the helium-free carbon-oxygen core (), the carbon-free neon-magnesium-oxygen core (), the oxygen-free silicon core (), and that of the deleptonized core (; defined by ) | ddmass of the (helium) star (), the helium-free carbon-oxygen core (), the carbon-free neon-magnesium-oxygen core (), the oxygen-free silicon core (), and that of the deleptonized core (; defined by ) | ddmass of the (helium) star (), the helium-free carbon-oxygen core (), the carbon-free neon-magnesium-oxygen core (), the oxygen-free silicon core (), and that of the deleptonized core (; defined by ) | ddmass of the (helium) star (), the helium-free carbon-oxygen core (), the carbon-free neon-magnesium-oxygen core (), the oxygen-free silicon core (), and that of the deleptonized core (; defined by ) | ddmass of the (helium) star (), the helium-free carbon-oxygen core (), the carbon-free neon-magnesium-oxygen core (), the oxygen-free silicon core (), and that of the deleptonized core (; defined by ) |
|---|---|---|---|---|---|---|---|---|---|---|---|
| () | () | () | (%) | () | () | () | () | () | |||
| 1s1 | 1/1 | 25 | 24 | 776 | 23.7 | 35 | 3.132 | 2.373 | 1.672 | 1.566 | 1.352 |
| 1s2 | 1/2 | 55 | 41 | 494 | 22.4 | 30 | 4.389 | 3.375 | 1.849 | 1.774 | 1.305 |
| 1s3 | 1/3 | 73 | 41 | 373 | 20.7 | 27 | 6.108 | 4.782 | 2.514 | 2.029 | 1.606 |
| 1s4 | 1/4 | 85 | 44 | 318 | 19.2 | 25 | 7.550 | 5.934 | 2.934 | 2.308 | 1.749 |
| 1s6 | 1/6 | 122 | 53 | 205 | 16.1 | 22 | 10.746 | 8.545 | 2.330 | 1.939 | 1.497 |
| Modelaasee Table 1 | bbMass of the iron core at collapse. | ccAmount of energy injected in the star by neutrinos. A portion of these energy will unbind the star, a portion will go into the velocity of the ejecta, and some will fall back onto the neutron star. | ddTime it takes for the shock to be pushed beyond 1000 km. | eeKinetic energy of the ejecta 1 year after explosion. | ffMass of the compact remnant after fallback. |
|---|---|---|---|---|---|
| () | (ergs) | (ms) | (ergs) | () | |
| 1s1 | 1.321 | 1.45 | 150 | 0.7 | 1.35 |
| 1s2 | 1.352 | 2.36 | 160 | 1.3 | 1.17 |
| 1s3 | 1.590 | 1.60 | 180 | 1.0 | 2.11 |
| 1s4 | 1.750 | 0.3 | 180 | 0.15 | 5.2 |
| 1s6 | 1.497 | 0 | - | 0 | 10.7 |