Probing SZ Source Detection with Gasdynamical Simulations
Abstract
The huge worldwide investment in CMB experiments should make the Sunyaev-Zeldovich (SZ) effect a key probe of the cosmic web in the near future. For the promise to be realized, substantial development of simulation and analysis tools to relate observation to theory is needed. The high nonlinearity and dissipative/feedback gas physics lead to highly non-Gaussian patterns that are much more difficult to analyze than Gaussian primary anisotropies for which the procedures are reasonably well developed. Historical forecasts for what CMB experiments might see used semi-analytic tools, including large scale map constructions, with localized and simplified pressure structures distributed on a point process of (clustered) sources. Hydro studies beyond individual cluster/supercluster systems were inadequate, but now large-volume simulations with high resolution are beginning to shift the balance. We illustrate this by applying “Gasoline” (parallelized Tree+SPH) computations to construct SZ maps and derive statistical measures. We believe rapid Monte Carlo simulations using parameterized templates centered on point processes informed by optical and other means on the observational side, and by hydro simulations on the theory side, should play an important role in pipelines to analyze the new SZ field data. We show that localized sources should dominate upcoming SZ experiments, identify sources in the maps under filtering and noise levels expected for these experiments, use the RCS photometric optical survey as an example of redshift localization, and discuss whether cosmic web patterns such as superclusters can be enhanced when such extra source information is supplied.
Canadian Institute for Theoretical Astrophysics, University of Toronto, Toronto, Ontario, M5S 3H8, Canada
Department of Astronomy and Astrophysics and CITA, University of Toronto, Toronto, Ontario, M5S 3H8, Canada
Department of Physics and Astronomy, McMaster University, Hamilton, Ontario, L8S 4M1, Canada
Department of Astronomy and Astrophysics, University of Toronto, Toronto, Ontario, M5S 3H8, Canada
1. Semi-analytic cf. Hydro Approaches to SZ Forecasts
1.1 The Resolution of Upcoming SZ Experiments: The Compton upscattering of CMB photons by hot inhomogeneous (nonlinear) gas leads to secondary CMB anisotropies in direction at frequency , where is the Compton y-parameter and depends only upon frequency.111Here, is Thompson cross section, is the electron mass, is the CMB photon temperature, and is the -line-of-sight radial distance element. is 1 in the Rayleigh-Jeans region, zero at 217 GHz, negative above. It is because is a direct probe of the line integral of the electron pressure in the hot intergalactic medium that the heavy investment in SZ experiments is so worthwhile.
SZ observations of individual rich clusters have been possible for a decade, are now routine (e.g., Carlstrom et al., 1999), and complementary to X-ray, optical and weak lensing observations. For resolved sources, the surface brightness of an SZ source is independent of its redshift. Even with the expected source evolution, this property should make the SZ effect a valuable probe of the cluster/group near/mid-field even at redshifts , when we expect the system to be in a very active merging state. Thus, the era of blank field (or ambient) SZ surveys is upon us, some targeting the resolution well-matched to the cluster/group system at , others with resolution, probing larger sky fractions, albeit with considerably enhanced source confusion. Specifications of a sample of upcoming/proposed SZ experiments are:
Bolometer-based: ACBAR: Viper telescope, 16 element, multi-frequency, fwhm resolution, now; Bolocam/CSO: 10.4m CSO telescope, 151 pixels, 150, 220, 270 GHz, , fall 2001; Bolocam on the LMT?; ACT: 3 32x32 pixel bolometer array, , proposed; Planck: at 150 GHz, at 220 GHz, full sky, 2007.
HEMT-based Interferometers: OVRO mm array: 6 dish, 10.4m, 30 GHz, now; BIMA: 10 dish, 6.1m, 30 GHz, now; CARMA: OVRO+BIMA; CBI: 13 dish, 0.9m, 30 GHz, ; SZA: 6 dish, 3.5m, 30 GHz (+90 GHz), ; AMIBA: 19 dish, 1.2m+0.3m, 90 GHz, ; AMI: 10+8 dish, 3.7m+13m, 15 GHz, . The resolution can be improved by spreading the dishes to longer baselines.
1.2 Historical Semi-analytic SZ Forecasting: SZ estimates and limits derived from them were influential ever since Sunyaev and Zeldovich proposed the effect. First, attention was paid to baryon-dominated (BDM) models, with entropy injection via shocks or radiation, then to shock-heated neutrino-dominated (HDM) models, and then the many variants of cold dark matter (CDM) models, often with strong “feedback” of energy into the pregalactic or intergalactic medium. For example, in the eighties one of us (Bond et al., 1980s) did HDM forecasts, first using the popular pancake treatment of structure formation, then a better cluster-based treatment using density peaks of various masses, including both Poisson and continuous clustering contributions of these “shots” (B88). Explosion-dominated models of structure formation in CDM, BDM models, from very massive objects, galaxies, superconducting strings, extreme preheating, etc. were also addressed in B88. All of these models became severely challenged by the COBE/FIRAS data which gave a 95% CL upper bound to the allowed fraction of the CMB radiation in a Compton cooling distortion.
Early SZ maps using cluster/group-scale peaks in CDM models were also constructed in the eighties (B90). In the nineties, the calculations of SZ maps became more sophisticated with the peak-patch technique, which included correct spatial clustering of halos, but “painted on” simple parameterized pressure-profiles within the halos (Bond et al., 1990s, Bond & Myers 1996, Bond & Crittenden 2001 [BC01]).
1.3 Hydro Approaches: Early single-cluster SPH calculations (Bond et al., 1990s) became more sophisticated as the codes and computing power improved, as described for example in the ITP “adiabatic” cluster comparison test (Frenk et al., 2000), for which SZ, X and weak lensing maps are shown in BC01. Ideas of the cosmic web interconnections of clusters of peak-patches were used to create optimally-designed rare supercluster (TreePM-SPH) simulations (Bond et al., 1998, reviewed in BC01) that included a proper tidal field acting on its 104 Mpc high resolution patch (comoving lattice spacing , best =0 resolution ) and cooling (but no feedback) to see which, if any, of the X, SZ or weak lensing probes could be sensitive to mid-field and far-field structures around clusters and groups (e.g., the far-field filamentary bridges). As expected, we found weak lensing probes the far-field better than SZ, which does better than X. However, a critical issue is how to reveal such extended-source patterns, given the projected contributions from the clusters and environs behind and ahead of the supercluster targets (Sec. 3).
In recent years, simulated SZ maps generated from hydrodynamical cosmological simulations have been used to predict what the experiments should see, mostly with emphasis on low order statistics such as the angular power spectrum. Even with the great improvements in computing power and codes we have seen, only a relatively small number of hydro realizations per SZ map-making exercise are being done, and so all such work remains statistically incorrect. Nonetheless, we believe these approximate treatments are useful steps along the path to that brave day when the full redshift range relevant to the projected maps from, say, 0 to 2, is do-able, the space tiled by contiguous simulation patches self-consistently constructed to have coherent long-waves joining them, all at the required resolution. This is routinely and rapidly done with the painted-halo peak-patch approach (Bond & Myers 1996).
2. Approximate SZ Map-Making using High Resolution Hydro
2.1 Hydro Simulations with Gasoline: We are applying the very efficient parallelized “Gasoline” code, developed by one of us (JW) in collaboration with Joachim Stadel and Tom Quinn, to a new round of huge LSS simulations targeting the SZ effect. This tree+SPH code uses the smooth particle hydrodynamics method with a pure tree-based gravity solver and has spatially-adaptive time stepping. It has been parallelized using the MPI architecture and shows excellent scalability. The results presented here are based on the analysis of a 200 Mpc high resolution simulation of a “now standard” CDM cosmology (, , , , , =0.90) using a “workhorse” level of dark matter and gas particles (lattice spacing , best resolution ). We are now analyzing a larger (400 Mpc box) CDM simulation using dark matter and gas particles (now with ), performed on a large-memory 114 (667 MHz) processor COMPAQ SC cluster at McMaster, that required about 80 GB of memory and took days of wall time to run — a “state-of-the-art” simulation for SZ studies. The run required 15 GB of memory and less than 6 days on 88 processors. The specific calculations were “adiabatic”, in the sense that only shocks could inject entropy into the medium. Other sources of entropy injection, from galaxy winds for example, are expected and generally may be highly inhomogeneous, a complication important to explore but which we ignore for this exercise.
2.2 SZ Maps with Experimental Beams and Noise: Given only one single medium-sized simulation volume whose output is densely sampled in redshift, we create a “pseudo-realization” of the cosmic structure by stacking randomly translated and rotated copies of the same periodic box, an approach taken by other authors (e.g. da Silva et al., 2000; Springel et al., 2001). The SZ maps are generated by projecting the gas pressure in each copy of the box along the line of sight and later adding all the projections. This is inadequate because objects at various times in their history are seen again and again, but one hopes that it is good enough for statistical exploration if the size of the volume is not too small. As computing power improves, the number of boxes to be brought into the mix will be larger and larger, as will the size of the individual ones.
Fig. 1 shows the effect of smoothing for beams spanning the range of the proposed SZ experiments, and also how the addition of varying levels of homogeneous noise obscure the SZ source structures. The maps were made at Rayleigh-Jeans wavelengths, so . Each experiment will have its own special -space filtering which truncates at low as well as high, but for our purposes this simple Gaussian-filtered map will do to make our points. Note the high source confusion expected for experiments with beam sizes .
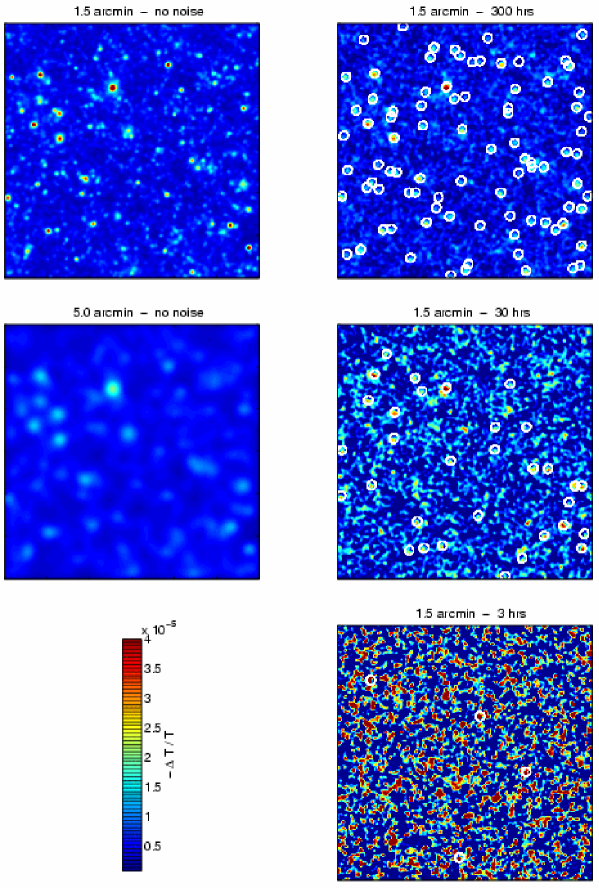
2.3 Finding SZ Sources Using SZ Maps Alone: The preliminary approach to source identification shown in Fig. 1 used an algorithm borrowed from optical astronomy developed for galaxy identification by Yee (1991), but more optimal object identification algorithms appropriate for separating the SZ signal from primary CMB signal and Galactic foregrounds as well as noise (following the “optimal” algorithms described in BC01) are needed to analyze scanned maps, both single-dish bolometer-style and interferometer-style using mosaicing/drifting.
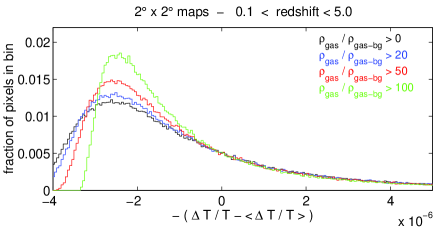
2.4 Where Does Most of the Contribution Come From? It is clear visually that most of the contribution to the noise-free SZ maps comes from concentrated sources. To address this quantitatively, we applied overdensity cuts to the gas particles in our SPH simulations that were allowed to contribute to the SZ effect, and compared the resultant maps visually and using the one-point distribution function of the pixel values of the temperature fluctuations (Fig. 2). Except for the density cut, all other aspects of the “stacking of boxes” map-making method were treated in the way outlined above to facilitate comparison. Since SZ experiments typically filter long wavelengths (some much more than others), subtracting off the means of the maps from the pixel values is a good way to compare what the effect of the cuts is. The histogram sequence with varying in Fig. 2 shows that for above convergence occurs for . Our SZ maps show that the pixels just below this convergence point, where the deviations start to appear, are contiguous to the high pixels, and define the mid-field/far-field skirt that would define the pressure profile for the extended-source model. How far one needs to go is very dependent upon the noise and filter characteristics of the various experiments that we are exploring. At lower levels, the pixels break out into the distributed filamentary gas (i.e., outside of groups.) SZ maps of thin slabs in redshift (with density cuts) are proof of this extended-object-contribution picture. Low mass groups (random superpositions) populate the interfilamentary regions in deep SZ maps, although they would be filtered out by experiments and not be discernible from the interfilamentary gas .
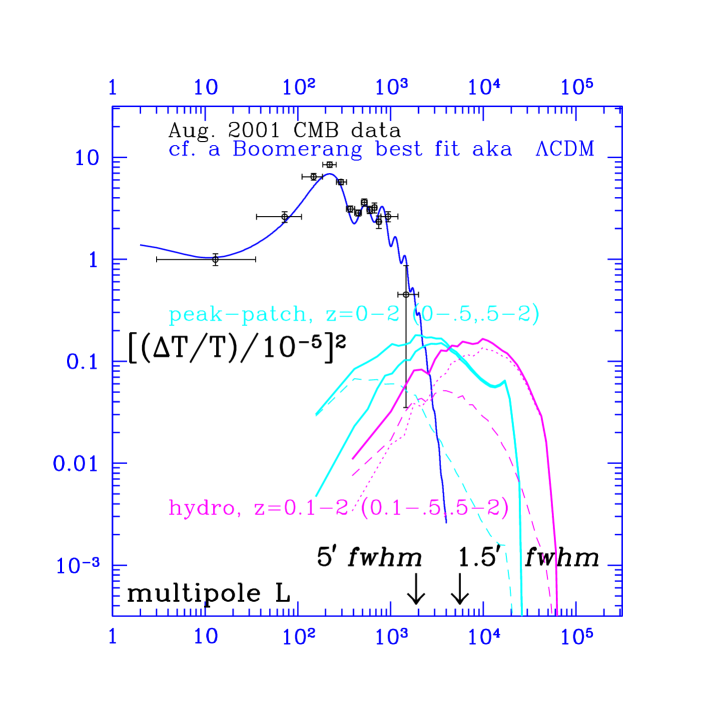
2.5 Thermal SZ Power Spectra: Fig. 3 contrasts the current CMB data on primary anisotropies with the SZ from our CDM SZ maps, both the small ones using the “stacking of boxes” and the larger scale ones using peak-patches (BC01). Even though power is concentrated in sources, the spectrum derived from our SZ maps does show the angular scales we would most like to probe. In Fig. 3 we can see that at Planck resolution, , sources are the most prominant contributors, but at the - scale of ground-based bolometer arrays and interferometers, the cluster system dominates. At high , the fate of gas in small clusters and groups is an ongoing uncertainty, reflected in the location of the peak and the behaviour beyond. The overall magnitude is quite sensitive to cosmological parameters, in particular and its evolution.
3. Simulating Source Localization and Removal in SZ Maps
3.1 The Needle in a Haystack Problem: To address whether physically-connected supercluster concentrations can be identified in the pressure-projected SZ maps, we generated individual SZ maps for the largest superclusters found at intermediate redshifts in the simulated box (e.g., the largest at =0.82), and superimposed them on top of our pseudo-realization SZ maps. We found that the strong, highly concentrated, sources still stand out, but not the filamentary structures: in fact, many apparent filamentary sources that do stand out are actually due to random superposition.
3.2 Templates from non-CMB Surveys to Localize in Redshift: As well as “cleaning” future SZ maps of other CMB signals and noise, we hope it will be possible to remove the contribution from foreground and background concentrated SZ sources to allow access to structures in a target redshift range. This will not be possible without adding extra information, e.g., from deep surveys in the optical, X-ray and weak-lensing. The mass, redshift, size, orientation and other information on optically-detected clusters can be used, e.g., to place parameterized intra-cluster gas profiles at their locations. Although this would only allow a (rather dirty) form of cleaning to enhance SZ structures, in conjunction with Monte Carlo error estimations (and follow-up observations), with appropriate algorithm development it would be a dramatic improvement over what can be done with field SZ maps alone.
We are studying the viability of this approach by coupling our simulated SZ maps to the cluster detection characteristics of the very successful 100 deg2 (22 patches X 5 deg2) optical photometric “Red-Sequence Cluster Survey” just completed by Yee and Gladders (2001). Proposed optical surveys such as RCS2 or VISTA, covering 1 and 2 orders of magnitude larger areas, are planned for the next five years.
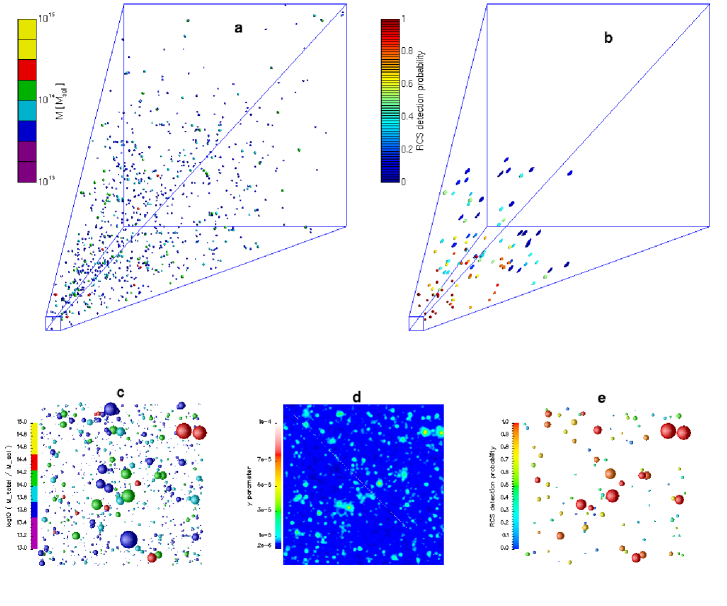
When a pseudo-realization (pyramid) of the cosmic structure is generated by stacking copies of the simulation box, we not only create the corresponding simulated SZ maps, but also generate a catalogue of the clusters/groups in the realization by properly translating, rotating, etc. the halos identified in the box with a group-finder at each redshift. Fig. 4 shows how the clusters in one such pseudo-realization are related to the corresponding SZ map and a visualization of the detectability and localization of the clusters if we had a photometric survey with the RCS characteristics.
3.3 SZ Maps Using Cluster Catalogues: Since the dominant contribution to SZ maps is due to concentrated sources, as shown above, one can also create fast Monte Carlo simulations by using catalogues of halos identified in very large volume (but low resolution) N-body only simulations or generated by the “peak-patch” technique (Bond & Myers 1996). The intracluster gas is modeled by “painting” simple parameterized profiles on the halos, though with the improvement in progress of using (variously averaged) pressure profiles of the clusters identified in our high resolution boxes. These approaches offer the advantage of allowing a much faster generation of cosmological realizations of the structures most relevant for the study of the SZ effect. Moreover, rare events in the cosmic structure, missing in periodic box hydro simulations, are now accurately included because coherent box-to-box long waves are. The drawback is, of course, that much hinges on profile choice.
3.4 Summary and Future Explorations: We described here our use of high resolution hydro simulations to develop the “extended source” model of the highly non-Gaussian SZ distribution. We plan to generate more and higher resolution hydro simulations with entropy feedback and cooling included to refine our SZ predictions. For the adiabatic calculations shown here, we have demonstrated that, although gas distributed in filaments and membranes in the IGM have non-negligible SZ signals, the observable range for planned experiments is dominated by the “extended-source” picture. We also addressed the issue of source identification in SZ maps of the size, resolution and noise level that mimic planned observing campaigns, and explored how optical photometric surveys such as the “Red-Sequence Cluster Survey” can be used to help to find SZ sources and localize them in redshift. This could allow us to identify supercluster structures, i.e., to deproject SZ maps. Indeed, given that large area optical surveys will be available, an argument can be made for catalogue-targeted rather than blank-field SZ observations. We expect both strategies will be used.
To understand the complex residual maps after unwanted extended-source removals, a large number of fast Monte Carlos will be essential, precluding a hydro-only approach with current computational power. The extended-source approach applying constrained mean pressure-profiles to halos identified in ultra-large low-resolution N-body simulations or by the peak-patch technique, calibrated with the high resolution hydro results, is a worthwhile path to further explore. The snapshot of the work described here mostly shows that there is much to develop in SZ numerical simulations and in analysis tools to directly confront the exciting new SZ datasets coming down the pipe.
References
Bond, J.R. et al., 1980s: Szalay, Bond & Silk 1983, NATO ASI Series C 117, 8, 3rd Rencontre de Moriond; Bond 1988, in The Early Universe, Proc. 1986 NATO School, Reidel [B88]; Bond 1990, in The Cosmic Microwave Background: 25 Years Later, Proc. 1989 L’Aquila Conf., Kluwer [B90]
Bond, J.R. et al., 1990s: Bond & Myers 1991, in Primordial Nucleosynthesis and the Early Universe, Proc. 1990 IUPAP Conference, ed. K. Sato, Kluwer; Bond & Myers 1994, in Clusters of Galaxies, Proc. XXIXth Rencontre de Moriond; Bond 1996, in Cosmology and Large Scale Structure, 1993 Les Houches Session LX, Elsevier, 469 [B96]
Bond, J.R. & Myers, S.T. 1996, ApJS, 103, 1-39; 41-62; 63-79 [BM96]
Bond, J.R., Kofman, L., Pogosyan, D. & Wadsley, J. 1998, astro-ph/9810093; Pogosyan et al., 1998, astro-ph/9810072
Bond, J.R. & Crittenden, R.G. 2001, in Structure Formation in the Universe, Proc. Nato ASI, p. 241, Kluwer, astro-ph/0108204 [BC01]
Carlstrom, J.E., Joy, M.K, Grego, L., Holder, G.P., Holzapfel, W.L., Mohr, J.J., Patel, S. & Reese, E.D. 1999, astro-ph/9905255
da Silva, A.C., Barbosa, D., Liddle, A., & Thomas, P. 2000, MNRAS, 317, 37
Frenk, C.S. et al., 2000, ApJ, 525, 554
Springel, V., White, M. & Hernquist, L., 2001, astro-ph/0008133
Yee, H.K.C. 1991, PASP, 103, 396
Yee, H.K.C. & Gladders, M.D. 2001, TAW8 proceedings, ASP; Gladders & Yee 2000, AJ, 120, 2148