The Interstellar Medium of our Galaxy
1 Introductory Comments
Over the past century our picture of diffuse material in space has grown from a simple model of isolated clouds in thermal equilibrium with stellar radiation fields to one of a richly varied composite of materials with a wide range of physical properties and morphologies. The solar system interacts with a dynamical interstellar medium. Optical, radio, and UV astronomy allow us to study the clouds which form the galactic environment of the Sun. The composition and distribution of interstellar clouds in the disk and halo tell us about the history of elemental formation in our galaxy, and the past and future environment of the solar system.
Dark lanes of dusty clouds obscuring portions of the Milky Way are celestial landmarks, but the realization that interstellar gas pervades space is quite recent. The 20th century opened with the discovery of a ‘nebulous mass’ of interstellar gas in the sightline towards the binary star Orionis Hartmann (1904). A series of over 40 spectra showed that the Ca II K line (3933 Å) absorption line was nearly stationary in wavelength, ‘extraordinarily weak’, and ‘almost perfectly sharp’, in contrast to broader variable stellar absorption features. Sharp stationary Na I D1 and D2 lines (5890, 5896 Å) were discovered in Ori and Sco by Mary Lea Heger. An explanation offered was that a stationary absorbing cloud of vapor was present in space between these binary systems and the observer. The Ca II and Na I lines constituted the primary tracer for interstellar gas during the first half of the century.
Interstellar matter (excluding dark matter) provides about 30–40% of the Galactic mass density in the solar neighborhood. Trace elements heavier than He, which form the planets, record the chemical evolution of matter in our Galaxy, and provide detailed information on physical conditions in interstellar clouds, represent a small proportion of the interstellar atoms (0.15%). These same elements trace the metallicity of interstellar gas, and by inference the mineralogy of interstellar grains. A primary goal of interstellar matter (ISM) studies has been to determine the chemical composition of interstellar clouds compared to, for instance, normal Population I stars such as the Sun. Space observations are required to observe most astronomically interesting elements such as C, N, O, Fe, Mg, Si since the resonant ground state transitions of these atoms fall in the ultraviolet (UV, 912–3000 Å).
Eugene Parker once asked me ‘What is an interstellar cloud?’ The Rashomon-like answer depends on the context. Early optical data showing velocity components in interstellar absorption lines led to a definition of ’clouds’ as discrete kinematical units. Alternate descriptions were based on the physical properties of the clouds, e. g. warm diffuse intercloud material in equilibrium Stromgren (1948), Field et al. (1969), or hot tenuous coronal gas Spitzer (1956) to confine the clouds. Ground and space data now show interstellar material with densities in the range 10-4 atoms cm-3 to over 103 atoms cm-3, temperatures 20 K 106 K, and many levels of ionization. Within 10 pc of the Sun, we see density contrasts of over 400 and temperature contrasts over 100. The distinction between turbulence and ‘clouds’ has been blurred by recent high spectral resolution data showing that low resolution spectral data may miss over half of the velocity components in a sightline (Section 4.2), and that 15% of the mass of cold clouds is contained in tiny (AU–sized) structures (Section 4.1). Are these features ‘clouds’, or manifestations of a turbulent ISM? The discovery of interstellar clouds in the Galactic halo Münch (1957) added new questions about the stratification of ISM in the gravitational potential of the Milky Way Galaxy, and the origin of halo gas.
Surprisingly, interstellar gas constitutes about 98% of the diffuse material inside of the heliosphere, and subparsec spatial variations in interstellar cloud properties near the Sun indicate the solar environment could change on time scales 104 years. Shapley’s conjecture in 1921 that interstellar clouds affect planetary climates no longer seems outlandish.
Symbols used here are (column densities, cm-2), and (total volume density for all forms of H, cm-3). Early optical and 21 cm radio data were insensitive to clouds with column densities (H)1019 cm-2. UV observations of trace elements can detect kinematical objects with (H)1016 cm-2. Galactic longitudes and latitudes are quoted in System II. 111System II was adopted by the International Astronomical Union in 1958 in order to correct earlier errors in the location of the Galactic center. Galactic coordinates published before 1958 are incorrect. The Local Standard of Rest velocity frame represents heliocentric velocities transformed to the rest frame corresponding to the mean motion of comparison stars near the Sun, where the comparison set is selected according to some criterion. 222Many of the LSR interstellar velocities presented in the 20th century assumed, frequently without explanation, a ‘standard’ solar motion corresponding to a velocity of 19.7 km s-1 towards the apex position =57o, =+22o. Recent Hipparcos results give a solar motion of 13.4 km s-1 towards the apex direction =28o, =+32o. Radio data are usually presented in the LSR velocity frame, where this issue is particularly troublesome.
This review focuses on the diffuse gas in the space between the stars of our Galaxy. For an eloquent summary of the physical properties of the ISM and data up to the mid 1970s, see Spitzer’s book ‘Physical Processes in the Interstellar Medium’ Spitzer (1978).
2 Discovering Interstellar Gas
The observational and theoretical foundations of ISM space studies were formed in the first half of the 20th century. In 1926 Sir Arthur Eddington laid out the principles of the ionization equilibrium of atoms in space under the influence of dilute stellar radiation fields (the ‘Bakerian Lecture’, Eddington 1926). He evaluated the importance of the short wavelength stellar radiation field (800 Å) for cloud heating (although extreme ultraviolet radiation from space was not observable in 1926), and concluded that diffuse clouds are illuminated by a radiation field at a Planck temperature of 10,000 K and have kinetic temperatures 10,000 K. He found frequent collisions would establish Maxwellian velocity distributions for electrons and ions in space. Eddington concluded that the material creating the stationary Ca II and Na I absorption lines is uniformly distributed, and argued that stellar dynamics implied 10 cm-3 for diffuse material. He determined that in space most interstellar Ca is Ca III and most Na is Na II He ‘reluctantly’ concluded that dark nebulae derive their obscuration from ‘fine solid grains’. Eddington noted that radiation with energies greater than 13.6 eV (the ionization potential of hydrogen) would be prevented from entering clouds by abundant hydrogen, and concluded interstellar H2 would be abundant.
In the early part of the century, Harlow Shapley advanced the idea that interstellar clouds were linked to terrestrial climate shifts. He noted that the diffuse luminous and dark nebulae are found throughout space, and that the Sun was receding from the Orion region where dark nebulae are prominent Shapley (1921). Shapley suggested that a past climate-altering encounter between the Orion molecular clouds and the solar system would yield a 20% variation in solar radiation, which if sustained for a period of time, would alter Earth’s climate. While encounters with dense clouds as envisioned by Shapley are statistically improbable, encounters with clouds of modest density (10 cm-3) are much more likely and would destabilize the heliosphere and modify the interplanetary environment Zank & Frisch (1999).
2.1 Optical Absorption Lines
The interstellar nature of the sharp stationary absorption features seen in binary systems was quickly established. Plaskett and Pearce (1930) provided a convincing discussion that the sharp Ca II and Na lines are formed in diffuse space, and labeled these features ‘interstellar’. Observations of 1700 stars with 10.5 mag by Otto Struve had shown that K line strengths in general increase with increasing magnitude (and thus distance), suggesting an interstellar origin. Plaskett and Pearce measured Ca II K line velocities for 250 OB stars, (to within 1.8 km s-1), and found they are ‘almost exactly twice’ the interstellar Ca II velocities expected for the galactic rotation of interstellar clouds located at half the distance of the background star. Peculiar motions within the clouds were found to be equally important for line broadening (Beals 1936).
During the late 1930’s, Merrill and collaborators surveyed the yellow Na I D1, D2 and blue Ca II H, K lines in over 400 hot bright stars. The D2/D1 line ratios were seen to increase as total line intensity decreased, providing an early indication of line saturation. The formula relating absorption line equivalent width () and column density () was found to be faulty for ‘deep’ lines, leading to the development of an empirical ‘curve of growth’ (COG) using the doublet ratio (Ca II H/K, Na I D1/D2) to constrain the functional dependence of . The COG, formalized later by Stromgren (Section 2.3), has been used to derive column densities from the equivalent widths of interstellar absorption lines for 70 years. Cloud motions were shown to depend on star distance, with velocity-longitude plots showing a double sine pattern with an amplitude at half the expected Galactic rotation value (e.g., see review of Münch 1968). The bulk motions implied by line velocities showed a chaotic or turbulent component, with dispersion =5–10 km s-1, which was interpreted as moving ‘clouds’ or ‘currents’. The Na I line strengths increased with both distance and the amount of interstellar ‘smoke’ (now known as dust) in the sightline (where the dust was determined by the reddening of starlight).
The chemical composition of interstellar clouds was explored by a series of observations at Mt. Wilson, Lick, and the Dominion Astrophysical Observatories. Sharp interstellar absorption lines from Na I (3302, 3303, 5896, 5890), Ca I (4227), Fe I (3720, 3860), Ti II (3384, 3242, 3229, 3073), K I (7665, 7699), CH II (3958, 4233), CH I (4300, 3890), CN I (3876, 3874) were discovered, and upper limits were placed on Al I (3944), Sr II (4078, 4216), Ba II (4554, 4934) lines (e.g., see review of Münch 1968). The sightlines towards 2 Ori and 55 Cyg were shown to be excellent for identifying new interstellar lines Dunham (1939). Dunham used the weak 3302 Å and strong D1, D2 Na I doublets to construct an empirical COG for the ISM towards 2 Ori, avoiding saturation problems with the D lines. Ionization equilibrium calculated for (Ca I)/(Ca II) provided the interstellar electron density, 0.7–1.4 cm-3. The anomalous properties of interstellar Ca II lines were apparent in early data. These observations yielded (Ca II)/(Na I)1.5, which was the value expected from stellar atmosphere data at that time.
The peculiar behavior of interstellar Ca seen in these early data was a harbinger of the fundamentally different properties of volatiles and refractory elements in the ISM; however, an incomplete understanding of cloud ionization prevented this recognition. When Olin Wilson showed convincingly that Ca II has a velocity distribution which is peculiar in comparison to Na I, he described the results as ‘unexpected…and disappointing’. The average internal velocity distribution for Ca II was about three times larger than for Na I (22 km s-1 versus 7.5 km s-1, Wilson 1939). Although later high-resolution spectroscopy showed that the ‘lines’ observed by Wilson were blends of several components (Section 4.2), the velocity distribution of Ca II was still peculiar. Merrill and Wilson showed that the ratio (Na I)/(Ca II) varied strongly from one cloud to another, with values 0.3–10 (e.g., see review of Münch 1968).
Walter S. Adams published an influential survey of the strengths and velocities of Ca II H,K, lines and weak features from CN I, CH I, CH II, Fe I, and Ca I lines in 300 disk (500 pc) OB stars visible from the northern hemisphere Adams (1949). The higher resolution of these data (6 km s-1), compared to earlier photographic data, demonstrated that interstellar gas is concentrated in clouds with velocity separations larger than the atomic velocity dispersion within individual clouds. The velocities in this survey provided a consistent survey of cloud kinematics. Adams estimated the relative strengths of the Ca II lines by visually estimating line strengths, which was a common practice then; the weakest features he detected correspond to equivalent widths of 3 mÅ. Half of the stars in the sample were found to have complex H or K lines, while about six stars showed weak Ca II absorption at 4226 Å. About 25% of the stars had weak blue/near-UV features from CN I, CH I, CH II, Ca I, or Fe I. Adams found 21 Ca II line components with 30 km s-1, 333The velocities quoted in Adams, 1949, should be updated with modern wavelengths. and concluded the velocities represented peculiar cloud motions through the local standard of rest (LSR).
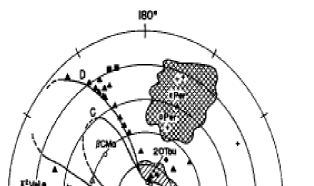
Blaauw used Adams’ data to determine the form of the velocity distribution of the chaotic component of interstellar cloud velocities (e.g. see review by Spitzer 1968). He compared Ca II component velocities with two possible distributions – a Gaussian and an exponential distribution of component velocities. Blaauw concluded that an exponential form fit the observed velocity distributions better than a Gaussian form. Munch extended this analysis to halo stars, with observations of Ca II and/or Na I towards 112 stars in the Northern Hemisphere sky (l=50o–160o, =1–2 kpc Münch 1957). He confirmed earlier studies showing that bulk cloud motions indicate clouds are aligned with the Orion and Perseus spiral arms, and found blue-shifted absorption components from expanding interstellar gas around O-star associations. Based on the Blaauw results and reasoning that turbulence is not Gaussian so that the increased energy dissipation by supersonic turbulence would flatten a cloud velocity distribution in comparison to a Gaussian, Munch fit the observed disk and halo cloud velocities with the form: ()= (where is the mean radial velocity, found to be 51 km/s by Blaauw). With the exponential distribution, a constant value for the velocity dispersion for all Na I D2 line strengths is obtained (4.6 km s-1), providing a better fit to velocity distributions than a Gaussian form. This has created what I view as a conundrum, since the internal velocity distributions of cold clouds are Gaussian, while the bulk cloud velocities measured at higher resolution show an exponential distribution.
A study of the abundance variations between individual clouds was presented in a classic paper by Routly and Spitzer, in 1952, which confirmed earlier earlier indications that the distribution of Ca II cloud velocities is intrinsically larger than the distribution of Na I velocities. They found both that (Ca II)1.5 (Na I) and that Ca II component velocities are larger than for Na I. The systematic decrease of (Na I)/(Ca II) with increasing cloud velocity is known as the ‘Routly-Spitzer effect’ (RS), manifested as (Na I)/(Ca II)1. RS proposed that the process accelerating Ca II also decreased (Na I)/(Ca II), either through collisional ionization of Na I during acceleration, or from relative differences between Ca and Na depletions onto dust grains in low versus high velocity clouds. The first discovery of ISM within 20 pc of the Sun was possible because of the Routly-Spitzer effect. Ca II, but not Na I, was detected towards Oph (14 pc) Munch & Unsold (1962). Recent data give (Na I)/(Ca II)0.1 in the –8 km s-1 cloud towards Oph Welty et al. (1996). Small scale ( 1o) variations in Ca II line strengths suggested the presence of small clouds (1 pc). These data provided the first evidence of small-scale structure and shocked ISM close to the Sun.
As frequently happens, new techniques proven in first-generation instruments provide limited data, but change the course of science. The first high spectral resolution (R200,000) observations of optical absorption lines did not achieve the initial goal of observing the Na I D line hyperfine components (separated by 1.0 km s-1), but instead demonstrated cloud velocity structure that is unresolved in photographic plates. High-spectral resolution (R=3–5105) spectrometers were developed to observe the hyperfine Na I lines towards Cyg using the long focal length McNath solar telescope Livingston & Lynds (1964), and using a Pepsios spectrometer at Lick Observatory Hobbs (1965). Much later, after the launch of the satellite and after high-resolution optical data were routinely acquired by Hobbs and others (Section 4.2), the Na I D-line hyperfine splitting was discovered towards Cygnus, using a Michelson interferometer (effective resolution 500,000, Wayte et al. 1978). Turbulence in cold interstellar clouds was found to be subsonic. The +1 km s-1 cloud has =0.38 km s-1 and a likely temperature of 70–124 K, indicating turbulent velocities =0.26–0.3 km s-1 in comparison to the isothermal sound speed of 0.8 km s-1.
A thorough and now classic study of the ISM in front of Oph (HD 149757) was performed by George Herbig, using the Lick Observatory 120” Coudé feed spectra with photographic plates Herbig (1968). The star Oph has a relatively featureless bright continuum (O9.5Vn, V=2.6 mag, 140 pc, =380 km s-1), and a rich interstellar spectrum (0.32 mag) lending itself to searches for new interstellar species. It is a runaway star from the Scorpius-Centaurus association moving supersonically through the ISM (space velocity 40 km s-1), and with a circumstellar H II region (5o radius). Oph also has a ram-pressure confined stellar wind observed around the star through 60 m radiation from heated, swept-up interstellar grains. Herbig measured absorption lines from Na I, Ca II, K I, Ti II, Fe I, CH I, CH II, and CN I, and set limits on some 25 additional species at the =1–2 mÅ level. The ISM is contained in two dominant clouds at –15 km s-1 and –29 km s-1 (heliocentric velocities). An empirical curve of growth for the main component (heliocentric velocity, =–15 km s-1) gave =2.4 km s-1 and the column densities for these elements. The photoionization equilibrium of Na I, which equilibrates photoionization with the temperature-dependent recombination rate of Na+ and an electron ((Na II)/(Na I)(Na II)/(Na I), Section 2.3) gave =0.36–0.54 cm-3 if the –15 km s-1 cloud is 50 pc from Oph. If photoionization of heavy elements (e.g. C) supplies electrons, densities =500–900 cm-3 result, indicating the cloud is a thin sheet of thickness 0.15 pc. Later studies show Na is depleted by factors 4–5, raising densities and reducing cloud thickness by the same factor. Enhanced abundances of Ca II and Ti II in the –29 km s-1 cloud identify this material as ‘intercloud’, which Herbig suggested is local (since it is seen in front of many Scorpius stars).

Lewis Hobbs initiated the high-resolution era of optical spectroscopy with a survey of the Na I D lines at resolution 1 km s-1 using a Pepsios interferometer at Lick Observatory Hobbs (1969). Turbulence was found to dominate observed line widths, since cloud temperatures of 100 K yielded 0.3 km s-1, versus observed Doppler widths of 1.5 km s-1. The photoionization balance of Na applied to (Na I)/(H I yielded typical electron densities 0.008 cm-3 for solar abundances, or 20 cm-3 if electrons are supplied by the photoionization of metals. High resolution optical data acquired by Hobbs, his students, and others proved to be a crucial supplement to UV data (Section 4.2).
2.2 Radio Astronomy – The First Multispectral Data
Radio waves provided the first multispectral window on the ISM. In 1932 Karl Jansky discovered Galactic radio emission while searching for radio static sources in a Bell Labs 15 meter radio antenna. Jansky recognized the interstellar origin of the hiss. Jansky’s papers inspired Grote Reber, who, working with a private radio telescope located in his backyard in Wheaton Illinois in 1938, detected cosmic static at 2 meters and confirmed Jansky’s discovery. Over the next several years, Reber used his backyard telescope to map the northern hemisphere radio sky at 160 MHz and 480 MHz. The advent of World War II moved radio astronomy to the forefront of technical interest, both in the US and Europe, and during the following decade technical advances from the wartime use of radar supported the development of the new radio sciences. Shklovsky (1960) reviews the scientific basis for the developing field of radio astronomy.
The spectral index of the cosmic ‘radio static’ was measured and found to increase towards lower energies, in contrast to the expected increase towards higher energies predicted for a blackbody (or ’thermal’) source. This puzzle was explained when V. L. Ginzburg calculated the emission from relativistic electrons (1GeV–1 TeV) interacting with interstellar magnetic fields in the halo and disk, terming the radiation ’magnetobremsstrahlung’ in analogy to thermal bremsstrahlung from free-free emission (by free electrons in space plasmas, e.g. Spitzer 1978). Magnetobremsstrahlung is now generally known as synchrotron radiation. In 1952 Shklovsky suggested that a tenuous gaseous envelope must surround the Galaxy in order to explain the geometry of high-latitude low frequency non-thermal radio continuum emission. Baldwin concluded that high-latitude long wavelength (3.7 m) emission originated in a Galactic halo extending at least 10 kpc from the plane Baldwin (1955). Interstellar gas in the halo was considered the carrier for magnetic field which confine halo cosmic rays Shklovsky (1960). At low frequencies non-thermal synchrotron emission dominates over the optically thick thermal emission and the ratio of non-thermal to thermal radio emission is ( is the brightness temperature).
During World War II Dutch astronomers deduced the usefulness of radio emission in probing optically obscured distant portions of the Galaxy, and predicted that the hyperfine transition of the H I ground state would be a useful tracer of H I in interstellar clouds (e.g., van de Hulst 1998). The hyperfine levels are statistically populated, /(/)exp(–) ( and are the statistical weights of the two levels, is the ‘spin temperature’). Although a single spontaneous 21 cm hyperfine transition is improbable (2.85x10⁻¹⁵ s-1), this transition is astronomically useful since 25% of the mass density in the solar neighborhood is H I. Van de Hulst also recognized the possibility of stimulated emission in the 21 cm line through radiative pumping (see, e.g., Field 1958).
The discovery of the radio H I 21 cm emission in 1951 at Harvard, in the Netherlands, and in Sydney, provided a new window on the universe and made it possible to map interstellar gas and the spiral arm structure of the Milky Way Galaxy. Interstellar H I was found to be strongly concentrated in the Galactic plane and spiral arms, with emission peaks corresponding to spiral arm velocities. During the 1950s and 1960s, single-beam surveys of H I 21 cm emission at high and low Galactic latitudes investigated fundamental cloud properties for clouds with log18.7 cm-2. H I 21 cm emission was used to reconstruct the basic spiral structure and kinematical rotation curves of our Galaxy (e.g., review of Burton 1976). The cloud-intercloud nature of the ISM was determined by observations of 21 cm absorption by isolated clouds in front of bright background radio continuum sources such as the Crab Nebula and Cassiopeia A Hagen et al. (1955). In the direction of Cassiopeia A, 1 kpc away in the Perseus arm, comparisons of on-source versus off-source data showed three strong absorbing components corresponding to clouds in the Orion (velocity dispersion 1.6 km s-1) and Perseus (velocity dispersion 2.5 km s-1) arms. The first H I shell-like structure in space was discovered in 1958 by Menon, who observed a shell expanding at 10 km s-1 in Orion, centered near the expansion center of the runaway stars AE Aurigae, Columbae, and 53 Arietis, and with an age consistent with the formation of these runaways Menon (1958).
Cold absorbing clouds (T80 K) were found to be common in the Galactic plane (20o), and broad ‘intercloud’ emission was seen with no associated absorption, indicating the presence of both warm and cold gas (e.g., Hoyle & Ellis 1963, Clark 1965). The median internal velocity dispersion of 2.0 km s-1 is found for cold absorbing clouds towards 12 sources, versus 10,000 K for warm emission clouds. About four absorbing clouds per kiloparsec are found, while 7 clouds/kiloparsec are found when interarm regions are excluded. The high-latitude clouds seen optically at high ( is the distance to the galactic plane) by Munch and Zirin were not detected in 21 cm absorption, which was interpreted as indicating cloud ionization (see review by Münch 1968). Spatial variations in absorption towards Orion A yielded cloud densities of 680 cm-3
Low column density high-velocity infalling gas (–100 km s-1) was discovered at high Galactic latitudes and attributed to the Galactic halo (see review by Verschuur 1975). High velocity halo gas included a H I bridge between the South Galactic Pole and the Large Magellanic Cloud. The high velocity clouds (HVC) were recognized as not-normal disk gas, since at =–100 km s-1 a =500 pc cloud would fall into the Galactic plane in 5 Myrs. Some HVC clouds were found to be associated with a gas deficiency at lower velocities, suggesting an origin by the acceleration of low velocity gas Verschuur (1975).
The discovery of pulsars in the late sixties provided a powerful diagnostic of the thermal electron component in the ISM. The wavelength dependent dispersion of pulsar wave packets is measured by the dispersion measure, DM cm-3 pc ( is pathlength), which gives the mean electron density in the sightline. The dispersing medium was shown to be interstellar from the approximate correlation between DM and pulsar distance over kiloparsec lengths. An early study of the latitude dependence of dispersion measures for 36 pulsars concluded that the thickness of the ionized portion of the Galactic disk corresponds to DM10–40 pc cm-3, yielding =0.03–0.1 cm-3, in agreement with values derived from thermal absorption of low frequency non-thermal radio background by ionized disk gas Davidson & Terzian (1969).
2.3 Theoretical Foundations
Theoretical concepts have played an important role in shaping the picture of the ISM derived from data. Stromgren’s explanation for glowing regions of H emission (‘Stromgren spheres’) surrounding hot stars located in spiral arms is famous Stromgren (1939), O’Dell (1999). Ionized regions which surround hot stars were modeled using a sharp transition between ionized and neutral gas, with no leakage of ionizing photons into general interstellar space.
Competing explanations were presented for the cloud-like nature of the ISM. In 1940 Ambarzumian and Gordeladse used the presence of discreet interstellar clouds defined by dust associated with reflection nebula to constructed a picture of the ISM with 6–7 clouds per kiloparsec, each with an average optical depth 0.25. The role that supersonic collisions between clouds (relative velocities 40 km s-1) play in creating ionized layers around clouds and evaporating dust grains was discussed in the 1946 George Darwin Lecture by Oort. He concluded that interstellar clouds must be ‘continually reshuffled’ since grains in both dense and intercloud regions have the same size, and commented that a large Reynolds number (109, the ratio of inertial to viscous force) in the ISM suggested turbulence contributes to the reshuffling Oort (1946). Oort also presented the first, tentative, discussion of the interaction between an expanding supernova shell with the surrounding ISM, where he argued that ‘interstellar friction’ heats and eventually brakes (within 104 years) shell material.
The interaction of a hot star with a patchy ISM was studied in 1948 by Stromgren in a basic theoretical paper that also discussed photoionization equilibrium in a cloudy medium. Based on a clumpy ISM with clouds filling 14% of space (5–8 clouds per kiloparsec) and the expectation that the space between interstellar clouds contains material of very low density (‘intercloud’ gas), Stromgren concluded photons would leak away from the immediate vicinity of hot stars, giving a diffuse UV interstellar field (912 Å) similar to a T=25,000 K stellar field diluted by a factor 210-17. This field would, in principle, photoionize low density ISM and cloud rims. In neutral clouds electrons are contributed by trace element ionization with first ionization potential, FIP13.6 eV (primarily C). For the case where clouds are far from individual stars (say 100 pc), the general diffuse interstellar radiation field (contributed by many OB stars) would contain sufficient photons with energies greater than the Lyman limit (wavelength 912 Å) to ionize rims around neutral cloud of thickness 1/2 parsecs. Stromgren predicted emission measure EM3 cm-6 pc (EM= d, where the integral is over the pathlength Ł) for the rims, which was unobservable at that time, contrasting them to EM=9x10⁵–6000 cm-6 pc for O5–B0 star H II regions. Stromgren predicted 0.08 cm-3 for Vir using Na data, close to the value later found from data (see references in Jenkins 1987). Diffuse ionized gas is now known to be widespread, with ionized rims showing EM=2–10 cm-6 pc present on 10%–30% of H I clouds Reynolds (1995). In the 1948 paper Stromgren presented a picture of intercloud material with density 0.1 cm-3 filling the space between interstellar clouds with densities 10 cm-3. Stromgren also formalized the ‘curve of growth’ theory, which relates and as a function of cloud temperature which describes the statistical distribution of atomic velocities. The key variable is the ‘Doppler constant’ 2= + 22, where is temperature, is the Boltzmann constant, the atomic mass is , and is line broadening due to turbulence.
The chemical composition of interstellar clouds can be derived from absorption line data, providing recombination rates and ionization cross sections are accurately known. However, atoms may not behave similarly in interstellar clouds and laboratory vacuum, since densities differ by 9 orders of magnitude. Seaton provided the first careful evaluation of recombination and photoionization rates for atoms in space, calculating the ionization equilibrium of H I, C I, Na I, K I, Ca I, He II, Na II, K II, and Ca II Seaton (1951). Seaton concluded that Orionis data are consistent with ‘mean cosmic abundances’, except possibly for calcium which appeared to be deficient. For the temperature dependent recombination rate (typically -0.7), Seaton used Spitzer’s temperatures of 100 K for H I, and 10,000 K for H II. Using the ratio (Ca I)/(Ca II) from the Dunham observations of Orionis (which is not subject to abundance uncertainties) Seaton determined =0.066 cm-3. Seaton presented the fundamental principle that both dust and gas must be included to evaluate the composition of interstellar clouds, and suggested that metals are concentrated in dust grains when gas composition departs significantly from cosmic values.
The empirical identification of interstellar clouds by velocity components and the sharp outlines of dust clouds against the Milky Way, suggests clouds are discrete objects. However, in 1952 Chandrasekhar and Munch introduced an alternate picture of the ISM in terms of a continuous distribution of material with statistically distributed density fluctuations (see article accompanying Scalo 1999, S99). The microscale of turbulent eddies was characterized by a fundamental parameter corresponding to the distance where a correlation function falls to 1/e. The implications and influence of this stochastic model of interstellar clouds in contrast to discreet cloud models is discussed by John Scalo (S99).
The research of Lyman Spitzer, Jr., strongly influenced the study of the ISM for six decades, and ultimately lead to the launch of UV observatories into space. Two oft-cited papers 444Several of Spitzer’s most important papers are reprinted in ‘Dreams, Stars and Electrons’, along with his personal comments Spitzer (1997) published in the fifties provided proof of the correlation between abundance and velocity anomalies in Ca II (the Routly-Spitzer effect, Section 2.1) and predicted a hydrostatic highly ionized Galactic corona. Spitzer summarized the current state of ISM studies in the December 1953 Henry Norris Russell lecture of the American Astronomical Society Spitzer (1954). Spitzer investigated the putative halo from several approaches. He made an analogy between thermally driven winds in the terrestrial atmosphere and warm heated interstellar gas, and concluded that warm interstellar clouds would be more buoyant than surrounding unheated material and thus would create a ‘Galactic wind’ Spitzer (1954). The discovery at Mt. Palomar of high latitude halo clouds 1–2 kpc away from the Galactic plane, with velocities 100 km s-1 Münch (1957), raised direct questions about the source of the confining pressure. Spitzer made the bold prediction that highly ionized hot ‘coronal gas’ (5 10-4 cm-3, 106 K) confined these clouds, and also explained high-latitude radio emission Spitzer (1956). Chandrasekhar and Fermi (1953) had reasoned that the gravitational pressure of ISM in spiral arms was balanced by the sum of magnetic and thermal cloud pressures, for field strengths 6 G. Using a larger thermal pressure, Spitzer concluded thermal and gravitational pressures balanced, so additional interarm pressure from hot coronal gas was required to balance magnetic pressures. The primary tracers of coronal gas are the abundant highly ionized ions Si IV, C IV, N V, and O VI, with UV resonant transitions. At that time the predicted emission measure of coronal gas (EM0.1 cm-6 pc) was undetectable in H photographic surveys,. The coronal gas predicted by Spitzer in 1956 was found by 17 years later.
The presence of both cold and warm H I raised theoretical questions about the thermal equilibrium between cold dense clouds and warm dilute intercloud material. Thermal stability in a ‘multiphase medium’ was evaluated in a famous paper by Field, Goldsmith and Habing Field et al. (1969), using the criterion that heating and cooling balance in thermal stability.555 Many excellent reviews of interstellar theory are found in the proceedings of a workshop held in honor of George Field in Elba in 1994 Ferrara et al. (1995). The Elba volume presents the ‘scientific genealogy’ of George Field, listing his advisor, Lyman Spitzer, Jr. Carl Heiles was Field’s first graduate student. Less importantly, I was Heiles’ first graduate student. This requirement means that for cooling , must be 1, and cooling increases with temperature. The dominant cooling mechanism for cool clouds is temperature-dependent fine-structure emission from trace elements (such as the C II 158 line). FGH assumed temperature-independent cosmic ray heating of clouds. The result is a thermally unstable phase between two thermally stable phases on the phase-stability log()–log() diagram. These three phases were humorously identified as F(ield) for the warm intercloud phase, H(abing) for the cold neutral phase, and G(oldsmith) for the unstable phase666Don Goldsmith now pursues a prominent and stable literary career sharing the wonders of science with the general public.. The classic FGH paper for modeling a multiphase ISM, along with the discovery of the Radio Loops, inspired many studies of cloud equilibrium in a supernova-dominated ISM. The FGH two-phase theory has been updated with recent heating and cooling rates, including photoelectric heating by small grains and large molecules (PAH’s), and cooling by electron recombination on grain surfaces in warm (8,000 K) gas, and allowing variable input abundances Wolfire et al. (1995).
2.4 The Void in Nearby ISM
Our view of nearby interstellar gas is biased by the location of the Sun with respect to Gould’s Belt and the related local void in interstellar matter now known as the ‘Local Bubble’ (e.g. see, Frisch & York 1986). In the 19th century, Benjamin A. Gould (founder of The Astronomical Journal) realized that nearby bright stars and young stellar OB associations form a ‘ring’ on the sky surrounding the Sun (‘Gould’s Belt’). Up through 1980, optical and UV ISM studies were heavily biased towards clouds associated with the relatively nearby (600 pc) massive hot stars of Gould’s Belt, since these bright hot rapidly rotating stars provided suitable stellar continuum for sampling interstellar clouds. Since hot massive stars tend to be associated with the parent cloud from which they formed, the ring-like distribution of the stars in Gould’s Belt also defines the ring-like spatial distribution of most of the mass of interstellar material within 600 pc of the Sun. The Sun is located inside of this ring and hence inside a void in the distribution of interstellar matter in space. The ‘Local Bubble’ overlaps the interior of Gould’s Belt.
The Gum Nebula borders the Local Bubble. It is an extended region of ionized gas originally discovered in H photographs of the southern Milky Way by Colin Gum in the early fifties (diameter36o, 250–500 pc, centered near 258o, 0o, EM1300 cm-6 pc). The Gum is astronomically rich, with several stellar associations, over six pulsars, several supernova remnants (including Vela) and is bordered by the cluster Collinder 121 which forms one end of the Local Bubble Heiles (1998). The Vela SNR,11,500 years old, is located at a distance of 250 pc and is on the near side of the Gum Nebula.
Surveys of the reddening () of star light by interstellar dust in front of nearby B8–A0 stars found that color excesses outline a vacant region surrounding the Sun, extending 100 pc in the directions of the Galactic center and anti-center, and 50 pc in the directions of Galactic rotation (90o) and anti-rotation (270, see references in Lucke 1978). An expanding H I ring surrounding the Sun, known as ‘Lindblad’s ring’, has morphology and kinematics suggesting association with Gould’s Belt (e.g., Poeppel et al. 1981). The shell expansion age (60 Myrs), elongation, and morphology are consistent with distortion by Galactic rotation. Elmegreen argues that both Gould’s Belt and Lindblad’s ring formed during the compression of ISM during the passage of the last spiral arm (about 50 Myrs ago, e.g., Elmegreen & Efremov 1998). The intercloud –(H) relationship determined from data (Section 3.5), suggests =0.1 mag, corresponding to (H)5x1020 cm-2, as the contour boundary approximately defining Local Bubble ‘walls’. A plot of the space-motion of the Sun through the Local Bubble shows that the Sun has been within this low interstellar density region for several million years (Figure 3, and Frisch & York 1986), a fact I do not believe a coincidence given the sensitivity of heliosphere properties to interstellar pressure Zank & Frisch (1999). By analogy, Sun-like stars with historically stable astrospheres may be the best planetary systems for a search for advanced life forms Frisch (1997, 1993).
3 The Copernicus Era
The dream of flying an ultraviolet spectrometer in space became politically achievable when cold war politics spawned the space age and the launch of Sputnik (October 4, 1957). Before space UV data on the ISM from sounding rockets and early satellites (e.g., OAO-2, ESRO TD-1A), the primary sources of data were optical absorption lines and radio observations which traced primarily cold and warm H I. The ultraviolet, and later extreme ultraviolet (EUV), energy intervals provided a window on hitherto invisible ISM.
The satellite changed the course of astronomy with discoveries of deuterium outside of Earth, of the non-dominance of highly ionized species in the intercloud medium, the association of H2 with reddened stars, and variations in the composition of the gas-phase of the ISM between intercloud and cloudy regions. These first results were published in a series of discovery papers in the May 1973 Astrophysical Journal. Several review articles by members of the original science team have summarized the scientific achievements of (e.g. Spitzer & Jenkins 1975, York 1976, Snow 1976). found 6–9 UV velocity components per 20 km s-1 velocity interval. The range of ionization, temperature and densities discovered by for diffuse clouds resulted in the slow abandonment of the ‘intercloud medium’ concept. The data set remains a unique source of data on disk clouds, and many of the targets have never been reobserved in the UV.
The launch of coincided with strong growth in radio and optical astronomy. Significant advances occurred simultaneously in many areas of ISM studies. The next satellite with a UV spectrometer was IUE, launched in 1978 as was ending its useful scientific lifetime. IUE surpassed expectations by providing extensive data on ISM in the halo and towards faint disk stars (11 mag). Hubble Space Telescope (HST), launched in 1990, provided a UV observatory with a large collecting area in space. The spectral resolution of Goddard High Resolution Spectrograph (GHRS), gave the physical properties of individual disk and halo clouds. The spectrometers of IUE and HST operated over a different and broader spectral interval (nominal 1200–3000 Å) than the instrument (nominal 912–1400 Å). More recently, IMAPS, EUVE, and FUSE provided data in the 3001200 Å interval. The understanding we have of ISM in our galaxy as we emerge into the 21st century represents a synthesis of data from diverse sources.
3.1 Cloudy Sightlines: Oph
Copernicus conducted unprecedented in-depth studies of the ISM towards 20 stars, including moderately reddened stars ( Oph, Per, Per, Per, Oph), and unreddened or lightly reddened stars ( Col, HD 28497, HD 50896, Ara, Pup, Vir, Ori, Ori, 15 Mon, Per, Per, Oph, Sco, CMa, for references see Jenkins 1987). The most influential of these studies was the first thorough study of interstellar UV absorption lines towards the classic ISM target, Oph Morton (1975). Oph (along with other stars) was also observed by HST, giving a detailed picture of the abundances in warm and cold clouds (Savage et al. 1992, SCS92). The Oph sightline is used as an example, because it is consistently selected as a target for improving the quality and breadth of ISM studies. Other stars which sample cloudy regions are discussed in Jenkins (1987).
performed a complete scan of the UV spectrum of Oph, and measured 328 lines of 40 atoms, over 100 H2 lines, and found 44 unidentified lines (later attributed to C I, HD, or H2). The ions Zn II, Ni II, and Cu II were detected for the first time. The –26 km s-1 and –14 km s-1 cloud blends were later referred to as ‘Cloud A’ and ‘Cloud B’, respectively (SCS92). High resolution optical data (0.3 km s-1 FWHM) showed that the two main cloud groups towards Oph represent blends of at least 13 absorption components Barlow et al. (1995). The 10 components common to both the Ca II and Na I absorption profiles show a range of (Na I)/(Ca II) ratios, corresponding to 0.52.2 for Cloud A (including the –22.0 km s-1 component), and 5.6400 for Cloud B Barlow et al. (1995). Therefore the full velocity component structure towards Oph has not yet been resolved in the UV, and the unresolved UV components represent blends of components with different properties.
The chemical abundances of the ISM are found from elemental depletion patterns (Section 3.6). Morton determined the abundances for over 20 elements and found sub-solar abundances, by factors of 34,000. Gas-phase abundances are generally described in terms of the ‘depletion’ of the element, : . The observed and solar abundances for element X with respect to H (or another undepleted element) are (X)/(H)obs and (X)/(H)Sun, respectively. HST GHRS absorption profiles improved abundance precision considerably.
The depletion patterns of Cloud A and Cloud B are distinctly different, and have become a template for defining the properties of warm disk gas and cold disk gas, respectively (e.g. Savage & Sembach 1996). The differences between depletions in Clouds A and B are shown by the behavior of Ti II and Zn II in Figure 1. Figure 1 shows absorption lines in Oph of, from top to bottom, K I (7698 Å), Na I (5895 Å), Zn II (2026 Å), Ti II (3383 Å), Ca II (3933 Å), Ca I (4226 Å), Fe II (2249 Å), and Cr II (2062 Å). The variations in the Ti II line strengths between Cloud A and B are purely depletion variations, since Ti II is the dominant ionization state. These variations can be compared with the column density differences between the two clouds, shown by the HST Zn II line (since Zn II is undepleted). Cloud A contains 4% of the ISM mass in the sightline, but about 65% of the Ti II atoms (see Section 3.6).
In Cloud B, log=21.13 cm-2. The percentage of H contained in H2 (62%) is higher for Oph than for any of the other stars surveyed by . H2 is shielded from optical pumping in Cloud B, giving =56 K from the J=1, 0 levels. Cloud B must be sheetlike. Electron densities calculated from C I/C II, Mg I/Mg II, S I/S II and Ca I/Ca II give 0.7 cm-3 (free from abundance uncertainties). A cloud density and thickness of =104 cm-3 and 0.05 pc, respectively, follow from the assumption that electrons are supplied by the photoionization of trace elements (primarily C). Cloud A includes contributions from the interstellar gas within 14 pc of the Sun, as is shown by comparative studies of the velocities (Section 4.2) and abundances Frisch (1981) of Oph (14 pc) and Oph.
Typical cold cloud temperatures are known from H2 data (45128 K), H I 21 cm absorption data (typically 2575 K), and the median Doppler broading of Na I and K I (80 K). Cloud densities in the range of =115–2700 cm-3 and =0.15–0.38 cm-3 are found from K I data, while observations of tiny scale structure in H I 21 cm in the ISM give 105 cm-3 (Section 4.1 Comparative mean H I and median H I+2H2 column densities for cold clouds are (H I1020 cm-2 (21 cm data, Section 4.1), (H)2 1020 cm-2 (K I, Section 4.2), suggesting that perhaps half of the atoms in cold clouds are in molecular hydrogen.
ISM studies at GHRS resolution fail to distinguished over 60% of the component structure (Section 4.2). These uncertainties are partially overcome by modeling UV data using velocity information from high-resolution optical absorption lines, in a method pioneered by Dan Welty to analyze HST observations of 23 Ori Welty et al. (2000). The three components detected by towards 23 Ori resolved into 21 velocity components in the combined optical/UV data (Figure 2). Variations in the spatial distribution between dominant, subordinate, depleted, and undepleted species prevented the use of a single empirical COG to analyze line strengths and element distributions. Subordinate neutral ionization states sample cold dense regions (K I, Ca I, Na I in Figure 1). The dominant ionization states of strongly depleted species show the broadest distribution (e.g. Ti II), reflecting enhanced column densities in warm gas, and ionization states of mildly depleted species have intermediate values. The fine-structure C I lines give densities 10–15 cm-3, and a cloud thickness 12–16 pc for the low velocity gas towards 23 Ori. H2 data gives =65–150 K, yielding thermal pressure log()3.10.1 cm-3 K. The inclusion of turbulence increases pressure by less than a factor of two.
The perils of deriving electron densities from a single species are illustrated by comparison of values derived from twelve plasma diagnostics in the cold gas gas towards 23 Ori Welty et al. (2000). Photoionization equilibrium calculations for C, Mg, Al, Si, P, S, Ca, Mn, Fe and Ni, Na I, and K I yield calculated electron densities ranging from 0.04 cm-3 (S, Mn, Fe), to 0.95 cm-3 (Ca) and 0.25 (C, Mg). The (Ca I)/(Ca II) ratio indicates varies by a factor of 2.6 between the two strongest cloud components. The average properties of the cold low velocity components give 0.150.05 cm-3, and 10–15 cm-3, or a fractional ionization of 1%, indicating that H must be partially ionized. The electron density determined from C II∗/C II is a factor of 2–3 less than values derived from Na I, perhaps indicating the fine-structure lines are formed in the shielded cloud core.

3.2 Intercloud Material
Radio data show that 60% of interstellar H I atoms are contained in warm clouds (500 K, Section 4.1). Possible ionization sources for the intercloud medium include stellar radiation, soft X-rays or cosmic rays Dalgarno & McCray (1972). The initial search for intercloud absorption features towards unreddened stars (0.03 mag) did not detect highly ionized species. Observations of bright unreddened stars ( Sco, Vir, HD 50896, HD 28497, and Col) showed that stars with low mean H I space densities may show foreground clouds that are small and dense (10–103 cm-3), in addition to low density warm gas. found that N II is widespread in the ISM. IUE and HST provided data on warm low density clouds towards halo stars, and distant disk stars.
The Sco sightline (216 pc, log19.5 cm-2, =0.03 mag) contains neutral and ionized warm low density interstellar clouds. Sco is in the interior of Loop I (Section 4.1) and samples nearby interstellar gas towards the upwind direction (see references in Jenkins 1987). Five physically distinct absorbing regions are found. A warm neutral cloud (log=19.23 cm-2, Component 2 shows typical properties for warm neutral gas, 10,000 K, =0.3–9 cm-3, and less than 10% ionization. The cloud thickness is 5 pc. The spatial distributions of the neutrals H I, N I, O I, Ar I are similar due to charge exchange (O I, H I) and photoionization (N I, Ar I). Component 3 is an extended density bounded H II region (0.1–0.3 cm-3) with diameter 10–30 pc, 104 K, and ionization consistent with ionization by the general Galactic radiation field with 24,000 K (comparable to a B1 star and the diffuse Galactic field predicted by Stromgren). The fine-structure populations of C II and N II give =0.1–0.3 cm-3, and Mg I/Mg II implies 0.5 cm-3. The emission measure of this diffuse H II region towards Sco is comparable to the fully ionized H II filaments detected in H emission ( d1–3 cm-6 pc, e.g., Reynolds 1995). Depletions in the warm neutral and ionized components are similar, log –1.4 dex. Mg I formation is enhanced in warm, T6,000 K, ionized gas where dielectronic recombination enhances Mg II recombination. Abundances in the H I and H II clouds are similar, including similar depletions for Fe and Si. Component 1 is partially ionized, with similar depletions as the other gas, and may represent a ionized cloud 7 pc thick. Components 4 and 5 are highly ionized (with S IV, and (Si III)/(Si II)1) and may represent shocked gas.
Low column density ((H)1018 cm-2) intermediate velocity photoionized clouds are a common component of the ISM. For example, HST observations of intermediate velocity gas (IV, =20–50 km s-1) towards disk (e.g. 23 Ori) and halo (e.g. Col) stars show warm (4,000–8,000 K) tenuous components of photoionized gas with (Si III)(Si II). Towards 23 Ori, ==1.5–5.0 cm-3, and the cloud thickness is 0.001 pc (200 AU Welty et al. 2000). showed that this IV gas covers Orion, indicating filamentary material.
3.3 Deuterium
The discovery that H2 is widespread in interstellar clouds was not a surprise. However, York’s discovery of D I in diffuse interstellar clouds was unexpected. As a junior member of the staff, Don York was assigned the ‘uninteresting’ stars where no absorption features had been seen optically. However, these were the stars where less saturated lines permitted the most accurate identification of absorption features. The D I Ly line is superimposed on the wings of the H I Ly line, and blueshifted by 80 km s-1 from the H I Ly line center. In the unreddened star Cen, the D I line is less saturated, giving the first D/H ratio determined in interstellar space (D I/(H I=1.40.2 10-5 Rogerson & York (1973). Hydrogen column densities were determined from LyLy lines, minimizing uncertainties due to Ly saturation.
Deuterium is produced in Big Bang nucleosynthesis, and 50% of the primordial D is destroyed by astration in stellar interiors. The early D/H ratio is consistent with ratios derived recently from HST observations of nearby stars (e.g. see papers by Linsky, Vidal-Madjar, Linsky, and others). However, some studies suggest the observed variations in the D/H ratio between stars are statistically significant and represent real variations in the chemical composition of nearby ISM Vidal-Madjar & Gry (1984). The high spectral resolution of IMAPS (2.5 km s-1) permitted this question to be revisited Sonneborn et al. (2000). Significant variations in D/H are still seen, from 0.74 10-5 in Orion A to 2.2 10-5 in Vel. These variations, however, do not correlate with N/H, as expected for ISM astration in stellar interiors. Therefore this very important question is unresolved. Unresolved saturation in the D I lines may be the culprit in these discrepant results, and this question may not be settled until an ultra-high resolution 900–1200 Å spectrometer is available in space.
3.4 Molecular Hydrogen
Molecular hydrogen probes cold clouds and provides an interstellar thermometer (see reviews by Spitzer & Jenkins 1975, Shull & Beckwith 1982). Theoretical studies predict that most hydrogen is in molecular form in reddened clouds. The formation of H2 on grain surfaces is offset by a two-step dissociation process. Photons, absorbed into the Lyman and Werner bands, cascade from the excited electronic states into unbound vibrational levels. Shielding in cloud cores allows the fraction of hydrogen in H2, =2(H2)/[(H I +2(H2)], to approach unity. For (H2)1019 cm-2, the H2 J=0 and 1 rotational levels typically have strong damping wings which provide unambiguous column densities. The J=0,1 levels give and . Observations of 61 stars with (H2)1018 cm-2 give a mean cloud temperature of 7717 K, and a range of 45128 K.
In unreddened sightlines, self-shielding is no longer able to reduce optical pumping. The detection of complex H2 profiles, with apparent broadening of the H2 lines with increasing J towards many stars (e.g. Ori, Ori A, Col, Ori, 15 Mon, 30 CMa, Pup), was explained as due to one or more shortward components that are relatively strong at high J-values and therefore have high . UV pumping models produce the blueward components in dense 100 cm-3, sheetlike (0.02 pc) clouds that may either be close to the background star or associated with compressed neutral post-shock gas or thin expanding shells Spitzer & Morton (1976).
Molecular hydrogen was found to be widespread in clouds with 0.08 mag,
where H makes the transition from primarily atomic
(0.01) to molecular (0.01).
For 0.15 mag 90% of the stars have 0.1, and
for 0.15 mag 74% have 0.1.
The mean gas-to-dust ratio for all sightlines is
(H)/=5.81021 atoms cm-2 mag,
but stars primarily sampling ‘intercloud’ gas towards disk stars
(0.01) yield
((H I+2(H2))/=5.01021 atoms cm-2 mag
Bohlin et al. (1978).
More recent comparisons between high angular resolution H I, CO,
and 100 m emission show that 26 infrared cirrus clouds
show substantial amounts of H2 for (H)41020 cm-2 Reach et al. (1994). Recent FUSE results
show that H2 is ubiquitous in the Galactic halo.
The excited J lines were blended at resolution. IMAPS (with a nominal resolution of 2.5 km s-1) measured about 70 absorption lines from the Lyman and Werner H2 bands in Sco for the rotational levels J=05 Jenkins et al. (1989). However, systematic shifts in (H2) reconstructed from strong versus weak lines indicate that IMAPS did not resolve all of the absorption components. These inconsistent results were resolved if the lines consist of packed unresolved components with pure thermal broadening at 80 K. The high J-level column densities are consistent with population by optical pumping from radiation originating in nearby hot stars.
3.5 The Distribution of Nearby Clouds
Hydrogen is the most abundant element in the ISM, and accurate values for (H I could be determined from the Ly through Ly lines of H I in the bandpass. Accurate (H I values are found from Ly data when the damping wings can be used, typically for (H I5 1018 cm-2) and stars hotter than B1. A survey of Ly and H2 towards 100 nearby (1 kpc) stars provided a detailed picture of the spatial distribution of interstellar hydrogen (e.g., Bohlin et al. 1978). The asymmetric spatial distribution of ISM within 1 kpc in the disk of the Galaxy, seen originally in reddening data, and again in OAO-2 data, was demonstrated by data to be a systematic variation of as a function of galactic longitude. The ‘Local Bubble’, as projected onto the Galactic plane, is shown in Figure 3 (also see Paresce 1984).
The mean observed H density is =+2)1.15 atoms cm-3. The lowest values are in the third quadrant, 0.008 cm-3. (The third galactic quadrant corresponds to =180o270o, towards CMa.) Somewhat larger values are found towards Orion, typically =0.2–0.5 cm-3. Higher densities are found towards Ophiuchus (e.g. =5.5 cm-3 towards Oph), and Perseus (e.g. =2.2 cm-3 towards Per). Lower densities are found in intercloud sightlines (0.01), =0.16 atoms cm-3. Mean densities for H2 and H I respectively are =0.14 molecules cm-3 and 0.86 atoms cm-3 Bohlin et al. (1978). Figure 3 shows the strong variations in the mean space density of ISM in the nearest 500 pc (from Frisch & York 1983).
3.6 Chemical Composition of Disk ISM
surveyed H I, H2, C I, S I, O VI, Mg I, Mg II, P II, Cl I, Cl II, Mn II, Fe II, Cu II, Ni II, and Zn II across a range of interstellar cloud conditions, and characterized both the distribution and composition variations of the ISM within 500 pc. Together, and optical observations measured transitions from two-thirds of the lightest 20 elements in the periodic table. The systematic underabundance, compared to solar, of certain elements in neutral gas could not be attributed to ionization (but more recently selected solar abundance standards, e.g. O, have been questioned). Debates continued on the origin of the dust grains which are the supposed repositories of the atoms missing from the gas-phase, as postulated by Seaton. IUE data permitted abundance surveys towards faint disk and halo stars, although moderate resolution compromised the abundances derived from saturated lines. IUE studies of Zn II were important as the Zn II 2026 Å line is weak and fell in a sensitive region of the IUE detector. HST GHRS data provided extensive data on abundances in individual warm clouds in the disk and halo, and provided the detection of (or limits on) additional rare elements ((X)/(H)10-8) not seen previously (e.g. B, Co, Ga, Ge, As, Se, Rb, Sn, Pb, V, Kr and Te). The complete picture on elemental abundances in disk clouds provide data that can be used to test grain formation hypotheses, elemental origins, and chemical mixing in the ISM. Several excellent reviews discuss ISM abundances (e.g., Jenkins 1987, Harris 1988, Savage & Sembach 1996).
Several primary trends in abundance patterns were by discovered by , and confirmed by IUE and HST data: A. The depletion patterns of elements are grouped, with refractory elements consistently showing greater depletions than volatile elements. B. The most depleted elements also show the largest variations in depletions (which may be a tautology, as Don York has pointed out). C. Refractory element abundances generally anticorrelate with cloud velocity. D. Volatile elements are generally undepleted in most sightlines, and may be undepleted in all sightlines if component structures are fully resolved and accurate (H) values available. E. Depletions generally correlate with the mean density in a sightline, , although scatter is present. These trends are seen in Figure 4 (A, D), Figure 6 (B,D), Figure 1 ().
Refractory elements (e.g. Fe, Mg, Mn, Ca, Ti, Cr, Ni, Cu, Al, V) are characterized by high condensation temperatures and large depletions (log 1.0 dex in the cold clouds). In contrast, volatile elements (Kr, S, Cl, Zn, C, N, O, Na, Cl, Ar) are characterized by low condensation temperatures (1,000 K) and small depletions. The volatiles Zn and S are present at solar abundances in most sightlines (log 0.5 dex), and arguments for small depletions towards reddened stars are unconvincing because of unresolved component structure. This behavior of refractory versus volatile elements is evident in the Routly-Spitzer effect, originally identified (in the 1930’s) for optical Ca II and Na I lines, although Ca II ionization offsets reduced depletions in warm low density gas.

A survey of Fe II towards 55 early-type stars provided a statistically significant sample which established the anti-correlation between gas-phase abundances of Fe and Savage & Bohlin (1979). Typical values range from log –1.7 dex towards Orion stars (0.12 mag) to log –2.5 dex towards Oph (=0.47 mag). Ionization is not responsible for these variations, since Fe II is the dominant ionization state in both warm neutral and warm ionized gas. Also, warm ionized and neutral clouds with similar densities and temperatures show similar depletions. The variable is also clearly not the best descriptor of depletion variations, since for example Oph has two cloud groups exhibiting dramatically different abundance patterns (Figure 1), but the same (which is a sightline averaged value). The large variations in gas-phase abundances found for refractory elements is easily understood by noting that 99% of the Fe atoms, for example, are depleted onto dust grains. The destruction of 1% of the dust grains doubles the gas-phase abundance of Fe.
The true test of ISM metallicity will require accurate abundances for volatile elements in clouds sampling a wide range of physical conditions. B-star abundances are subsolar by a factor of 2, and may instead be the appropriate model for interstellar metallicity Snow & Witt (1996). Currently, evidence for solar metallicity in the ISM is limited. IUE and HST consistently show that volatiles (Zn, S, Cl, N, O, Kr) are present is approximately solar abundances in sightlines with low mean densities. Studies of Zn (200 stars), Cl (40 stars), and S (200 stars) show that these elements are depleted by less than factors of two in low density (0.1 cm-3) sightlines. The uniformity of Zn and S abundances at near solar suggest that metallicity is relatively invariant within 500 pc. Limited results suggesting that Zn depletion increases with increasing (e.g. log –0.5 dex at =0.1) needs deeper investigation of the velocity component structure. Evidence in favor of subsolar metallicity are observations of Kr, where observations of weak lines suggest abundances that are 55% solar Cardelli & Meyer (1997). The noble element Kr should not deplete onto dust grains.
Volatile element depletions are generally independent of mean density for log22 cm-2. observations of O I (1356 Å) and N I (1160 Å) towards 53 stars found O, N depletions insensitive to with ratios /8 to within 25%–50%, and that O and N abundances are 40%–70% solar. HST provided C, N, O abundances with systematically lower errors through observations of weak lines (see papers by Dave Meyer and collaborators, e.g. Meyer et al. 1998). In clouds with log (H I=20.2–21.2 cm-2, C, O, N abundances are, respectively, 39%, 43%, 81% of solar values. Sulfur is undepleted in warm clouds, but showed small depletions in cold clouds (–0.1 dex). Apparent suprasolar abundances are observed for S in cases where (H IH II, and ionized gas is not included in estimating (H). Chlorine is a special case; it is weakly depleted (factors 2–3), but Cl II reacts rapidly with H2. (Cl I)/(Cl II) is correlated with H2 for clouds where H2 is optically thick, while Cl I is unobservable in most other sightlines.
studies of the collisionally populated C I fine-structure lines provide an independent diagnostic of cloud pressure (e.g., Jenkins & Shaya 1979). As a trace neutral, 2, similar to Na I and K I which correlate tightly with C I. However, the correlations are slightly steeper than linear, possibly indicating that the photoionization rates may vary between the species, possibly from shielding of C-ionizing photons by dust in the thicker clouds. Using the fact that the relative amount of carbon in C I∗ versus C I∗∗ is a function of the local gas pressure and temperature, Jenkins and Shaya examined the parameter range appropriate for neutral clouds. The carbon fine-structure lines towards 15 stars yielded H I gas pressures 104 cm-3 K, while some show stars showed pressures 104 cm-3 K, exceeding the standard ISM pressure 1,500 cm-3 K Spitzer (1978). Possible sources for high pressure gas include H II regions near hot stars.
The initial discovery of depletion differences between different elements led to discussions as to whether this was an effect of the first ionization potential (FIP) or of the element. Eventually better data resolved this question. Figure 4 shows that is the dominant variable since Zn and Be, for example, have similar FIP’s (9.3 eV), yet the depletions vary by factors of 15. A second puzzle related to the overall variation of depletions with . This correlation was interpreted as support for in situ grain formation in interstellar clouds Snow (1975). Spitzer, however, noted that a statistical sampling of a mixture of warm and cold clouds with densities 0.2, 0.7 and 3 cm-3 in the sightline would explain the observed variations in the depletion- correlation Spitzer (1985). Spitzer predicted that short pathlengths are more likely to sample intercloud gas, and intercloud contributions are required to explain the better correlation between depletions and , in comparison with other parameters such as (H).
The opposing view presented grain condensation in stellar outflows, with depletion regulated by Field (1974) and reflecting the grain formation process. The tight envelope of the - relation shown in Figure 4 supports this later viewpoint. However, additional grain modification clearly takes place in the ISM, and mantle accumulation may occur. In principle, the mineralogy of interstellar dust grains can be derived from these depletion data. Ebel (2000) compared the condensation sequence of dust grains in a solar composition stellar outflow with observed depletions (Figure 4). He interpreted the natural groupings of elements with similar and depletions as the result of the formation of Ca-aluminates (Ca, Al, Ti), olivine (Si, Mg) and metals (Fe, Ni, Cr, C,). The formation of each group corresponds to a phase in the condensation sequence. The ability of condensation calculations to explain the observed depletion groupings, including very different depletions found for elements with similar values (e.g. Mg, Ca), provides strong support for dust grain formation through condensation in stellar outflows.
3.7 The Energetic ISM
Highly ionized gas and high-velocity disk clouds are two aspects of an ISM component where collisional ionization is significant. Highly ionized interstellar atoms were expected in the ISM, either through production by X-rays or cosmic rays. The abundances of Si IV, C IV, N V, and O VI peak, respectively, at temperatures 0.6, 1, 2 and 3 105 K, in collisionally ionized gas. Stellar evolution supplies energy to the surrounding ISM through supernova explosions and mass-loss from massive stars. Routly and Spitzer showed that abundance patterns vary with cloud velocity, an effect attributed to grain destruction in shocks associated with expanding supernova remnants. Such high-velocity gas may also be subject to ionization anomalies.
Broad shallow low velocity O VI lines were found to be widespread. A search for lines of O VI, C IV, Si IV, N V towards five stars (0.1–1 kpc) found that only O VI was generally seen York (1974). Combined limits on (S IV)/(O VI) and line widths suggest an origin in hot gas with 2 105 2 106 K. A more extensive survey of O VI towards both reddened and unreddened stars found temperature limits 3.6x10⁵ K, and line broadening and ion ratios consistent with formation in hot plasma filling 20–100% of the sightline, and in pressure equilibrium with normal cool clouds Jenkins (1978). About six O VI absorbing regions per kpc were found, with (O VI)1013 cm-2 per region and a dispersion for bulk O VI cloud velocities of 26 km s-1. The velocity distributions of O VI, Si III, and N II are correlated, indicating the O VI lines is affiliated with less ionized gas Cowie et al. (1979). The interstellar nature of O VI was shown by the correlation between (O VI) and stellar distances. Asymmetrical O VI profiles towards low halo stars (HD 28497, Col) showed contributions from both local and halo gas.
The detection of truly interstellar C IV and Si IV required long disk sightlines (1 kpc. The first detections of Si IV and C IV towards disk stars (=0.3–3 kpc) found the lines strongest towards O and Wolf-Rayet stars connected to nebulosity Smith et al. (1979), Bruhweiler et al. (1980). Although most of the strong sharp C IV and Si IV lines towards hot disk stars are formed in nebulosity connected with the stars, broad shallow C IV lines with no associated Si IV appear to arise in the hot interstellar gas producing O VI York (1977). HST data showed that a diffusely distributed component of hot gas ((C IV)/(Si IV)4.7 and C IV/N V3.0) also exists in the Galactic disk Huang et al. (1995). Hot gas towards distant disk stars, 3 kpc, show a strong correlation between C IV, Si IV, N V line strengths and star distance. The highly ionized and moderately ionized regions are associated, since the widths of high- and low-ionization lines are correlated. In the direction of Oph, three types of highly ionized gas are seen. Narrow Al III components originate in an expanding H II region around Oph, and broad weak Si IV and C IV components are detected at –26 km s-1 (Cloud A, Savage et al. 1994). GHRS observations of 23 Ori showed that high ions such as S III, Si IV, C IV, N V are associated with both intermediate and low velocity warm and cold clouds (Figure 2), suggesting contributions from cloud interface regions.
The frequency of optical high velocity clouds and H I 21 cm shells motivated searches for the UV signature of these features. determined that high velocity clouds (100 km s-1) are widespread in the disk, including towards active star-forming regions such as Vela and Orion-Eridanus, and also towards field disk stars. Two out of thirteen nearby associations (Orion and Carina) show high velocity shells with expansion velocities 100 km s-1 and ages 400,000 years Cowie et al. (1981). Evidently recombinations lag cooling in these previously shocked clouds. HST observations of HVCs towards 23 Ori, Vela, and Col found supraionized gas, showing ionization levels consistent with cloud temperatures of 25,000 K, but line broadening consistent with kinetic temperatures 12,000 K (e.g., Trapero et al. 1996). The discrepancy is resolved if the HVC represent a cooling radiative shock. The HVC gas is seen in front of most of the Orion stars, and has been denoted ‘Orion’s Cloak’. / yields ==0.4–0.5 cm-3 for 8,0002,000 K, or pressure log()=3.7–4.0 cm-3 K. If carbon is undepleted, the individual HV components have thickness 0.005–0.12 pc (1–24 AU). Several superbubbles were investigated by IUE and GHRS, including the nearby Radio Loops I and IV (e.g., Sembach et al. 1997). The superbubble properties are similar, showing strong Si IV, C IV and weak N V. Within the bubble interiors, C IV is strongly enhanced compared to N V. Sightlines sampling tangential directions through the shells (e.g. Loop IV) show relatively normal high ion ratios, but broader lines. In many cases, high-ionization gas is kinematically associated with low-ionization species (e.g. N I, S II, Si II, Fe II) which have narrow absorption features at intermediate velocities.
Intermediate velocity clouds (IVC, 2060 km s-1) are visible in N I, N II, Si III Ca II and Na I Cowie & York (1978). The ratios (Fe II)/(S II) and (Si II)/(S II) correlate positively with increasing cloud velocity, indicating grain destruction processes such as produce the Routly-Spitzer effect Shull et al. (1977).
3.8 The Nearest ISM and the Local Interstellar Wind
Prior to the only observed features in nearby ISM were Ca II lines in a small region towards Oph (Section 2.1). observations of the nearest stars (1.3–20 pc) showed that low density (0.1 atoms cm-3) interstellar H I is present in front of all known stars, including Leo (24 pc, 0.02 cm-3, Rogerson et al. 1973), and Bootis (11 pc, 0.02–0.1 atoms cm-3, Moos et al. 1974). Contemporary with , Boksenberg et al. used a balloon-mounted spectrograph to observe Mg I and Mg II in the direction of Leo, yielding the first estimate of the electron density in nearby interstellar gas (0.6 cm-3 at =104 K, Boksenberg et al. 1975). The nearby ISM was observed in nearby stars of A, B spectral types (e.g. CMa, Lyr, Gru, Leo Rogerson et al. 1973, Kondo et al. 1978), and cool (G, K) stars where interstellar Ly absorption is superimposed on chromospheric emission features ( Eri, Ind, Aur, and Cen A, e.g. McClintock et al. 1978, Landsman et al. 1984). Interstellar lines superimposed on chromospheric emission require the uncertain analysis step of modeling unattenuated stellar Ly emission based on observations of solar Ly, which is the only unattenuated stellar Ly that can be observed because of the strength of the interstellar Ly feature. Nevertheless, a consistent picture emerged showing that the Sun is embedded in a low density (0.1–0.15 cm-3) warm (7,400 K) interstellar cloud extending to at least 3.5 pc from the Sun in all directions. Observations of the unreddened stars Vir and Sco found 7,000 K for clouds that are 1–10 pc in size and probably embedded in the LISM. Nearby (30 pc) interstellar gas has an asymmetrical distribution (Figure 3, and Genova et al. 1990). This asymmetry mimics the asymmetry of the Local Bubble in the sense that the lowest column densities through the Local Fluff are towards the third Galactic quadrant and North Galactic Pole, and this asymmetry results from a flow of gas away from Loop I Frisch (1981).
On a personal note, I found it intriguing that the velocities of interstellar H I and He I inside of the solar system are close to the Ca II velocity towards the nearby star Oph, and thought that the Sun might inside be inside of the Oph cloud. As a result, I proposed observe the interplanetary Ly glow with . 777However, I did not dare include this motivation in my observing time proposal, since at that time ISM was what was viewed towards distant stars, and not part of the solar system. Don York, who organized the Guest Investigator program, told me that before approving my proposal he had to do some library research to verify that interstellar gas really is observed inside of the solar system. The results were the first spectral observations of the Ly glow, which established the relation between ISM inside and outside of the solar system Adams & Frisch (1977). Thus obtained the first spectrum of interstellar Ly emission within the solar system during the 1975 solar minimum conditions. We found a velocity for the ‘local interstellar wind’ in good agreement with interstellar velocities towards several nearby unreddened stars (e.g. Vir).
also made the surprising discovery that the H I Ly line towards the nearest star Cen (1.3 pc) is redshifted by 82 km s-1 with respect to the unsaturated D I line in the same star (e.g. Landsman et al. 1984). This shift, since confirmed by IUE and HST, was originally interpreted as flagging the existence of two clouds in front of Cen with the Sun located near the boundary between the clouds. The heliosheath contribution to this line was recognized later (e.g. Linsky & Wood 1996, Gayley et al. 1997).
The nearest ISM is nicknamed the ‘Local Fluff’, a term first used by Don Cox at the Local Interstellar Matter COSPAR meeting held in Toulouse France in 1986. He was trying to describe the tenuous nature of the interstellar gas surrounding the Sun, and finally waved his hands and said ‘it’s just sort of this local fluff’. The ‘Local Fluff’ represents the ensemble of interstellar clouds (or cloudlets) within 30 pc of the Sun, regardless of cloud velocity. (The proceedings of this meeting, and a related heliosphere session, offer an early look at research into the properties of the LISM.)
The ISM nearest to the Sun is our best sample of warm partially ionized diffuse gas. HST studies of the nearest ISM show typical mean densities 0.1 cm-3 and temperatures 7,000 K. Observations of Mg II/Mg I and C II fine-structure lines yield ionization levels of 0.12 cm-3, which are well modeled by photoionization models which include EUV radiation from an interface between the Local Fluff gas and hot plasma. The LISM gas shows the abundance pattern of shocked gas, with dex–1.34 dex locally Frisch et al. (1999). A recent theoretical model of radiative transfer in local gas shows cloud properties corresponding to T7,000 K, 0.24 cm-3 and 0.13 cm-3 Slavin & Frisch (2002).
4 Ground-Based Astronomy during the Space Age
The launch of the satellite coincided in time with several important advances in ground-based astronomy, including the discoveries of giant shells of radio continuum emission, of pervasive components of tenuous neutral gas, diffuse plasma, tiny ‘cloudlets’, and of a highly structured neutral component seen in absorption in both optical and radio data. Ground-based astronomy benefited from large telescopes, long exposure times and flexibility in detector design, providing an important synergy with UV data.
4.1 The Radio Sky
Radio astronomy supplies two-dimensional morphological data on the distribution of neutral and ionized gas in space, and provides a key perspective on the structural characteristics of the ISM, including determining the spiral structure of our Galaxy (see review by Burton 1988).
The inhomogeneous H I 21 cm sky led to the search for the lowest column density sightlines out of the Galaxy. In the Galactic plane, the direction showing minimum column density ((H I4.5 1021 cm-2) is towards the sightline =245o6oand =3o6o Stacy & Jackson (1982). This minimum, at the edge of the Gum Nebula and known as the ‘Puppis Window’, occurs as a 6o hole in the local gas at =–10 to +5 km s-1. The Puppis Window samples an elongated direction through the third quadrant void (seen in reddening data, Section 2.4), and contains the stars CMa and CMa, known for their exceptionally low column densities Frisch & York (1983), Paresce (1984), Welsh et al. (1997), Heiles (1998). The Puppis Window appears to result from overlapping shells, including the 0.8 kpc distant supershell GSH 238+00+09. (Another name for the Puppis Window is the ‘ CMa tunnel’.)
The Rosetta Stone for understanding H I shells, anomalous Ca II abundances, the preponderance of negative velocity Ca II components, and the Routly-Spitzer effect was the discovery of large loops of radio continuum emission, especially Loop I encompassing the North Polar Spur. Four nearby (250 pc), high-latitude, non-thermal, radio continuum shells (408 MHz) were found with surface brightness consistent with the brightness-diameter relation found for supernova remnants (SNRs, e.g. Berkhuijsen et al. 1971). The Radio Loops are formed by synchrotron emission from cosmic ray electrons interacting with the interstellar magnetic fields that have been compressed into giant shells by expanding supernova remnants. In a widely influential talk at an IAU symposium in 1979, Harold Weaver linked the Loop I radio continuum shell with filamentary H I seen in 21 cm emission, and concluded both were formed by a large supershell around the Scorpius-Centaurus Association. The large nearby Radio Loop I (distance130 pc, radius 116 pc), also known as the North Polar Spur (NPS), dominates ISM in the northern hemisphere sky and is associated with a slowly expanding H I shell (20 km s-1) and a bright source of X-ray emission. Loop I is a supernova remnant in the radiative phase. The radio continuum, H I and X-ray emission from Loop I are spatially separated, with ionization decreasing from the interior to exterior of the shell. Comparison of rotation and emission measures, Zeeman splitting, and H I 21 cm data yield best values of 0.4 cm-3 1.2–6 , =4 cm-3, and 100 K (21 cm data) in the NPS (e.g. Heiles 1989). Magnetic pressure 4,000 K cm-3 dominates the thermal pressure of neutrals, and indicates an unstable gas. This latter point is important because generally magnetic pressure is neglected.
The direction with minimum (H I towards the Galactic poles is towards =150o, =53o, where log=19.65 cm-2 (the ‘Lockman Hole’, Dickey & Lockman 1990). Four H I velocity components are seen towards this minimum (0, –10, –50, and –100 km s-1), with most H I mass at 0 km s-1. The stratification of H I perpendicular to the Galactic plane in this direction indicates that halo gas (500 pc) contains 13% of the H I and corotates with disk gas. The H I layering can be described as the sum of three distributions. The CNM distribution can be described by a Gaussian with a scale height dispersion of 100 pc. The WNM can be described by the sum of two distributions: a Gaussian with scale height dispersion 250 pc, and an exponential with scale height 500 pc (Dickey & Lockman 1990, Table 1).
Observations of H I in absorption versus emission have provided an increasingly precise picture of the relative distributions of cold and warm H I gas. The first large-scale surveys of 21 cm absorption towards bright radio sources yielded a statistical picture of the components of the two-phase ISM (e.g. Hughes et al. 1971, Radhakrishnan & Goss 1972). The equivalent thickness of the Galactic plane for cold absorbing clouds was 330 pc, with a midplane density of 0.29 cm-3 for an assumed Gaussian distribution. The WNM extended to larger scale heights, with thickness 585100 pc, and lower midplane densities (0.155 cm-3). Cold (60–80 K) absorbing clouds were found to contain 35–45% of the H I, and appear to be confined mainly to spiral arms. The H I absorbing clouds have mean column density (H I/=1.5 1019 atoms cm-2 K-1 kpc-1 and a harmonic mean temperature =71o9o. Typically over 2.5 cold clouds per kiloparsec are found for a sightline along the Galactic plane. The emission is contained in broad features formed in ubiquitous warm intercloud H I. Mean spatial densities for the cold and warm clouds, respectively, are 0.7 cm-3 and 0.25 cm-3. The temperatures found for the WNM are uncertain, since a single unrecognized cold (80 K) cloud in the sightline containing one-tenth of the warm cloud column density would decrease the WNM temperature derived to 800 K Kulkarni & Heiles (1987).
With the discovery of highly-ionized gas, the concept of a two-phase medium fell out of favor, and the term ‘not strongly absorbing’ gas (NSA) was introduced to distinguish the kinematically broad H I 21 cm emission components (5,000 K) from narrow cold absorbing components Dickey et al. (1979). The NSA gas was attributed to either warm surface layers on cold clouds, or independent clouds. NSA clouds have an asymmetric velocity distribution, with –20 km s-1 and +10 km s-1 components equally frequent, possibly flagging infalling gas since many NSA sightlines are towards the North Galactic Pole region. The exponential form of the high-velocity tail was similar to the distribution of Ca II components seen optically (Section 2.1). NSA gas is deficient in the interior of the Local Bubble surrounding the Sun, and beyond that forms 35% of the observed H I Heiles (1980). Large holes in the NSA H I are common (diameters400 pc), evidently corresponding to the interiors of shells surrounding stellar associations. Heiles showed the absence of NSA is associated with anomalous velocities and anomalous velocity dispersions for H I, and may represent ISM swept up by expanding shells of gas which have recombined before deceleration.
Recently Heiles (2001) has used high signal-to-noise data on Zeeman splitting of the H I absorption line to produce accurate temperatures for cold clouds. He found that 54% of the CNM clouds (containing 61% of the total CNM column density) have temperatures in the range of =2575 K. Colder clouds, =1025 K, are also present and contain 11% of the mass. About 40% of the WNM components have =5005,000 K, containing 47% of the total WNM column density. About 60% of the H I is WNM with 500 K. The mean column densities for WNM and CNM, respectively, are 2.2 1020 cm-2and 0.8 1020 cm-2. The WNM temperature range (=5005,000 K) coincides with the thermally unstable range which separates CNM from WNM in the MO theory.
The discovery of radio continuum loops, H I filaments, and H I shells led to a new class of ISM models, based on the injection of energy into the ISM from expanding supernova remnants. Models included overlapping remnants which create tunnels of hot gas in space Cox & Smith (1974), Galactic fountains which release hot buoyant gas into the low halo Shapiro & Field (1976), models of cold clouds evaporating inside of a supernova remnants (McKee & Ostriker 1977, McCray & Snow 1979, MO), and models of expanding superbubble shells sweeping up the ISM MacLow & McCray (1988). The MO multiphase model predicted successive layers of hotter and more ionized gas on the surfaces of cool clouds. In this equilibrium picture, SNR evolution is altered by the evaporation of embedded clouds, and a large fraction of the disk is filled with hot ionized material (HIM, =4.5105 K, n=0.0035 cm-3, =/=1.0). MO predicted the outer regions of standard clouds of cold neutral material (CNM, =80 K, n=42 cm-3, =10-3) are ionized by diffuse stellar UV and soft X-ray photons, producing layers of warm ionized material (WIM, =8,000 K, n=0.37 cm-3, =0.15), and warm neutral material (WNM, =8,000 K, n=0.25 cm-3, =0.68) near cloud surfaces. Models of the ISM are summarized nicely in articles by Cox and McKee in the Elba volume Ferrara et al. (1995).
A seminal advance in understanding high-latitude ISM resulted from the combination of Northern and Southern Hemisphere 21 cm emission data, to create a series of ‘maps’ of the 21 cm sky (0.5o resolution) at discreet velocity intervals for 10o (e.g., Colomb et al. 1980). The recent standard for a 21 cm survey is the 1 km s-1 resolution Leiden-Dwingeloo survey of northern hemisphere H I between –450 km s-1 and +400 km s-1 Hartmann & Burton (1997). The ISM in the solar neighborhood exhibits rich structural complexity, with most material contained giant loops, arcs, ‘worms’, and incomplete shell-like features offering little support for the classic Ambarzumian picture of an ISM filled with spherical clouds. Widespread topless shells, capable of supplying hot gas to the halo, are seen throughout the galaxy. The nearest example of a worm is the North Polar Spur. These maps, and subsequent 21 cm studies by Heiles and collaborators, showed that the ISM in the solar neighborhood is superbubble dominated. Over 100 expanding H I shells and superbubbles are detected, with radii1.2 kpc, masses 2107 , and expansion velocities 24 km s-1 corresponding to energies 1053 ergs (e.g. Heiles 1982). H I shells are clearly associated with star formation regions (Orion, Carina, Per OB2, Cep OB3, Sco OB3, Loop I), although only 33% of the radio-emitting supernova remnants also exhibit H I shells. H I gas in shells is significantly cooler (=35–200 K and 2 cm-3) than outside of shells, and the expanding shells associated with Radio Loop I and Eridanus are in statistical equilibrium since shell ages (2 Myrs) exceed cooling times for 2 cm-3 shell gas (0.4 Myrs). These SNRs are also a source of high-velocity gas; 15% of 100 observed radio continuum SNRs (1.5–9 kpc distant) show high velocity (70–160 km s-1) H I, probably accelerated by SNR blast waves Koo & Heiles (1991).
The pervasiveness of H I 21 cm high-latitude high velocity clouds (HVCs) raised questions about the origin of this gas, and whether the gas is infalling onto the plane, or ejected from disk supernova remnants. Additionally, warped spiral arms in the outer galaxy are seen at high velocities, leading to the definition that generally gas must deviate by 50 km s-1 from predicted Galactic rotation velocities to be considered a HVC. Several excellent reviews discuss HVCs (e.g. Verschuur 1975, York 1982, Wakker & van Woerden 1997, Savage 1995). More recently, an extragalactic origin for HVCs from gas falling onto the Local Group has been proposed Blitz et al. (1999). High and intermediate velocity clouds are grouped into complexes tens of degrees across on the sky, with predominantly negative velocities at high latitudes. Up to 37% of the sky is covered with H I gas with 100 km s-1. Up to 18% of the sky is covered with HVC’s with 100 km s-1 and log18.30 cm-2. Low column density HVCs (17.5–18.4 cm-2) tend to surround higher column density HVCs (18.4 cm-2), and occupy about 19% of the sky. Up to 10% of the mass of H I in the Galaxy may be in HVC’s, and several HVC’s have bulk energy comparable to that of supernova. (e.g. Verschuur 1975, York 1982, Wakker & van Woerden 1997, Savage 1995).
A new class of tiny dense H I clouds were discovered at Berkeley using VLBI techniques Dieter et al. (1976), but acceptance of this discovery was delayed for years because it challenged the two-component model of the ISM. The search for H I clumps was motivated by the discovery of tiny (10-2 AU) regions of ionized gas inferred from pulsar scintillation data (e.g. Rickett & Lang 1973, Cordes et al. 1988). Observations of 3C 147 showed absorption variations on scales of 0.1”. This discovery was later confirmed using VLBI techniques Diamond et al. (1989), and measurements of time-variable 21 cm absorption line in six transversely moving pulsars Frail et al. (1994). Over 20% of cold H I is located in small dense clumps with scale sizes 5–100 AU and densities 105 cm-3. The ‘tiny-scale atomic structures’ (TSAS) are a ubiquitous feature of ordinary cold clouds, and are consistent with a composite picture of cold TSAS clouds (15 K, or H0.5 km s-1 in the absence of turbulence) interspersed with warmer and less dense ‘inter-TSAS’ gas. The TSAS structures occupy only a few percent of the CNM cloud volume, but contribute 10% of the column density if they have a sheet-like configuration, or 30% if they have a filamentary configuration Heiles (1997). Absorption lines have been seen to vary in strength between both members of a binary system, and towards the same star observed at multiyear intervals (e.g. Lauroesch et al. 2000). These variations imply structure in the ISM on scale sizes of 101103 AU.
4.2 High-Resolution Optical Data
The transition from photographic plates to photon-counting spectrometers (based on Digicon and CCD technology) occurred during the 1970’s, allowing high-resolution (0.5 km s-1), high signal-to-noise (1 mÅ) absorption line studies. Although only a few species are observed optically, ultra-high spectral resolution optical data provide a useful template for the component structure and depletion patterns in lower resolution UV data. Early surveys by Hobbs and his students provided the first information about the distributions of Ca II, Ca I, Ti II, Na I, K I, and Li I, and the physical properties of the gas giving rise to these lines. Recent surveys benefit from ultrahigh spectral resolutions, high signal-to-noise, and good quantitative analysis tools.
The saturated Na I D lines and the crowding of components in velocity space inspired observations of the weak Na I UV 3302 Å doublet which fall on the linear portion of the COG. The mean widths for the 3302 Å and strong D-line doublets are =0.9 km s-1 and 1.5 km s-1 Crutcher (1975), indicating that the weaker features reveal cloud cores, while the D-lines trace more extended regions. After correction for ionization effects, sodium was found to be depleted by a factor of 4–5. During the last decade of the 20th century, a series of high-resolution (0.3–1 km s-1) surveys of optical absorption lines have provided a detailed look at the crowding of cloud components in velocity space. A high-resolution study of the Na I D1 line towards 38 stars found 276 absorption components (Welty et al. 1994, WHK). WHK developed a method of fitting complex absorption lines with individual cloud components characterized by component column density (), velocity (), and velocity dispersion (2=2k/+22). The Na I components have median values =0.73 km s-1 and log(Na I)=11.09 cm-2, and a median separation between adjacent components of 2.0 km s-1. Weaker Na I components exhibit a broader velocity distribution than stronger components, displaced somewhat to negative velocities. The correlation between (H I and (Na I) decreases in quality for (Na I)1011 cm-2. For internal cloud temperatures of 80 K, 38% components have subsonic internal turbulence for assumed Gaussian profiles for individual clouds. WHK showed that component separations for Na I are consistent with a Poisson distribution (Figure 5), and that for this distribution only 60% of the true total number of cloud components are being detected (given detection limits). Similar results were found later for the distribution of Ca II and K I components.
The alkali element Li is observed optically. A survey of the Li I weak 6708 Å (IP=5.4 eV) towards 22 stars found seven positive detections at the 0.3–3 mÅ level (e.g. White 1986). The depletions of Li, C, Na, and K are correlated, and log –0.25 dex in cold clouds (Figure 4). Recently, the relative isotope ratio 7Li I/6Li I has been observed as a test of light element formation. The 7Li I/6Li I ratio appears to be variable, and for at least one sightline ( Per) cosmic ray spallation appears significant.
In cold clouds Ca II is heavily depleted onto grains, and Ca II is the dominant ionization state, while in warm gas Ca is only moderately depleted but Ca III is the dominant ionization state (see Figure 1). The ratio (Ca II)/(Ca I) in individual velocity components yields =0.055–0.57 cm-3, independent of abundance uncertainties (e.g. White 1973). If photoionization of trace elements is the sole source of electrons, densities 500–5,000 cm-3 are implied. However, H may be partially ionized. Intercloud medium sightlines also show reduced line strengths of Na I (factor of 5) in comparison to sightlines containing clouds. High-spectral resolution (0.3–1.2 km s-1) observations of the Ca II K line provide a component-to-component sample of the relative properties of the Na I and Ca II profiles (Welty et al. 1996, WMH). WMH found similar mean LSR velocities for Ca II and Na I (–1.7 km s-1, –0.7 km s-1), but larger velocity dispersions for Ca II (12.3 km s-1 vs. 8.6 km s-1). The median Ca II column density is 5 1010 cm-2, and the median line width is =1.31 km s-1 corresponding to 4,100 K. Based on line widths, less than 35% of the Ca II components originate in warm gas (6,000–8,000 K). If 500 K, most components have subsonic internal cloud turbulent velocities. Inside of the same cloud, Ca II is distributed over a broader spatial region than Na I, as shown by for Ca II and Na I (median values 0.84 and 0.65 km s-1 respectively). The ratio (Na I)/(Ca II) correlates with Na I (with an offset at larger column densities where Ca II is the dominate ionization state of Ca). Exceptions are sightlines showing the Routly-Spitzer effect, e.g. Oph. Along low-density sightlines, up to 10% of the total mass in gaseous Ca II is at 10 km s-1.
The component structure of K I may provide an important clue to tiny cold clouds since potassium is not subject to large depletion variations Hobbs (1974). Hobbs found that (Na I), (K I), , and (H I (from Ly data) are mutually correlated to within a factor of two, but (Ca II) did not correlate with any of these other quantities. Na I and K I show a quadratic dependence on (H): ((Na I)(H)2.3, (K I)(H)2.0) indicating that / is constant in the cloud and N2 for photoionization. The differential distribution of K I cloud column densities (()) follows a power law, ((K I))(K I)-3/2, giving ((H))(H)-2. About 4.6 K I clouds kpc-1 are seen. A recent high-resolution survey (0.4–1.9 km s-1) of K I, with 2 detection limits of (K I)1.4 109 cm-2, provides the most complete available sample of cold (80 K) diffuse clouds. Observations of 54 stars yielded 319 components Welty & Hobbs (2001), with the mean component velocity =1.7 km s-1 and dispersion =7.5 km s-1. Comparisons between K I and other species revealed important trends. (Na I) and (K I) show a linear relationship, with similar median values (0.67 km s-1 and 0.73 km s-1 respectively). However, Ca II is formed over a larger velocity interval than Na I or K I, since both the dispersion in bulk velocities, and line broadening, are larger for Ca II components than for Na I and K I components. The linear relationship between (K I) and (CH I) and similar profiles suggest these species are closely associated in dense clouds. (K I) and ()+2() are well correlated. Median and maximum values for (K I) are 4 1010 cm-2 and 1012 cm-2, respectively, which convert to column densities (H)=2 1020 cm-2 and 1021 cm-2, respectively, the observed (K I)–(H) correlation. For 80 K, 35–50% of the components are found to have subsonic turbulence. The K I components are strongly crowded in velocity since 85% percent of the component separations (between two adjacent components) are 3 km s-1 (Welty & Hobbs 2001, and Figure 5). Few sightlines are dominated by a single cloud.
The ion Ti II is unique among optically visible species because it is the dominant ionization state for Ti in diffuse clouds (IP13.6 eV). However, Ti has highly variable depletions in the ISM (Figure 1). The Ti II weak 3384 Å line was surveyed towards 68 stars by Stokes (1978). Titanium depletions vary by two orders of magnitude in the solar neighborhood, with mean value Ti–2 dex. Comparisons between and other species show that Ti and Ca correlate more tightly with each other than other species (e.g. Na I, K I, (H)).

The abundance properties of halo ISM were characteristized by a series of studies of Ca II and Na I towards faint blue Feige stars near the Galactic poles Cohen & Meloy (1975). Large (Ca II)/(Na I) ratios in halo gas indicate intercloud type gas. Halo gas velocities are skewed to the negative, and the infall requires the replenishment of halo gas on timescales years. Observations of halo stars found that Ti II is pervasive in the Galactic halo, and Ti abundances increase with increasing Albert (1983). Albert concluded that two types of gas contributed to the Ti II features: a thick low-velocity disk component (200 pc), and a second high-velocity weakly depleted gas at high and constituting 24% of the halo mass. Low velocity gas shows Ti abundances 3% solar, while for 10 km s-1 abundances average 6% solar. An extreme value is seen towards HD 123884, at =8.7 kpc, where the Ti abundance is 75% solar. The relations between and for Ti II, Ca II, Fe II, H I, and show that the Ti II and Ca II gas is smoothly distributed and extends to greater heights than other components, with scale heights 2 kpc, 1 kpc, 0.5 kpc, 0.3 kpc, and 0.1 kpc, respectively, for an exponential distribution (Table 1, Edgar & Savage 1989).
Time-variable interstellar Ca II and Na I absorption lines have been detected towards sources in the Vela region (e.g. Hobbs et al. 1991). These variable lines are characterized by extremely large widths (100 km s-1) and ratios (Ca II)/(Na I) (1.4 to over 56). Variations are seen on timescales of 7 years towards HD 72127A, located near a bright filament in the Vela supernova remnant.
The velocity of the shocked interstellar gas towards Oph, compared to the velocity of ISM inside of the solar system led to the conjecture that Loop I drives a flow of interstellar material past the Sun Frisch (1981). A series of papers modeling the kinematics of nearby ISM with a linear flow find different flow vectors, depending on the star sample (e.g. Crutcher 1982, Lallement et al. 1986, Vallerga et al. 1993, Frisch 1995). Crawford found that 79% of the components towards a set of stars in Sco-Cen have negative LSR velocities consistent with a shell expanding at 9 km s-1 around the Upper Centaurus-Lupus subgroup of the Sco-Cen Association Crawford (1991). Although the nearest optical absorption lines show velocities generally consistent with the cloud velocity inferred from observations of Ly and He II 584 Å backscattered radiation, nearby stars often show more than one absorption component (e.g., Aql at 5 pc, Ferlet 1999) and there is a distribution of component velocities about the central flow velocity. The heliocentric velocity vector for the cloud surrounding the solar system (–25.3 km s-1 from the direction =4o, =+16o, ) corresponds to an LSR vector of –15 km s-1 approaching from 346o, –1o (using Hipparcos solar apex motion). Typical line broadening for Ca II K lines towards nearby stars (2.2 km s-1) are consistent with 7,000 K and 1 km s-1 Crawford et al. (1998). However, several nearby stars ( Pav, Vel, Cyg) have narrow lines, 1 km s-1 indicating cold clouds (600 K) within 24–50 pc of the Sun.
4.3 Warm Ionized Material
Classic H II regions surrounding young massive stars in stellar associations delineate the spiral arm structure of the Milky Way Galaxy Georgelin & Georgelin (1976). However, pulsar data and diffuse optical recombination lines show that diffuse warm low density interstellar plasma is widespread.
A comparisons of pulsar dispersion and rotation measures, for pulsars with an independent distance estimate, showed that the layer of free electrons in our Galaxy has a mean density 0.025 cm-3 and scale height 0.9 kpc (e.g. Falgarone & Lequeux 1973). Taylor and Cordes (1993) produced a model for the distribution of free electrons in our Galaxy which allowed for a non-uniform distribution of plasma imposed by spiral arm structure and other large scale variations in the ISM. Several regions of enhanced diffuse are seen, including towards the Gum Nebula (240o270o) and the Sagittarius arm (330o30o). This model provides a means to estimate pulsar distances from dispersion measures Taylor & Cordes (1993).
The mapping of diffuse (0.1 cm-3) interstellar H in our Galaxy is largely the result of work by Ron Reynolds and collaborators, who use large throughput high spectral resolution Fabry-Periot techniques to show that faint H and and forbidden optical emission lines closely follow the velocity distribution of H I 21 cm emission visible in spiral arms Reynolds (1995). The discovery of pulsars in globular clusters allowed the comparison of pulsar dispersion measures with emission measures. Reynolds obtained a midplane density 0.08 cm-3, for =7,000 K plasma which fills 20% of a 2 kpc thick layer in the Galactic plane (known as the ‘Reynolds Layer’). Most of the H luminosity in the ISM arises in traditional H II regions surrounding hot stars, however most of the interstellar H II mass (90%) is associated with a diffuse extensive warm (8,000 K), low density ( 0.1 cm-3) component. Diffuse H II differs from classic H II regions by large [Si II]6716/H and small [O III]5007/H ratios. The line widths of the metastable lines suggest 8,000 K, while the absence of N I indicates the underlying material is ionized (/0.75). The spectrum of the ionizing source is constrained to be softer than an O-star spectrum by the failure to detect He I 5876 recombination, which indicates that He is mainly neutral (/0.27) in the ionized WIM.
The local Galactic magnetic field has been mapped using the Faraday rotation of pulsar signals, since / provides weighted by the electron density Rand & Kulkarni (1989). Data from 200 pulsars show that RM’s which sample the North Polar Spur region are dominated by this feature. When the North Polar Spur contributions are removed from the sample, a local magnetic field of 1.60.3 G, directed towards =96o4o, is obtained. The Galactic field reverses towards the inner Galaxy at =60080 pc. Rand and Kulkarni detected a contribution from random magnetic fields, 5 G, and cell length 55 pc, which they attributed to fields in unresolved shell structures.
Ionized rims are found on over 10% of interstellar clouds Reynolds et al. (1995). The distribution of WIM which produces diffuse H emission correlates strongly with H I 21 cm clouds: 30% of the diffuse H and 10–30% of 21 cm emission occur in clouds with similar spatial distribution and kinematics, although H and 21 cm emission are spatially separated as expected for cloud rims. The clouds with rims typically are low density (=0.2–0.3 cm-3), and have (H I=2–20x1019 cm-2 and EM=2–10 cm-6 pc. The scale heights for clouds with ionized rims (=0.1–1 kpc) exceeds the scale heights of cold H I (100 pc, Table 1).
5 The Galactic Halo
5.1 Highly Ionized Gas
The most significant contribution of IUE to ISM studies was the discovery and mapping of highly ionized gas towards faint stars in the Galactic halo and beyond. The C IV 1550 Å and Si IV 1402 Å resonance doublets were detected towards UV bright O and Wolf-Rayet stars (V=9–12 mag) in the Large and Small Magellanic Clouds Savage & de Boer (1981), and 24 faint high latitude (1 kpc) luminous OB stars in the Galactic halo Pettini & West (1982). Hot halo gas extends 10–15 kpc below the Galactic plane towards the LMC and SMC, and to velocities 150 km s-1 and 50 km s-1 in the respective directions. Halo gas appears to share the rotation pattern of the underlying disk gas. The interstellar origin of high- hot gas was firmly established by a survey of over 40 faint (2 kpc) disk and halo B stars which were selected to have no obvious association with circumstellar nebulosity Savage & Massa (1987). Scale heights, , for the highly ionized species were found to be significantly larger than for neutral and weakly ionized species (Table 1, although recent evidence for a patchy halo confuses the question). The unambiguous detection of diffuse halo N V was first made towards halo stars in the inner Galaxy (=0.7–2.2 kpc, 6 kpc). Savage and Massa found line strengths of N V, C IV, Si IV an order of magnitude larger than expected for a photoionized halo (e.g. Savage & Massa 1987).
A series of HST studies of halo gas, by Blair Savage, Ken Sembach, and collaborators, showed that two types of highly ionized halo gas are present (e.g. Savage & Sembach 1996). In Type I hot gas, (Si IV):(C IV):(N V)1.0:3.0:0.5 and the narrow Si IV and C IV components are kinematically associated with low-ionization species, possibly originating in interface regions between warm and hot gas. C IV is found together with both the sharp Si IV and broad N V lines. In Type II gas, minimal Si IV is seen, with few low ions, and (C IV)/(N V)1–3. The broad N V features are produced by a widely distributed component, possibly from cooling hot gas in supernova bubbles or Galactic fountains.
A classic paper by Savage et al. (1997) combined observations of extragalactic objects (QSOs and Seyfert galaxies) and 15 halo stars to probe the full extent of HIM in the halo. The derived exponential scale heights showed that high ions extend a factor of 10 further from the plane than H I (Table 1). Ionization process must vary with , since the ratios (C IV)/(N V) and (Si IV)/(N V) are enhanced at mid- distances by a factor of 2, compared to lower and higher values. C IV and Si IV correlate well, and both correlate poorly with N V. Halo HIM corotates with disk gas out to 5 kpc for 5 kpc. HIM halo gas shows typical net inflow velocities of 20 km s-1, which is about twice that of neutral gas. The turbulent broadening of C IV (60 km s-1) is inadequate by factors of 3 to support halo gas, indicating that additional pressure sources such as the Galactic magnetic field or cosmic rays are required.
Observations of Al III, Si IV, C IV, and N V showed that profiles of Al III, a tracer of photoionized gas, are generally narrower than those of Si IV, C IV, and N V in halo gas (e.g., Sembach & Savage 1992). The ‘apparent optical depth technique’ was used to derive information on unresolved components or saturation in the IUE profiles. Highly ionized gas extends to greater distances from the Galactic plane than Al III, which has a scale height comparable to the Reynolds layer thickness (1 kpc). N V absorption was detected in 80% of the sightlines, indicating pervasive 2 105 K collisionally ionized gas in the galactic halo. These relatively low resolution IUE data (25 km s-1) show relatively constant mean ratios of (C IV)/(Si IV)=3.61.3 and (C IV)/(N V)=4.62.7.
Neither IUE nor HST could observe O VI. The far UV spectrometer on an ORFEUS-SPA mission observed O VI towards Galactic and extragalactic sightlines and found O VI to be significantly more confined to the plane than Si IV, C IV, or N V Hurwitz & Bowyer (1996). The North Polar Spur region (Loop I and Loop IV) are sources of enhanced coronal gas, supplying hot gas to the Galactic halo. Variations in the O VI/N V ratio reveals the non-uniform distribution of high latitude coronal gas. A small O VI excess was tentatively identified towards two stars located behind an intermediate negative velocity cloud (=45–70 km s-1) identified by Danly (1992). Relative line strengths are consistent with either collisionally ionized gas in a Galactic fountain, or composite mixture of conductive interfaces and turbulent mixing layers. Recently, FUSE has confirmed many of the overall characteristics of halo O VI found by ORFEUS-SPA. FUSE observations of O VI towards 11 AGN’s confirm that O VI is more concentrated towards the Galactic plane than Si IV, C IV, or N V, and that the scale height of high ions decreases with increasing ionization (Savage et al. 2000, e.g. see Table 1). (C IV)/(O VI) ranges from 0.15 in the disk to 0.6 in the halo. Variations in the -component of (O VI) (factor 2.5) confirm that O VI halo gas is highly patchy. HST observations of C IV towards Col combined with observations of O VI show these features occur at the same velocity, but O VI is twice as broad as C IV Brandt et al. (1999). The ratio (C IV)/(O VI)=0.110.1, and is typical of hot disk material.
Production models for highly ionized halo gas are still uncertain Spitzer (1996). Possible origins include conductively heated interfaces, radiative cooling, or turbulent mixing layers. The conductive heating models require contact between cooler material and hot plasma (106 K gas), such as found inside supernova remnants or stellar wind bubbles. A representative radiative cooling model would be a Galactic fountain, with the infall of cooling plasma onto the Galactic plane. The turbulent mixing layer model mixes hot and cold gas in a turbulent shear flow of hot gas past cold clouds. Conductive heating models reproduce (C IV)/(O VI)0.15 found at low , but are unsuccessful at high . Smaller scale heights for more highly ionized gas suggest an origin for O VI connected to disk supernova remnants Savage (1995).
5.2 Abundances in Halo Gas
When Supernova 1987A (SN1987A) exploded in the LMC, it was quickly observed as a target-of-opportunity by IUE and provided a brief brilliant opportunity to observe halo gas using a 4.5 mag background source with a featureless continuum (e.g. Blades et al. 1988, Welty et al. 1999). Intermediate velocity halo gas (5690 km s-1) was seen to be a mixture of warm and cool gas, with virtually no depletion of the refractory elements Si, Cr, Mn, Fe, Ni and Fe relative to Zn. The high velocity halo gas (109140 km s-1) showed typical abundance characteristic of warm partially ionized halo gas (4500 K).
A series of HST studies of the ISM towards halo stars by Spitzer, Savage, Fitzpatrick, Sembach, and others show that depletion patterns in halo and disk are similar, except that the least depleted sightlines generally are towards halo stars. Zn depletions in individual clouds towards halo stars range from dex for 0.1 cm-3 for 50 km s-1 Fitzpatrick (1996). Both warm disk and halo clouds typically show solar abundances of S and at least one IVC (the –70 km s-1 component towards HD 93521) shows supersolar abundances for S (perhaps from partial H ionization Savage & Sembach 1996, Fitzpatrick 1996, Howk et al. 1999). Typically 10–30 cloud components are seen towards halo stars. In low velocity clouds (20–25 km s-1) there is a clear positive correlation between gas phase abundances and increasing cloud velocity for refractories (Si, Fe, Cr, Mn, Ti). The strongest variations are found for Fe (1.5 dex) and the smallest variations for Si (0.5 dex). Below 20 km s-1, the gas-phase abundances of refractory elements (Fe, Mn, Ni, Si, and Cr) generally increase with velocity, while above that value depletions tend not to vary with velocity. Fe and Si depletions correlate strongly for both disk and halo stars, with maximum abundances in disk and halo clouds corresponding to –0.5 dex, and –0.15 dex (with respect to S, Fitzpatrick 1996, Savage & Sembach 1996). For 0.1 cm-3, Cr/Zn–1.4 dex and is density independent for disk stars. For 0.1 cm-3, Cr depletions are in the range log –1.6 to –0.8 dex (with respect to H). Warm halo gas components towards HD 116852 (=4.8 pc, =–1.3 kpc) show that gas-phase abundances increase with , and line broadening (velocity dispersion) and ion scale heights increase as the ionization of the gas increases Sembach & Savage (1996).

| Component1 | Mid-Plane | 2 | Method3 | Reference | |
|---|---|---|---|---|---|
| Density | |||||
| (cm-3) | (kpc) | ||||
| H2 | 0.14 | 0.07 | UV | Savage et al. (1977) | |
| H I | CNM | 0.70 | 0.07 | UV | Bohlin et al. (1978) |
| WNM | 0.16 | 0.36 | UV | Diplas and Savage (1994) | |
| H I | CNM | 0.39 | 0.11g | 21 cm | Dickey and Lockman (1990) |
| WNM | 0.11 | 0.25g | 21 cm | Dickey and Lockman (1990) | |
| WNM | 0.06 | 0.40 | 21 cm | Dickey and Lockman (1990) | |
| H II | WIM | 0.014 | 0.07 | DM | Reynolds (1995) |
| WIM | 0.024 | 0.9 | DM | Reynolds (1995) | |
| Fe II | 0.5 | UV | Edgar and Savage (1989) | ||
| Al III | WIM | 1.0 | UV | Savage et al. (1990) | |
| Ca II4 | 1 | Opt. | Edgar and Savage (1989) | ||
| Ti II4 | 2 | Opt. | Edgar and Savage (1989) | ||
| O VI | HIM | 2.0 10-8 | 2.70.4 | UV | Savage et al. (2000) |
| N V | HIM | 2.0 10-9 | 3.91.4 | UV | Savage et al. (1997) |
| C IV | HIM | 9.2 10-9 | 4.40.6 | UV | Savage et al. (1997) |
| Si IV | HIM | 2.3 10-9 | 5.10.7 | UV | Savage et al (1997) |
Notes: 1. CNM, WNM, WIM, and HIM are cold neutral, warm neutral, warm ionized, and hot ionized material, respectively. 2. Based on Savage (1995). The scale height is defined by the density distribution as a function of distance to the galactic plane, , and generally is described by an exponential distribution: ()=(0)exp(–/) cm-3, where (0) is the midplane density and is the scale height. Distributions labeled by ‘g’ are Gaussian: ()=(0)exp(–/)2/2. 3. Methods are: UV = ultraviolet absorption lines; 21 cm = H I hyperfine line; DM = pulsar dispersion measures; Opt. = optical absorption lines. 4. Enhanced abundances of Ca II and Ti II in the WNM yield smoother distributions than for the CNM.
5.3 Warm Neutral and Ionized Gas
Comparisons between IUE observations of low and high ions and H I 21 cm data, show halo kinematics, and constrain cloud distances (e.g., Danly 1992). The low halo (1 kpc) contains approximately equal numbers of negative and positive velocity components, while the distant halo has a preponderance of infalling gas. In the Northern Hemisphere, low ion (e.g. Si II) lines have component velocities of up to 120 km s-1. Intermediate velocity gas (40 km s-1) is formed at 1 kpc, and has an excess of negative velocity components. Low velocity gas (40 km s-1), with an equal number of positive and negative components, tends to be closer to the Galactic plane (1). HST observations of halo stars, which typically sample long sightlines devoid of dense cold clouds, provide some of the best data on warm gas. HST found that up to 30 or more absorption components may be seen towards halo stars with 2 kpc, extending over large velocity intervals (100 km s-1). Such sightlines sample both disk and halo gas.
Towards HD 100340, nine regions of intermediate velocity ( km s-1) partially ionized gas are seen, with column densities in the range log=18.38–19.36 cm-2. H I 21 cm data show these clouds are warm neutral gas, 7,000 K (from the FWHM values). Typical densities are =0.022–0.10 cm-3. Towards HD 93521 four low velocity components (20 km s-1) show 0.11 km s-1, while intermediate velocity gas (25 km s-1) have 0.04 km s-1, based on C II∗/C II (see Fitzpatrick 1996, for references). The 30 components seen towards HD 215733 (=1.7 kpc) show temperatures 300 K1000 K and electron densities =0.02 to 0.06 cm-3.
In individual warm disk and halo clouds, high and low ionization levels are commonly associated with each other. For example, towards HD 215733 Si IV and C IV lines are at the velocities of three warm clouds, although line widths indicate hot temperatures (=6 105 K and 5 104 K, respectively). The neutral weakly ionized IV (+70 km s-1) cloud towards HD 20366 is warm (5,300-6,100 K) with =0.15-0.34 cm-3, however highly ionized gas with (C IV)/(Si IV)4.5 is present suggesting collisionally ionized cloud interfaces with 105 K (e.g., Sembach 1995).
Observations in a number of warm clouds towards halo stars (e.g. HD 215733, HD 154368) show that different diagnostics for in the same cloud yield discrepant results (as also seen for cold clouds, Section 3.6). The ionization equilibrium of C I, Mg I, S I, and Ca II give log differing by up to one dex, with generally (Mg I)(C I), when the temperature dependence of Mg II and C II recombination rates are assumed similar. These differences are consistent with the trace neutral status of C I and Mg I in cool gas, and enhanced Mg I in warm gas (5,000 K) from dielectronic recombination. In addition, Ca II and Ti II (Section 4.2) are distributed relatively smoothly in the halo, and Ti II extends to 2 kpc. Electron densities based on (Ca II) vary smoothly in comparison to derived from either (Na I) or /, which generally sample cloudy regions Cardelli et al. (1995).
Systematic variations in cloud electron densities as a function of velocity have been detected towards stars in the low and high halo. The stars Col and HD 93521, for example, show electron densities which decrease with increasing cloud velocity (e.g., Spitzer & Fitzpatrick 1993). Component values found from both C II∗/C II and Ca II show a clear decrease with increasing towards HD 93521. A spread in values of 0.020.05 cm-3 is found for 70 km s-1. Five warm neutral velocity components are seen towards Col (–29 +41 km s-1 Howk et al. 1999). Warm intermediate velocity gas (+31,+41 km s-1, =4000700 K) is low column density (log=17.3–17.8 cm-2). Electron densities in component 4, for example, are =0.470.14 cm-3 (using /) and =0.640.14 cm-3 (using C II and /).
UV Ly data provide the distribution of H I, but generally do not distinguish between cold and warm gas (in contrast to H I 21 cm data where both absorption and emission data are available). H I scale heights were determined from IUE observations of 393 stars (=0.12–11 kpc, 4 kpc) which are free of stellar Ly contamination Diplas & Savage (1994). Selecting sightlines which avoided obvious clouds yielded scale height =195 pc, and an overall value =0.23 atoms cm-3 (range 0.017–8.62 atoms cm-3). Color excess data indicate that dust is patchier than the gas, with dust scale height =152 pc and midplane value /=0.257 mag kpc-1. Assuming, rather, a two-component exponential model to accommodate gas clumping around the plane gives for the compact component ,1(0)=0.247 cm-3, 1=73 pc, and for the extended component ,2(0)=0.16 cm-3, 2=357 pc. These scale heights are comparable to 21 cm results despite different underlying assumptions and sightline lengths. Denser clouds show a larger ratio of (H I/ than towards interarm sightlines, possibly indicating grain modification in dense clouds. Savage (1995) finds that 82% of the halo interstellar mass is contributed by neutral gas (both the confined and extended components). An extended component of warm ionized gas provides 15% of the mass, while the extended hot component contributes 3% of the halo ISM mass.
6 Closing Comments
What does the 21st century hold for ISM studies? Opening up the UV window on our Galaxy initiated the golden age of space astronomy, and revealed 30–40% of the Galactic mass previously invisible. Will the retirement of HST shutter this window? The 21st century may see the first in situ measurements of the interstellar cloud surrounding the solar system Liewer et al. (2000). When we leave our heliosphere and explore interstellar space we will become citizens of the Milky Way Galaxy. However many problems are solvable with earth-orbiting spacecraft. The next instrumental advance for UV astronomy will be to launch an ultrahigh resolution UV space spectrometer (912–3000 Å) with a large dynamic range (V=1–12 magnitudes) to reveal the physics of cloudlets in the disk and halo.
What are the questions of the future?
-
1.
Where will the solar journey take us, and what are the past and future Galactic environments of the Sun?
-
2.
Is the ISM one grand, turbulent, gravitationally-layered continuum, with locally variable properties sculpted by spiral density waves which initiated epochs of star-formation?
-
3.
Will better data on Galactic halo gas unlock the mysteries of chemical evolution in our Galaxy?
-
4.
Is the ISM composition homogeneous? Is Seaton’s postulate that dust grains contain the atoms missing from the ISM gas phase correct?
-
5.
Where does halo ISM originate?
-
6.
Are molecular clouds an ISM reservoir replenishing diffuse gas?
-
7.
What is the answer to Parker’s question: “What is an interstellar cloud”? Are turbulence, cloud interface regions, and expanding superbubble shells relevant for the answer to this question?
Finally, we return to Harlow Shapley’s idea. Are encounters with interstellar clouds important for evaluating the historical climate of the Earth, and by extrapolation climate stability for extra-solar planets?
The author would like to thank Dan Welty for providing many of the figures in this paper, and both Dan Welty and Don York for numerous informative scientific discussions. This research has been supported by NASA grants NAG5-6405 and NAG5-7077. This paper is appearing in , Eds. J. Bleeker, J. Geiss, and M. C. E. Huber, Kluwer Academic Publishers, 2001.
References
- Adams & Frisch (1977) Adams, T. F. and Frisch, P. C. 1977. High-resolution observations of the Lyman alpha sky background. ApJ, 212, 300–308.
- Adams (1949) Adams, W. S. 1949. Observations of interstellar H and K, molecular lines, and radial velocities in the spectra of 300 O and B stars. ApJ, 109, 354–379.
- Albert (1983) Albert, C. E. 1983. Neutral interstellar gas in the lower galactic halo. ApJ, 272, 509–539.
- Baldwin (1955) Baldwin, J. E. 1955. The distribution of the galactic radio emission. MNRAS, 115, 690–700.
- Barlow et al. (1995) Barlow, M. J., Crawford, I. A., Diego, F., Dryburgh, M., Fish, A. C., Howard, I. D., Spyromilio, J., and Walker, D. D. 1995. First results from the UHRF: Ultra-high-resolution observations of atomic interstellar lines towards zeta Ophiuchi. MNRAS, 272, 333–345.
- Beals (1936) Beals, C. S. 1936. On the interpretation of interstellar lines. MNRAS, 96, 661–678.
- Berkhuijsen et al. (1971) Berkhuijsen, E. M., Haslam, C. G. T., and Salter, C. J. 1971. Are the galactic loops supernova remnants? A&A, 14, 252–262.
- Blades et al. (1988) Blades, J. C., Wheatley, J. M., Panagia, N., Grewing, M., Pettini, M., and Wamsteker, W. 1988. Abundances in intermediate-velocity clouds toward SN 1987A. ApJ, 332, L75–L79.
- Blitz et al. (1999) Blitz, L., Spergel, D. N., Teuben, P. J., Hartmann, D., and Burton, W. B. 1999. High-velocity clouds: Building blocks of the Local Group. ApJ, 514, 818–843.
- Bohlin et al. (1978) Bohlin, R. C., Savage, B. D., and Drake, J. F. 1978. A survey of interstellar H I from L-alpha absorption measurements. ApJ, 224, 132–142.
- Boksenberg et al. (1975) Boksenberg, A., Kirkham, B., Pettini, M., Bates, B., Carson, P. P. D., Dufton, P. L., and McKeith, C. D. 1975. Interstellar magnesium absorption in the direction of four unreddened stars. ApJ, 202, L91–L95.
- Brandt et al. (1999) Brandt, J. C., Heap, S. R., Beaver, E. A., Boggess, A., Carpenter, K. G., Ebbets, D. C., Hutchings, J. B., Jura, M., Leckrone, D. S., Linsky, J. L., Maran, S. P., Savage, B. D., Smith, A. M., Trafton, L. M., Walter, F. M., Weymann, R. J., Howk, J. C., Snow, M., Ake, T. B., and Sembach, K. R. 1999. Echelle spectroscopy of interstellar absorption toward mu Columbae with the Goddard High Resolution Spectrograph. Astron. J., 117, 400–409.
- Bruhweiler et al. (1980) Bruhweiler, F. C., Kondo, Y., and McCluskey, G. E. 1980. Interstellar C IV and Si IV column densities toward early-type stars. ApJ, 237, 19–25.
- Burton (1976) Burton, W. B. 1976. The morphology of hydrogen and of other tracers in the Galaxy. ARA&A, 14, 275–306.
- Burton (1988) Burton, W. B. 1988. The structure of our Galaxy derived from observations of neutral hydrogen. In Galactic and Extragalactic Radio Astronomy, pages 295–358.
- Cardelli & Meyer (1997) Cardelli, J. A. and Meyer, D. M. 1997. The abundance of interstellar krypton. ApJ, 477, L57–L70.
- Cardelli et al. (1995) Cardelli, J. A., Sembach, K. R., and Savage, B. D. 1995. Gas phase abundances and conditions along the sight line to the low-halo, inner galaxy star HD 167756. ApJ, 440, 241–253.
- Chandrasekhar & Fermi (1953) Chandrasekhar, S. and Fermi, E. 1953. Magnetic fields in spiral arms. ApJ, 118, 113–115.
- Clark (1965) Clark, B. G. 1965. An interferometer investigation of the 21-centimeter hydrogen-line absorption. ApJ, 142, 1398–1422.
- Cohen & Meloy (1975) Cohen, J. G. and Meloy, D. A. 1975. The interstellar lines of the Feige stars. ApJ, 198, 545–550.
- Colomb et al. (1980) Colomb, F. R., Poppel, W. G. L., and Heiles, C. 1980. Galactic H I at b10 deg. II. Photographic presentation of the combined southern and northern data. A&AS, 40, 47–55.
- Cordes et al. (1988) Cordes, J. M., Rickett, B. J., and Backer, D. C. 1988. Radio wave scattering in the interstellar medium; Proceedings of the AIP Conference, University of California, San Diego, CA, Jan. 18, 19, 1988. In AIP Conf. Proc. 174: Radio Wave Scattering in the Interstellar Medium.
- Cowie et al. (1981) Cowie, L. L., Hu, E. M., Taylor, W., and York, D. G. 1981. A search for expanding supershells of gas around OB associations. ApJ, 250, L25–L29.
- Cowie et al. (1979) Cowie, L. L., Jenkins, E. B., Songaila, A., and York, D. G. 1979. O VI absorption in interstellar cloud surfaces. ApJ, 232, 467–472.
- Cowie & York (1978) Cowie, L. L. and York, D. G. 1978. The velocity distribution of interstellar gas observed in strong UV absorption lines. ApJ, 223, 876–883.
- Cox & Reynolds (1987) Cox, D. P. and Reynolds, R. J. 1987. The local interstellar medium. Ann. Rev. Astron. Astrophys., 25, 303–344.
- Cox & Smith (1974) Cox, D. P. and Smith, B. W. 1974. Large-scale effects of supernova remnants on the Galaxy: Generation and maintenance of a hot network of tunnels. ApJ, 189, L105–L108.
- Crawford (1991) Crawford, I. A. 1991. High resolution observations of interstellar Na I and Ca II towards the Scorpio-Centaurus association. A&A, 247, 183–201.
- Crawford et al. (1998) Crawford, I. A., Lallement, R., and Welsh, B. Y. 1998. Additional ultra-high-resolution observations of Ca+ ions in the local interstellar medium. MNRAS, 300, 1181–1188.
- Crutcher (1975) Crutcher, R. M. 1975. Observations of interstellar Na I lines at 3302 A. ApJ, 202, 634–637.
- Crutcher (1982) Crutcher, R. M. 1982. The local interstellar medium. Astrophys. J., 254, 82–87.
- Dalgarno & McCray (1972) Dalgarno, A. and McCray, R. A. 1972. Heating and ionization of HI regions. ARA&A, 10, 375–426.
- Danly (1992) Danly, L. 1992. The ionization conditions in the Milky Way halo - Infalling gas toward the North Galactic Pole. PASP, 104, 819–823.
- Davidson & Terzian (1969) Davidson, K. and Terzian, Y. 1969. Dispersion measures of pulsars. AJ, 74, 849–854.
- Diamond et al. (1989) Diamond, P. J., Goss, W. M., Romney, J. D., Booth, R. S., Kalberla, P. M. W., and Mebold, U. 1989. The structure of the interstellar medium at the 25 au scale. ApJ, 347, 302–306.
- Dickey & Lockman (1990) Dickey, J. M. and Lockman, F. J. 1990. H I in the galaxy. ARA&A, 28, 215–261.
- Dickey et al. (1979) Dickey, J. M., Terzian, Y., and Salpeter, E. E. 1979. Interpretation of neutral hydrogen absorption. ApJ, 228, 465–474.
- Dieter et al. (1976) Dieter, N. H., Welch, W. J., and Romney, J. D. 1976. A very small interstellar neutral hydrogen cloud observed with VLBI techniques. ApJ, 206, L113–L115.
- Diplas & Savage (1994) Diplas, A. and Savage, B. D. 1994. An IUE survey of interstellar H I Ly alpha absorption. 2: Interpretations. ApJ, 427, 274–287.
- Dunham (1939) Dunham, T. 1939. Proc. Amer. Phil. Soc., 81, 277–293.
- Ebel (2000) Ebel, D. S. 2000. Variations on solar condensation: Sources of interstellar dust nuclei. J. Geophys. Res., 105, 10363–10370.
- Eddington (1926) Eddington, A. S., S. 1926. Diffuse matter in interstellar space. Proc. Roy. Soc. A., 111, 424–456.
- Edgar & Savage (1989) Edgar, R. J. and Savage, B. D. 1989. The density distribution of refractory elements away from the galactic plane. ApJ, 340, 762–774.
- Elmegreen & Efremov (1998) Elmegreen, B. G. and Efremov, Y. N. 1998. Hierarchy of interstellar and stellar sturctures and the case of the Orion star-forming region. astroph-9801071.
- Falgarone & Lequeux (1973) Falgarone, E. and Lequeux, J. 1973. A discussion of the distribution of interstellar matter close to the Sun. A&A, 25, 253–260.
- Ferlet (1999) Ferlet, R. 1999. The local interstellar medium. A&A Rev., 9, 153–169.
- Ferrara et al. (1995) Ferrara, A., McKee, C. F., Heiles, C., and Shapiro, P. R., editors 1995. The Physics of the Interstellar Medium and Intergalactic Medium.
- Field (1958) Field, G. B. 1958. Excitation of the hydrogen 21-cm line. Proceedings of the Institute Radio Engineers, 46, 240–250.
- Field (1974) Field, G. B. 1974. Interstellar abundances: Gas and dust. ApJ, 187, 453–459.
- Field et al. (1969) Field, G. B., Goldsmith, D. W., and Habing, H. J. 1969. Cosmic-ray heating of the interstellar gas. ApJ, 155, L149–L154.
- Fitzpatrick (1996) Fitzpatrick, E. L. 1996. The composition of the diffuse interstellar medium. ApJ, 473, L55–L62.
- Frail et al. (1994) Frail, D. A., Weisberg, J. M., Cordes, J. M., and Mathers, C. 1994. Probing the interstellar medium with pulsars on au scales. ApJ, 436, 144–151.
- Frisch & York (1986) Frisch, P. and York, D. G. 1986. Interstellar clouds near the Sun. In The Galaxy and the Solar System, pages 83–100. University of Arizona Press.
- Frisch (1981) Frisch, P. C. 1981. The nearby interstellar medium. Nature, 293, 377–379.
- Frisch (1993) Frisch, P. C. 1993. G-star astropauses - A test for interstellar pressure. Astrophys. J., 407, 198–206.
- Frisch (1995) Frisch, P. C. 1995. Characteristics of nearby interstellar matter. Space Sci. Rev., 72, 499–592.
- Frisch (1997) Frisch, P. C. 1997. Journey of the Sun. http://xxx.lanl.gov/, page astroph/9705231.
- Frisch et al. (1999) Frisch, P. C., Dorschner, J. M., Geiss, J., Greenberg, J. M., Grün, E., Landgraf, M., Hoppe, P., Jones, A. P., Krätschmer, W., Linde, T. J., Morfill, G. E., Reach, W., Slavin, J. D., Svestka, J., Witt, A. N., and Zank, G. P. 1999. Dust in the local interstellar wind. ApJ, 525, 492–516.
- Frisch & York (1983) Frisch, P. C. and York, D. G. 1983. Synthesis maps of ultraviolet observations of neutral interstellar gas. ApJ, 271, L59–L63.
- Gayley et al. (1997) Gayley, K. G., Zank, G. P., Pauls, H. L., Frisch, P. C., and Welty, D. E. 1997. One- versus two-shock heliosphere: Constraining models with Goddard High Resolution Spectrograph Ly-alpha spectra toward alpha Centauri. ApJ, 487, 259–270.
- Genova et al. (1990) Genova, R., Beckman, J. E., Molaro, P., and Vladilo, G. 1990. Mg II observed in the local interstellar medium - The local cloud. ApJ, 355, 150–158.
- Georgelin & Georgelin (1976) Georgelin, Y. M. and Georgelin, Y. P. 1976. The spiral structure of our Galaxy determined from H II regions. A&A, 49, 57–79.
- Hagen et al. (1955) Hagen, J. P., Lilley, A. E., and McClain, E. F. 1955. Absorption of 21-cm radiation by interstellar hydrogen. ApJ, 122, 361+.
- Harris (1988) Harris, A. W. 1988. Abundances in the diffuse interstellar medium. In A Decade of UV Astronomy with the IUE Satellite, volume 2, pages 3–9.
- Hartmann & Burton (1997) Hartmann, D. and Burton, W. B. 1997. Atlas of Galactic Neutral Hydrogen. Cambridge University Press, Cambridge.
- Hartmann (1904) Hartmann, J. 1904. Investigations on the spectrum and orbit of delta Orionis. ApJ, 19, 268–286.
- Heiles (1980) Heiles, C. 1980. Is the intercloud medium pervasive. ApJ, 235, 833–839.
- Heiles (1982) Heiles, C. 1982. Temperatures and their variation within interstellar H I structures. ApJ, 262, 135–141.
- Heiles (1989) Heiles, C. 1989. Magnetic fields, pressures, and thermally unstable gas in prominent H I shells. ApJ, 336, 808–821.
- Heiles (1997) Heiles, C. 1997. Tiny-scale atomic structure and the cold neutral medium. ApJ, 481, 193–204.
- Heiles (1998) Heiles, C. 1998. Whence the Local Bubble, Gum, Orion? GSH 238+00+09, A nearby major superbubble toward Galactic longitude 238 degrees. ApJ, 498, 689–703.
- Herbig (1968) Herbig, G. H. 1968. The interstellar line spectrum of zeta Oph. Zeitschrift Astrophysics, 68, 243–277.
- Hobbs (1965) Hobbs, L. M. 1965. High-resolution study of an interstellar line. ApJ, 142, 160–163.
- Hobbs (1969) Hobbs, L. M. 1969. The profiles of the interstellar sodium D-lines. ApJ, 157, 165–174.
- Hobbs (1974) Hobbs, L. M. 1974. Statistical properties of interstellar clouds. ApJ, 191, 395–399.
- Hobbs et al. (1991) Hobbs, L. M., Ferlet, R., Welty, D. E., and Wallerstein, G. 1991. Variable interstellar absorption toward HD 72127A. II - 1981-1988. ApJ, 378, 586–598.
- Howk et al. (1999) Howk, J. C., Savage, B. D., and Fabian, D. 1999. Abundances and physical conditions in the warm neutral medium toward mu Columbae. ApJ, 525, 253–293.
- Hoyle & Ellis (1963) Hoyle and Ellis 1963. Austr. J. Physics, 20.
- Huang et al. (1995) Huang, J., Songaila, A., Cowie, L. L., and Jenkins, E. B. 1995. Detection of hot gas in the interstellar medium. ApJ, 450, 163–178.
- Hughes et al. (1971) Hughes, M. P., Thompson, A. R., and Colvin, R. S. 1971. An absorption-line study of the Galactic neutral hydrogen at 21 centimeters wavelength. ApJS, 23, 323–370.
- Hurwitz & Bowyer (1996) Hurwitz, M. and Bowyer, S. 1996. Coronal gas in the halo. II. ORFEUS observations of Galactic halo stars. ApJ, 465, 296–311.
- Jenkins (1978) Jenkins, E. B. 1978. Coronal gas in the Galaxy. II - A statistical analysis of O VI absorptions. ApJ, 220, 107–123.
- Jenkins (1987) Jenkins, E. B. 1987. Element abundances in the interstellar atomic material. In Interstellar Processes, pages 533–559.
- Jenkins et al. (1989) Jenkins, E. B., Lees, J. F., van Dishoeck, E. F., and Wilcots, E. M. 1989. Velocities and rotational excitation of interstellar H2 toward pi Scorpii. ApJ, 343, 785–810.
- Jenkins & Shaya (1979) Jenkins, E. B. and Shaya, E. J. 1979. A survey of interstellar C I - Insights on carbon abundances, UV grain albedos, and pressures in the interstellar medium. ApJ, 231, 55–72.
- Kondo et al. (1984) Kondo, Y., Bruhweiler, F. C., and Savage, B. D. 1984. Local interstellar medium. IAU Colloquium no. 81. Technical report, NASA.
- Kondo et al. (1978) Kondo, Y., Talent, D. L., Barker, E. S., Dufour, R. J., and Modisette, J. L. 1978. On the column density of the interstellar Mg II to Sirius and other nearby stars. ApJ, 220, L97–L102.
- Koo & Heiles (1991) Koo, B. and Heiles, C. 1991. A survey of H I 21 centimeter emission lines toward supernova remnants. ApJ, 382, 204–222.
- Kulkarni & Heiles (1987) Kulkarni, S. R. and Heiles, C. 1987. The atomic component. In Interstellar Processes, pages 87–122.
- Lallement et al. (1986) Lallement, R., Vidal-Madjar, A., and Ferlet, R. 1986. Multi-component velocity structure of the local interstellar medium. Astron. Astrophys., 168, 225–236.
- Landsman et al. (1984) Landsman, W. B., Henry, R. C., Moos, H. W., and Linsky, J. L. 1984. Observations of interstellar hydrogen and deuterium toward Alpha Centauri A. ApJ, 285, 801–807.
- Lauroesch et al. (2000) Lauroesch, J. T., Meyer, D. M., and Blades, J. C. 2000. Evidence of interstellar Na I structure at scales down to 15 au in low-density gas. ApJ, 543, L43–L47.
- Liewer et al. (2000) Liewer, P. C., Mewaldt, R. A., Ayon, J. A., and Wallace, R. A. 2000. NASA’s Interstellar Probe mission. pages 911–1000.
- Linsky & Wood (1996) Linsky, J. L. and Wood, B. E. 1996. The alpha Centauri line of sight: D/H ratio, physical properties of local interstellar gas, and measurement of heated hydrogen (the ‘hydrogen wall’) near the heliopause. ApJ, 463, 254–270.
- Livingston & Lynds (1964) Livingston, W. C. and Lynds, C. R. 1964. Observations of interstellar lines with very high resolution. ApJ, 140, 818–820.
- Lucke (1978) Lucke, P. B. 1978. The distribution of color excesses and interstellar reddening material in the solar neighborhood. A&A, 64, 367–377.
- MacLow & McCray (1988) MacLow, M. and McCray, R. 1988. Superbubbles in disk galaxies. ApJ, 324, 776–785.
- McClintock et al. (1978) McClintock, W., Henry, R. C., Linsky, J. L., and Moos, H. W. 1978. Ultraviolet observations of cool stars. VII - local interstellar hydrogen and deuterium lyman-alpha. ApJ, 225, 465–481.
- McCray & Snow (1979) McCray, R. and Snow, T. P. 1979. The violent interstellar medium. ARA&A, 17, 213–240.
- McKee & Ostriker (1977) McKee, C. F. and Ostriker, J. P. 1977. A theory of the interstellar medium - Three components regulated by supernova explosions in an inhomogeneous substrate. ApJ, 218, 148–169.
- McRae Routly & Spitzer (1952) McRae Routly, P. and Spitzer, L., J. 1952. A comparison of the components in interstellar sodium and calcium. ApJ, 115, 227+.
- Menon (1958) Menon, T. K. 1958. Interstellar structure of the Orion region. I. ApJ, 127, 28–47.
- Meyer et al. (1998) Meyer, D. M., Jura, M., and Cardelli, J. A. 1998. The definitive abundance of interstellar oxygen. ApJ, 493, 222–229.
- Moos et al. (1974) Moos, H. W., Linsky, J. L., Henry, R. C., and McClintock, W. 1974. High-spectral measurements of the H I 1216 A and Mg II 2800 A emissions from Arcturus. ApJ, 188, L93–L96.
- Morton (1975) Morton, D. C. 1975. Interstellar absorption lines in the spectrum of zeta Ophiuchi. ApJ, 197, 85–115.
- Münch (1957) Münch, G. 1957. Interstellar absorption lines in distant stars. I. Northern Milky Way. ApJ, 125, 42+.
- Münch (1968) Münch, G. 1968. Interstellar Absorption Lines, volume 7 of Stars and Stellar Systems, pages 365–402.
- Munch & Unsold (1962) Munch, G. and Unsold, A. 1962. Interstellar gas near the Sun. ApJ, 135, 711–715.
- O’Dell (1999) O’Dell, C. R. 1999. Commentary on stromgren’s 1939 paper. In Abt, H. A., editor, The Astrophysical Journal: Centennial Issue, pages 321–323. The University of Chicago Press for the American Astronomical Society.
- Oort (1946) Oort, J. H. 1946. Some phenomena connected with interstellar matter (George Darwin Lecture). MNRAS, 106, 159–179.
- Paresce (1984) Paresce, F. 1984. On the distribution of interstellar matter around the sun. AJ, 89, 1022–1037.
- Pettini & West (1982) Pettini, M. and West, K. A. 1982. A study of interstellar absorption at high galactic latitudes. I - highly ionized gas. ApJ, 260, 561–578.
- Plaskett & Pearce (1930) Plaskett, J. S. and Pearce, J. A. 1930. The motions and distribution of interstellar matter. MNRAS, 90, 243–268.
- Poeppel et al. (1981) Poeppel, W. G., Olano, C. A., and Cappa de Nicolau, C. E. 1981. Neutral hydrogen related to Gould’s Belt. Revista Mexicana de Astronomia y Astrofisica, vol. 6, 6, 259–266.
- Radhakrishnan & Goss (1972) Radhakrishnan, V. and Goss, W. M. 1972. The Parkes survey of 21-centimeter absorption in discrete-source spectra. V. note on the statistics of absorbing H I concentrations in the Galactic disk. ApJS, 24, 161–166.
- Rand & Kulkarni (1989) Rand, R. J. and Kulkarni, S. R. 1989. The local Galactic magnetic field. ApJ, 343, 760–772.
- Reach et al. (1994) Reach, W. T., Koo, B. C., and Heiles, C. 1994. Atomic and molecular gas in interstellar cirrus clouds. ApJ, 429, 672–693.
- Reynolds (1995) Reynolds, R. J. 1995. Diffuse optical emission lines as probes of the interstellar and intergalactic ionizing radiation. In ASP Conf. Ser. 80: The Physics of the Interstellar Medium and Intergalactic Medium, pages 388–397.
- Reynolds et al. (1995) Reynolds, R. J., Tufte, S. L., Kung, D. T., McCullough, P. R., and Heiles, C. 1995. A comparison of diffuse ionized and neutral hydrogen away from the Galactic plane: H alpha -emitting H I clouds. ApJ, 448, 715–726.
- Rickett & Lang (1973) Rickett, B. J. and Lang, K. R. 1973. Two-station observations of the interstellar scintillation from pulsars. ApJ, 185, 945–950.
- Rogerson & York (1973) Rogerson, J. B. and York, D. G. 1973. Interstellar deuterium abundance in the direction of beta Centauri. ApJ, 186, L95–L98.
- Rogerson et al. (1973) Rogerson, J. B., York, D. G., Drake, J. F., Jenkins, E. B., Morton, D. C., and Spitzer, L. 1973. Spectrophotometric results from the Copernicus satellite. III. Ionization and composition of the intercloud medium. ApJ, 181, L110–L114.
- Savage (1995) Savage, B. D. 1995. The gaseous Galactic corona. In ASP Conf. Ser. 80: The Physics of the Interstellar Medium and Intergalactic Medium, pages 233–250.
- Savage & Bohlin (1979) Savage, B. D. and Bohlin, R. C. 1979. The depletion of interstellar gaseous iron. ApJ, 229, 136–146.
- Savage et al. (1992) Savage, B. D., Cardelli, J. A., and Sofia, U. J. 1992. Ultraviolet observations of the gas phase abundances in the diffuse clouds toward zeta Ophiuchi at 3.5 kilometers per second resolution. ApJ, 401, 706–723.
- Savage & de Boer (1981) Savage, B. D. and de Boer, K. S. 1981. Ultraviolet absorption by interstellar gas at large distances from the galactic plane. ApJ, 243, 460–484.
- Savage & Massa (1987) Savage, B. D. and Massa, D. 1987. Highly ionized interstellar gas located in the Galactic disk and halo. ApJ, 314, 380–396.
- Savage & Sembach (1996) Savage, B. D. and Sembach, K. R. 1996. Interstellar abundances from absorption-line observations with the Hubble Space Telescope. Ann. Rev. Astron. Astrophys., 34, 279–330.
- Savage et al. (1994) Savage, B. D., Sembach, K. R., and Cardelli, J. A. 1994. Highly ionized gas absorption in the disk and halo toward HD 167756 at 3.5 kilometers per second resolution. ApJ, 420, 183–196.
- Savage et al. (2000) Savage, B. D., Sembach, K. R., Jenkins, E. B., Shull, J. M., York, D. G., Sonneborn, G., Moos, H. W., Friedman, S. D., Green, J. C., Oegerle, W. R., Blair, W. P., Kruk, J. W., and Murphy, E. M. 2000. Far Ultraviolet Spectroscopic Explorer observations of O VI absorption in the Galactic halo. ApJ, 538, L27–L30.
- Savage et al. (1997) Savage, B. D., Sembach, K. R., and Lu, L. 1997. Absorption by highly ionized interstellar gas along extragalactic and Galactic sight lines. AJ, 113, 2158–2185.
- Scalo (1999) Scalo, J. 1999. Chandrasekhar and Munch’s models of fluctuations in brightness of the Milky Way. ApJ, 525, C476–+.
- Seaton (1951) Seaton, M. J. 1951. The chemical composition of the interstellar gas. MNRAS, 111, 368–376.
- Sembach (1995) Sembach, K. R. 1995. Properties of the +70 kilometers per second cloud toward HD 203664. ApJ, 445, 314–324.
- Sembach & Savage (1992) Sembach, K. R. and Savage, B. D. 1992. Observations of highly ionized gas in the Galactic halo. ApJS, 83, 147–201.
- Sembach & Savage (1996) Sembach, K. R. and Savage, B. D. 1996. The gas and dust abundances of diffuse halo clouds in the Milky Way. ApJ, 457, 211–227.
- Sembach et al. (1997) Sembach, K. R., Savage, B. D., and Tripp, T. M. 1997. High-resolution ultraviolet observations of the highly ionized interstellar gas toward Radio Loops I and IV. ApJ, 480, 216–234.
- Shapiro & Field (1976) Shapiro, P. R. and Field, G. B. 1976. Consequences of a new hot component of the interstellar medium. ApJ, 205, 762–765.
- Shapley (1921) Shapley, H. 1921. Note on a possible factor in changes of geological climate. J. Geology, 29.
- Shklovsky (1960) Shklovsky, I. S. 1960. Cosmic Radio Waves. Harvard University Press, Cambridge:MA.
- Shull & Beckwith (1982) Shull, J. M. and Beckwith, S. 1982. Interstellar molecular hydrogen. Ann. Rev. Astron. Astrophys., 20, 163–190.
- Shull et al. (1977) Shull, J. M., York, D. G., and Hobbs, L. M. 1977. Abundance variations in high-velocity interstellar gas. ApJ, 211, L139–L143.
- Slavin & Frisch (2002) Slavin, J. D. and Frisch, P. C. 2002. The ionization of the local interstellar cloud. ApJ.
- Smith et al. (1979) Smith, L. J., Willis, A. J., Wilson, R., Huber, M. C. E., and Nussbaumer, H. 1979. IUE observations of interstellar Si IV and C IV lines and absorption by hot gas in the ring nebula NGC 6888. In The first year of IUE; Proceedings of the Symposium, London, England, April 4-6, 1979. (A80-16301 04-90) London, University College, 1979, p. 18-30., pages 18–30.
- Snow (1975) Snow, T. P. 1975. The depletion of interstellar elements and the interaction between gas and dust in space. ApJ, 202, L87–L90.
- Snow (1976) Snow, T. P. 1976. A review of ultraviolet astronomical research with the Copernicus satellite. Earth and Extraterrestrial Sciences, 3, 1–2.
- Snow & Witt (1996) Snow, T. P. and Witt, A. N. 1996. Interstellar depletions updated: Where all the atoms went. ApJ, 468, L65–L68.
- Sonneborn et al. (2000) Sonneborn, G., Tripp, T. M., Ferlet, R., Jenkins, E. B., Sofia, U. J., Vidal-Madjar, A., and Woźniak, P. . R. 2000. Spatial variability in the ratio of interstellar atomic deuterium to hydrogen. II. Observations toward gamma2 Velorum and zeta Puppis by the Interstellar Medium Absorption Profile Spectrograph. ApJ, 545, 277–289.
- Spitzer (1956) Spitzer, L., J. 1956. On a possible interstellar Galactic corona. ApJ, 124, 20–34.
- Spitzer (1996) Spitzer, L., J. 1996. Highly ionized interstellar atoms–heated, cooled, or mixed? ApJ, 458, L29–L32.
- Spitzer & Jenkins (1975) Spitzer, L., J. and Jenkins, E. B. 1975. Ultraviolet studies of the interstellar gas. Ann. Rev. Astron. Astrophys., 13, 133–164.
- Spitzer & Morton (1976) Spitzer, L., J. and Morton, W. A. 1976. Components in interstellar molecular hydrogen. ApJ, 204, 731–749.
- Spitzer (1968) Spitzer, L. 1968. Dynamics of Interstellar Matter and the Formation of Stars, volume 7 of Stars and Stellar Systems, pages 1–64.
- Spitzer (1978) Spitzer, L. 1978. Physical Processes in the Interstellar Medium. John Wiley & Sons, Inc., Newrk.
- Spitzer (1985) Spitzer, L. 1985. Average density along interstellar lines of sight. ApJ, 290, L21–L24.
- Spitzer (1997) Spitzer, L. 1997. Dreams, Stars, and Electrons. Princeton University Press.
- Spitzer (1954) Spitzer, L. J. 1954. Behavior of matter in space. ApJ, 120, 1–17.
- Spitzer & Fitzpatrick (1993) Spitzer, L. J. and Fitzpatrick, E. L. 1993. Composition of interstellar clouds in the disk and halo. I - HD 93521. ApJ, 409, 299–318.
- Stacy & Jackson (1982) Stacy, J. G. and Jackson, P. D. 1982. Neutral hydrogen observations towards the Puppis Window of the Milky Way. A&AS, 50, 377–422.
- Stokes (1978) Stokes, G. M. 1978. Interstellar titanium. ApJS, 36, 115–141.
- Stromgren (1939) Stromgren, B. 1939. The physical state of interstellar hydrogen. ApJ, 89, 526+.
- Stromgren (1948) Stromgren, B. 1948. On the density distribution and chemical composition of the interstellar gas. ApJ, 108, 242–275.
- Taylor & Cordes (1993) Taylor, J. H. and Cordes, J. M. 1993. Pulsar distances and the galactic distribution of free electrons. ApJ, 411, 674–684.
- Trapero et al. (1996) Trapero, J., Welty, D. E., Hobbs, L. M., Lauroesch, J. T., Morton, D. C., Spitzer, L., and York, D. G. 1996. High-velocity gas in GHRS spectra of three OB stars. ApJ, 468, 290–305.
- Vallerga et al. (1993) Vallerga, J. V., Vedder, P. W., Craig, N., and Welsh, B. Y. 1993. High-resolution Ca II observations of the local interstellar medium. Astrophys. J., 411, 729–749.
- van de Hulst (1998) van de Hulst, H. C. 1998. Roaming through astrophysics. ARA&A, 36, 1–16.
- Verschuur (1975) Verschuur, G. L. 1975. High-velocity neutral hydrogen. ARA&A, 13, 257–293.
- Vidal-Madjar & Gry (1984) Vidal-Madjar, A. and Gry, C. 1984. Deuterium, helium, and the big-bang nucleosynthesis. A&A, 138, 285–289.
- Wakker & van Woerden (1997) Wakker, B. P. and van Woerden, H. 1997. High-velocity clouds. ARA&A, 35, 217–266.
- Wayte et al. (1978) Wayte, R. C., Wynne-Jones, I., and Blades, J. C. 1978. Detection of hyperfine structure of interstellar Na I in the alpha Cygni sight-line. MNRAS, 182, 5P–10P.
- Welsh et al. (1997) Welsh, B. Y., Sasseen, T., Craig, N., Jelinsky, S., and Albert, C. E. 1997. A minisurvey of interstellar titanium from the Southern Hemisphere. ApJS, 112, 507–526.
- Welty et al. (1999) Welty, D. E., Frisch, P. C., Sonneborn, G., and York, D. G. 1999. Interstellar abundances in the Magellanic Clouds. II. the line of sight to SN 1987A in the Large Magellanic Cloud. ApJ, 512, 636–671.
- Welty & Hobbs (2001) Welty, D. E. and Hobbs, L. M. 2001. A high-resolution survey of interstellar K I absorption. Astrophys. J. Supl., 133, 345–393.
- Welty et al. (1994) Welty, D. E., Hobbs, L. M., and Kulkarni, V. P. 1994. A high-resolution survey of interstellar Na I D1 lines. ApJ, 436, 152–175.
- Welty et al. (2000) Welty, D. E., Hobbs, L. M., Lauroesch, J. T., Morton, D. C., Spitzer, L., and York, D. G. 2000. The diffuse interstellar clouds toward 23 Orionis. ApJS, 124, 465–501.
- Welty et al. (1996) Welty, D. E., Morton, D. C., and Hobbs, L. M. 1996. A high-resolution survey of interstellar Ca II absorption. ApJS, 106, 533–562.
- White (1973) White, R. E. 1973. Ca I absorption and the electron densities in interstellar clouds. ApJ, 183, 81–86.
- White (1986) White, R. E. 1986. Interstellar lithium - differential depletion in diffuse clouds. ApJ, 307, 777–786.
- Wilson (1939) Wilson, O. C. 1939. Intercomparison of doublet ratio and line intensity for interstellar sodium and calcium. ApJ, 90, 244+.
- Wolfire et al. (1995) Wolfire, M. G., Hollenbach, D., McKee, C. F., Tielens, A. G. G. M., and Bakes, E. L. O. 1995. The neutral atomic phases of the interstellar medium. ApJ, 443, 152–168.
- York (1974) York, D. G. 1974. Highly ionized atoms observed with Copernicus. ApJ, 193, L127–L131.
- York (1976) York, D. G. 1976. A UV picture of the gas in the interstellar medium. Memorie della Societa Astronomica Italiana, 47, 493–551.
- York (1977) York, D. G. 1977. On the temperature and the interstellar nature of coronal gas observed by Copernicus. ApJ, 213, 43–51.
- York (1982) York, D. G. 1982. Gas in the galactic halo. Ann. Rev. Astron. Astrophys., 20, 221–248.
- Zank & Frisch (1999) Zank, G. P. and Frisch, P. C. 1999. Consequences of a change in the Galactic environment of the Sun. ApJ, 518, 965–973.